Sample Category Title
BoJ Holds Rates, Yen Gives Up Gains
The Japanese yen climbed 0.50% earlier against the US dollar but was unable to consolidate these gains. In the European session, USD/JPY is trading at 147.92, down 0.04% on the day.
Bank of Japan delivers hawkish hold
The Bank of Japan maintained its key interest rate at 0.50% at today's meeting. The non-move was widely expected by the markets. What was a surprise was the split vote, as two of the nine members voted in favor of a rate hike, indicating some support for a more hawkish montary policy.
Governor Ueda has been cautious and has the markets guessing as to when the BoJ will raise rates. The markets have priced in a 59% chance of a rate hike before the end of the year, up from 50% a week ago, according to LSEG.
The policy statement noted that the domestic economy had "recovered moderately" but was still showing signs of weakness. Members also expressed concern that exports will be hurt by US tariffs, with Japan facing a 15% tarriff on most of its exports to the US.
On the inflation front, the statement said that underlying inflation is weak but is expected to increase gradually and reach the 2% inflation target.
After years of deflation, prices are moving higher, which has led to expectations that a rate hike is just a question of timing. Consumer inflation is running between 2.5-3%, above the BoJ's 2% target. The central bank has stressed that it wants to see sustainable underling inflation at around 2% before the next rate hike.
The BoJ is also concerned about the political turmoil in Japan. Prime Minister Ishiba recently resigned and the ruling Liberal Democratic Party is holding an election to choose a new leader.
USD/JPY Technical
- USDJPY tested support at 1.4777 and 147.51 earlier
- There is resistance at 148.12 and 148.38
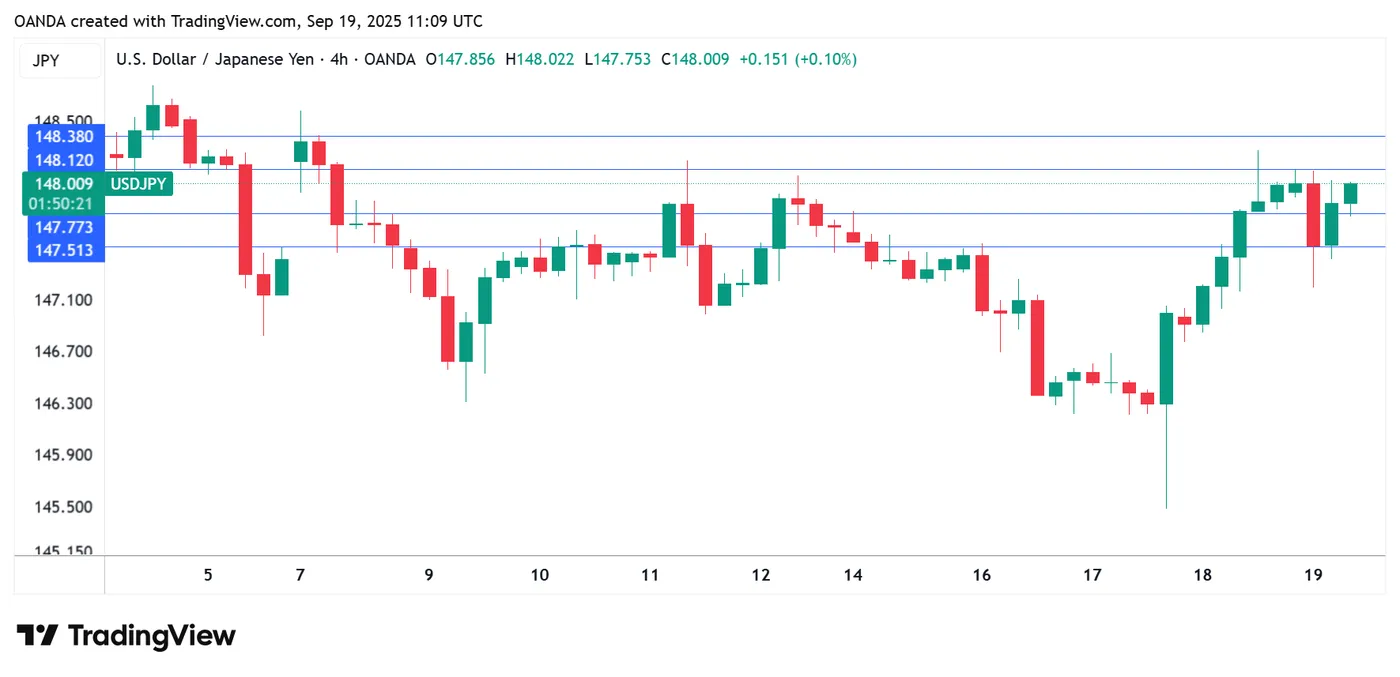
USDJPY 4-Hour Chart, September 19, 2025
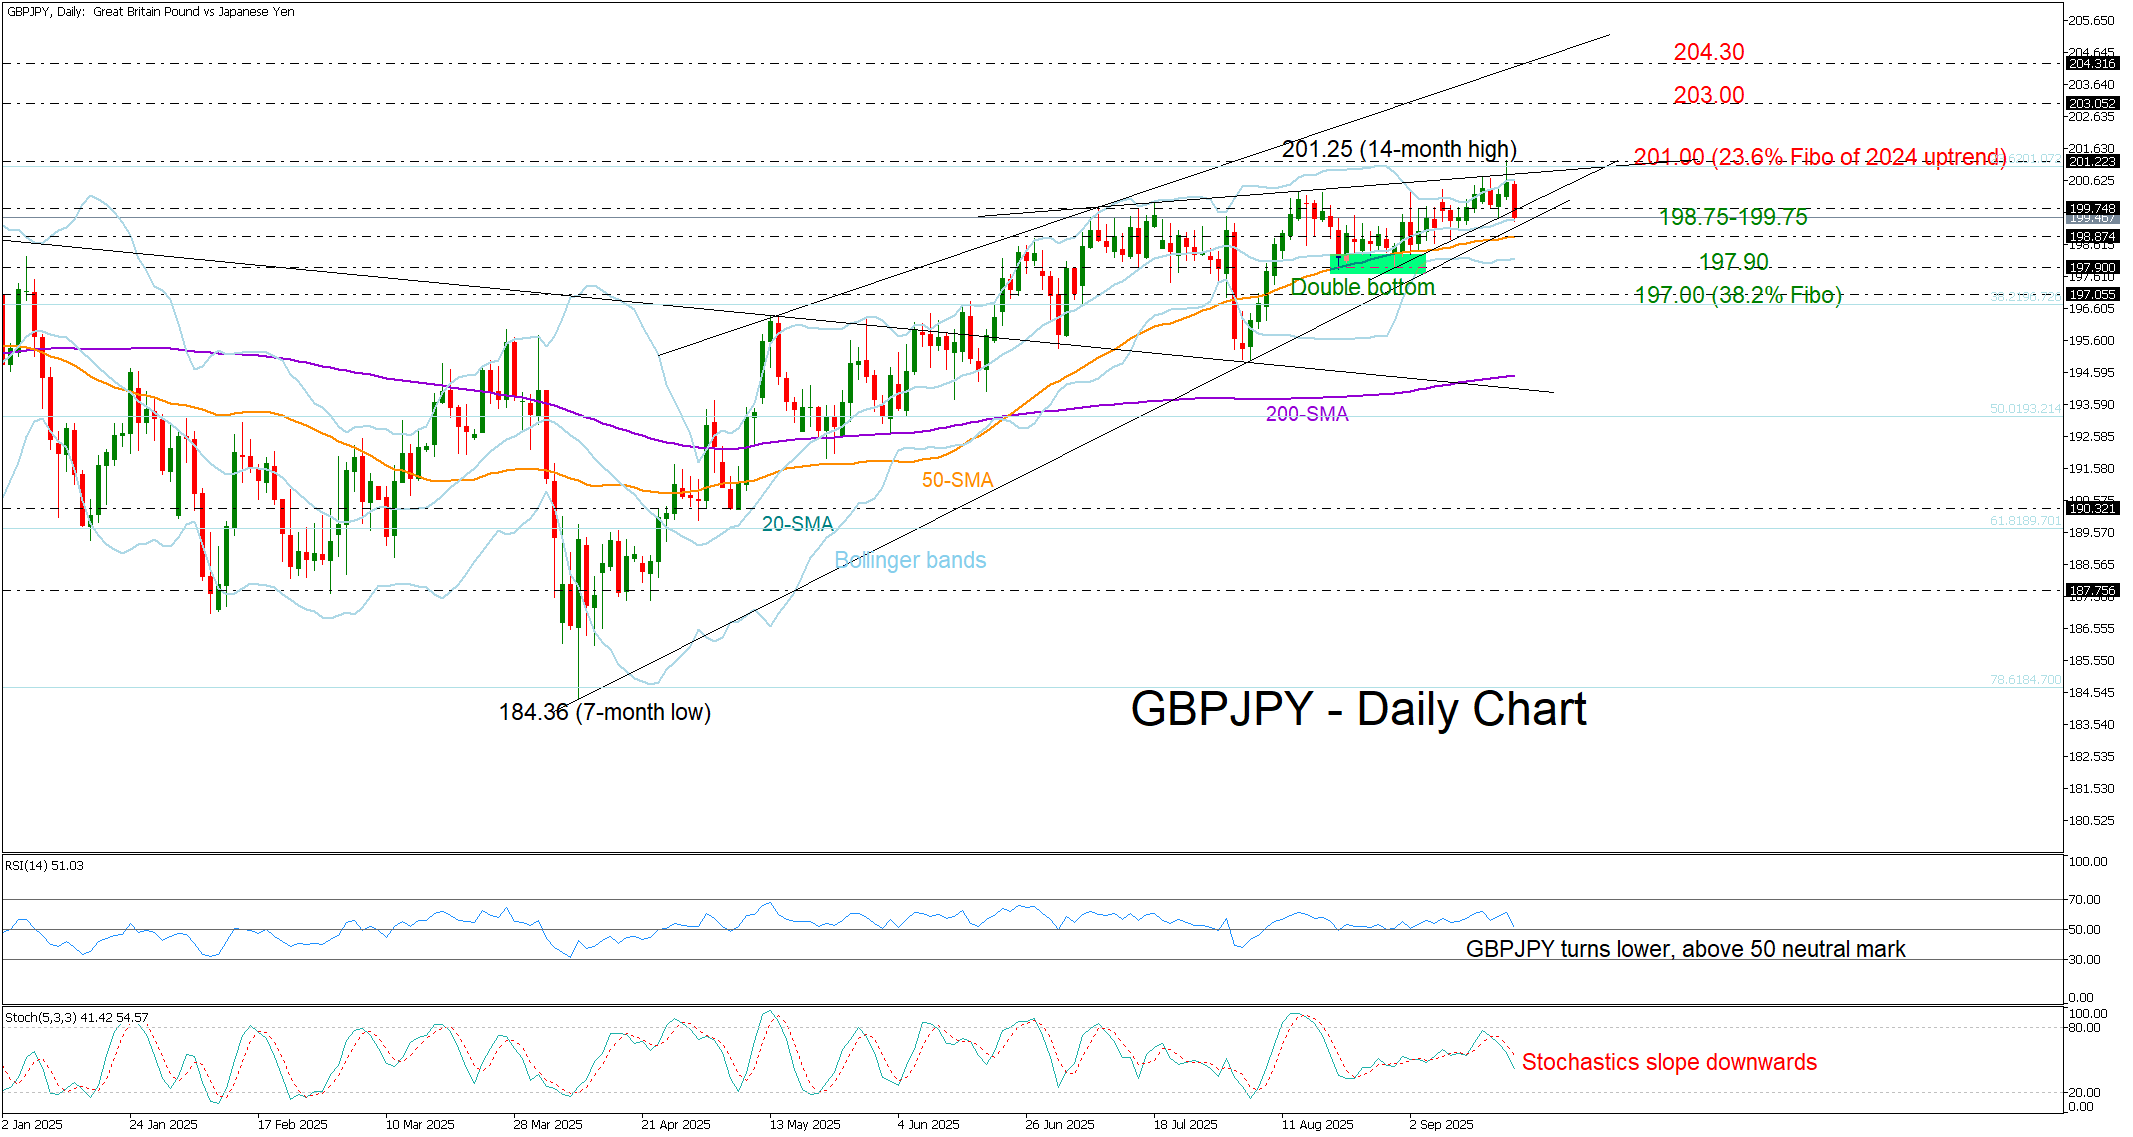
GBP/JPY Braces for Volatility
- GBPJPY pulls back from highs as BoJ hike scenario gains support.
- Short-term bias stays bullish, a new volatile episode might be underway.
GBPJPY slipped about 0.5% to 199.34 after the Bank of Japan held rates steady as expected but two policymakers surprisingly called for a hike to 0.75%. The central bank also announced plans to sell $250bn of traded funds.
The retreat immediately followed the peak at a 14-month high at 201.25, where the pair stalled below the 23.6% Fibonacci retracement of the 2024 uptrend. The focus is now on the 198.75-199.75 area, where the 20- and 50-day SMAs and the ascending trendline from April are positioned. A break lower could expose 197.90 or even 197.00, where the 38.2% retracement level is located.
Momentum signals are softening, with the RSI and stochastics pointing lower. Still, as long as the RSI holds above 50, the bulls have room to regroup. In any case, the Bollinger Band squeeze suggests a new episode of volatility is imminent.
In the event buying interest resurfaces above 199.75, the pair may again battle the 201.00 bar with scope to meet the 203.00 mark and possibly stretch up to the key resistance line at 204.30.
Overall, despite selling pressure, the short-term outlook remains constructive. Holding 198.90–199.35 would preserve the bullish path.
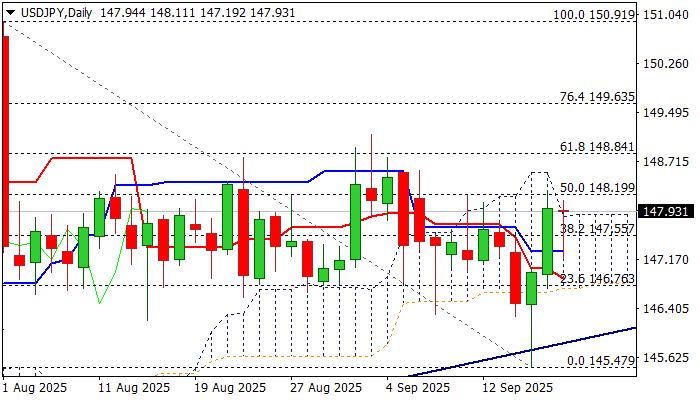
USDJPY: Firm Break Above Daily Cloud Top to Boost Bullish Outlook, Bear-Trap Underpins Recovery
USDJPY regained traction and bounced near Thursday’s one-week high after the Bank of Japan left rates unchanged but signaled potential earlier than expected rate hikes that temporarily inflated yen.
Strong rally in past two days was sparked by Fed’s overall less dovish than expected projections for 2026.
Wednesday’s bullish candle with long tail reflected turbulent post-FOMC action, which resulted in strong downside rejection and formation of bear-trap under 100DMA) and provided positive signal.
Fresh recovery returned to daily Ichimoku cloud and rose through entire cloud (spanned between 146.72 and 147.87) to probe above cloud top on Friday.
Close above cloud top is needed to boost positive near-term outlook, with break above nearby Fibo barrier at 148.20 (50% retracement of 150.91/145.47) to confirm signal and expose targets at 148.58 (200DMA), 148.84 (Fibo 61.8%) and 149.13 (Sep 3 top).
Daily studies are bullishly aligned but require further improvement to stronger underpin the action.
Caution on failure to clear daily cloud top that may keep bulls on hold, though will be biased higher while holding above 55DMA / broken Fibo 38.2% (147.56).
Res: 147.87; 148.20 148.58; 148.84
Sup: 147.56; 147.19;146.72; 146.23
What Was Important for US Dollar Index (DXY) This Week
The long-awaited event — the Fed’s first rate cut of 2025 — has taken place. What is particularly important to note is the price action on the US Dollar Index (DXY) chart.
The value of the USD against a basket of other currencies made a two-step move, forming a pin-bar candle with a long lower shadow:
→ Arrow 1: When the Fed actually announced the easing, the dollar weakened as expected on this “dovish news.”
→ Arrow 2: But at the subsequent press conference, Fed Chair Jerome Powell delivered a series of “hawkish” remarks that shifted the market mood and drove the dollar higher. He stressed that this cut does not mark the beginning of “a series of continuous rate reductions,” and that further decisions will be taken “based on incoming economic data.”
Powell also stated plainly that the option of a more aggressive 50-basis-point cut had not gained sufficient support among FOMC members. Therefore, the “down-then-up” move highlights a sharp change in trader sentiment within a short timeframe, as expectations failed to materialise.
Technical Analysis of the DXY Chart
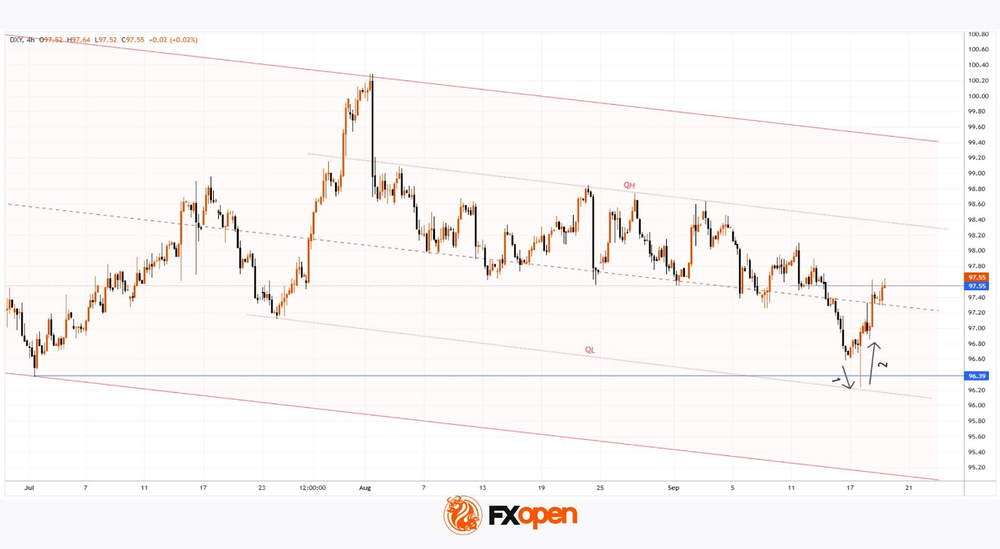
In our 9 September analysis, we confirmed the relevance of:
→ the descending channel (shown in red) defined by a sequence of lower highs and lower lows;
→ the intermediate QL and QH lines, which divide the channel into quarters.
Notably, at Wednesday’s low the price:
→ touched the QL line, underscoring its strength;
→ formed a clear Liquidity Grab pattern (in the terminology of the Smart Money Concept methodology).
From the perspective of Richard Wyckoff’s method, Wednesday’s low may be viewed as a Spring pattern, which preceded a Mark-Up phase of rising prices.
How Might Events Unfold Next?
Given the above, we could assume that the hawkish tone could serve as a longer-term factor for the DXY index. The 97.55 level appears to act as resistance, but it is possible that we may see an attempt to break through it, with the next target being the QH line.
Trade global index CFDs with zero commission and tight spreads. Open your FXOpen account now or learn more about trading index CFDs with FXOpen.
This article represents the opinion of the Companies operating under the FXOpen brand only. It is not to be construed as an offer, solicitation, or recommendation with respect to products and services provided by the Companies operating under the FXOpen brand, nor is it to be considered financial advice.
EUR/USD Corrects Lower in Post-Fed Pause
The EUR/USD pair extended its decline on Friday, retreating further following the US Federal Reserve’s September meeting. The US dollar found support as the Fed’s rhetoric proved less dovish than markets had anticipated.
While the central bank cut rates by 25 basis points and signalled two additional cuts in 2025, it projected only one further reduction in 2026, tempering expectations for more aggressive easing. Chair Jerome Powell described the decision as a “risk management” response to a softening labour market, emphasising that the Fed saw “no need to rush” into further moves.
The dollar drew additional strength from initial jobless claims data, which fell to 231,000 – below forecasts of 241,000 and well under the previous week’s revised figure of 264,000.
Earlier in the week, eurozone inflation held steady at 2.0% year-on-year in August, unchanged from July and slightly better than the 2.1% forecast.
Despite this week’s pullback, the broader trend for EUR/USD remains bullish.
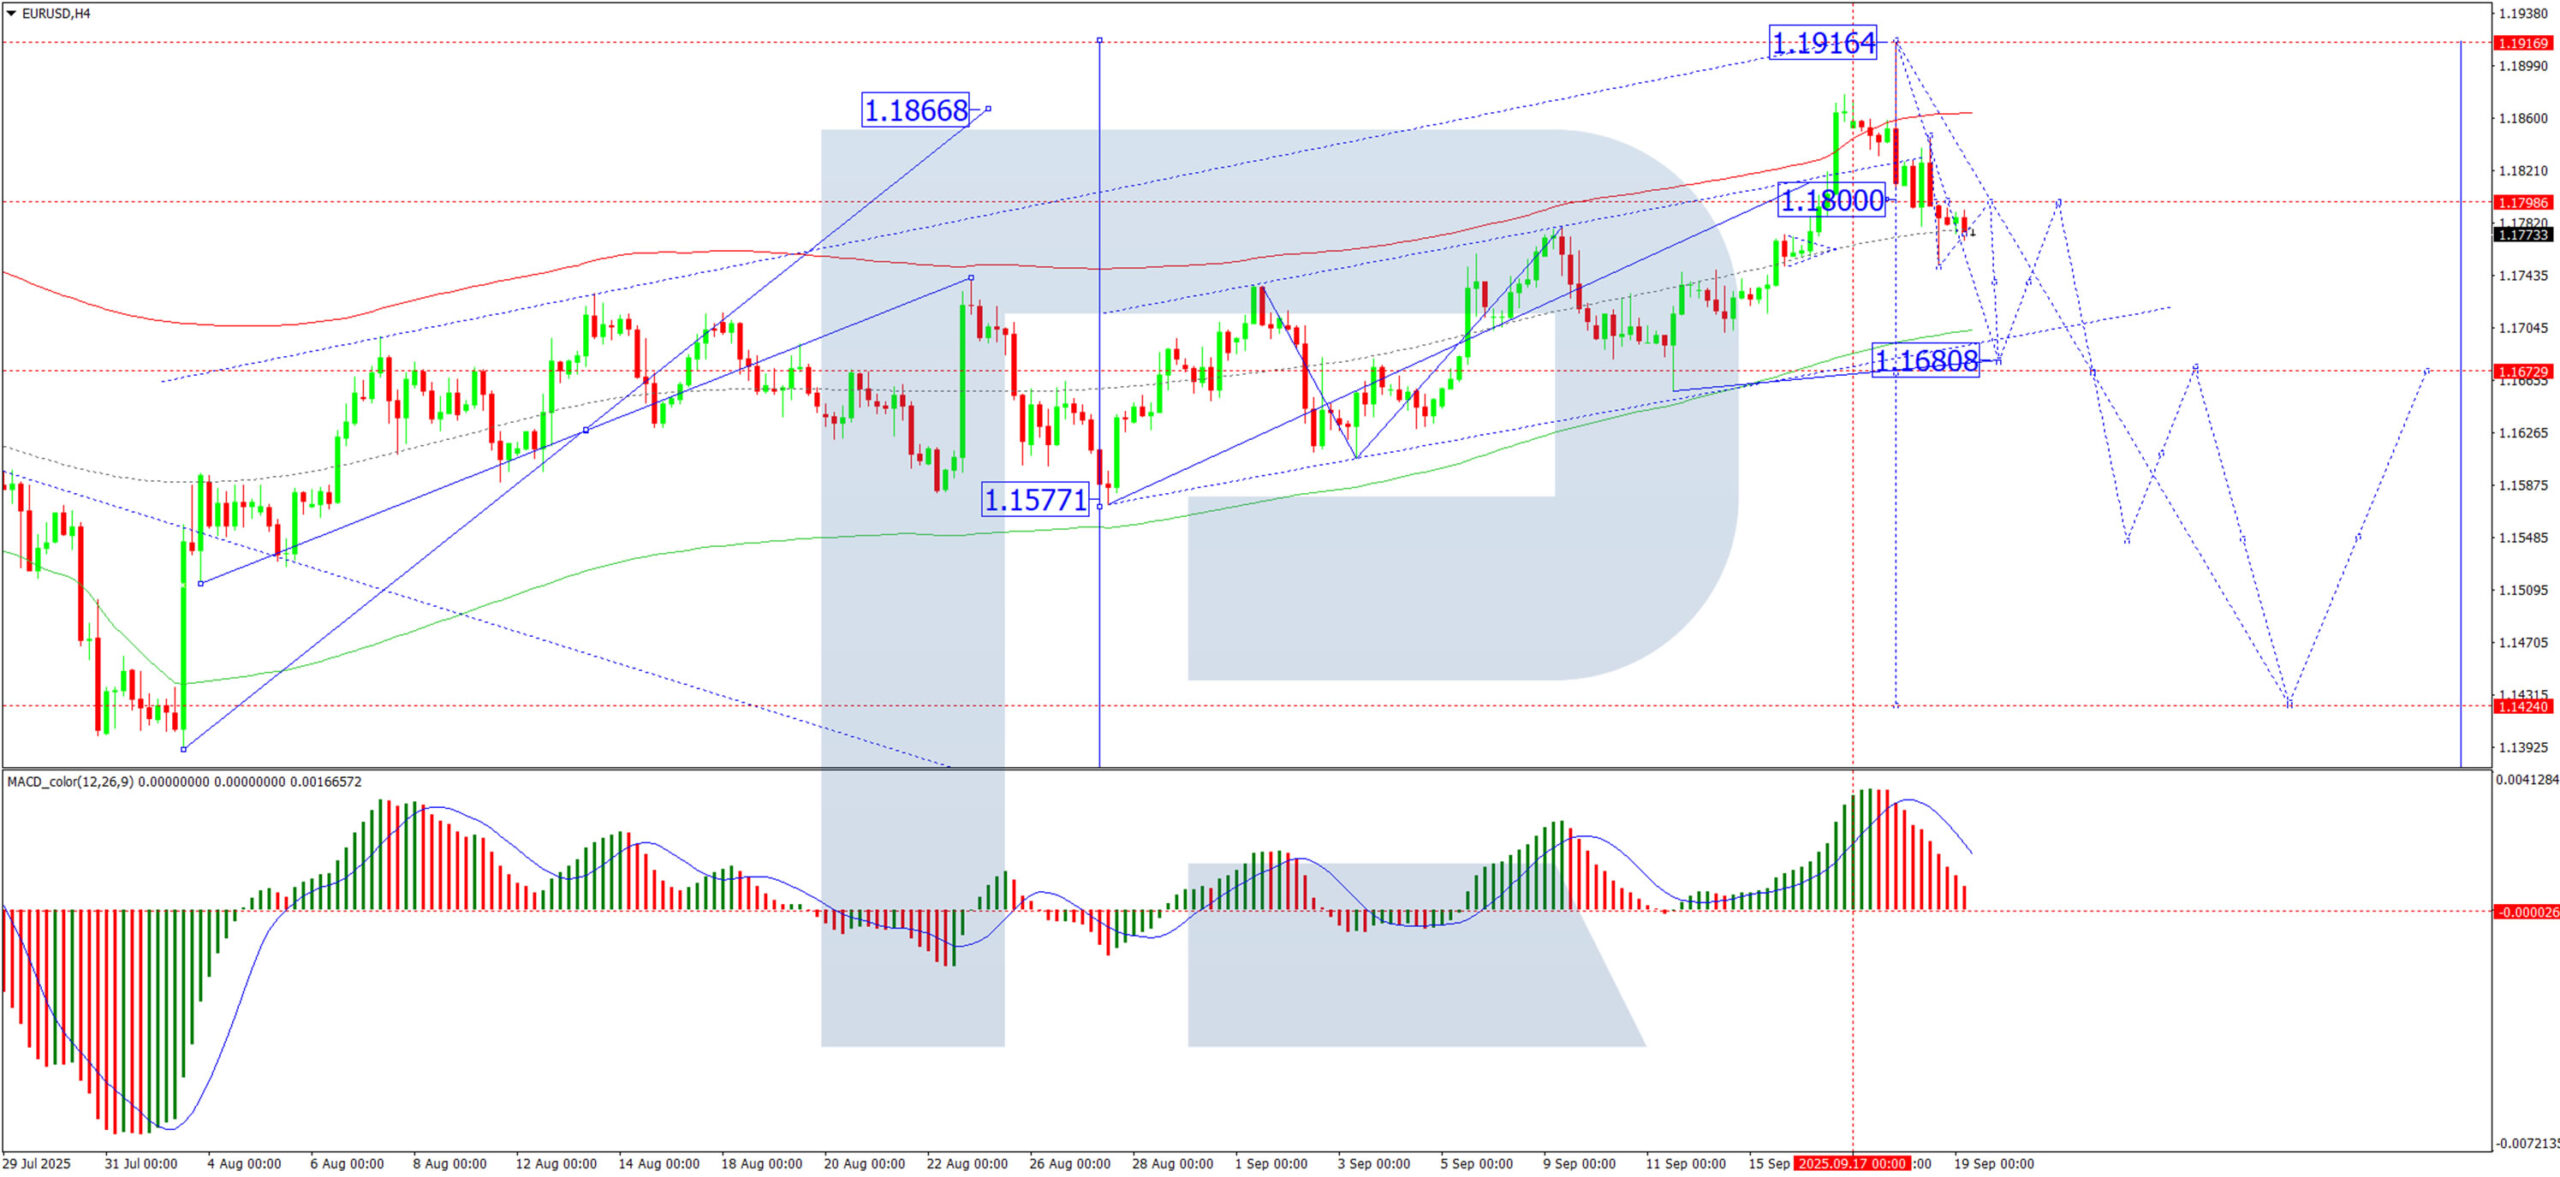
Technical Analysis: EUR/USD
H4 Chart:
On the H4 chart, EUR/USD formed a consolidation range around 1.1800 USD before breaking downward. The pair is now extending its decline towards 1.1680 USD. Once this target is reached, a corrective rebound towards 1.1800 USD may follow. The MACD indicator supports this view: its signal line remains above zero but is trending firmly lower, reflecting building near-term selling pressure.
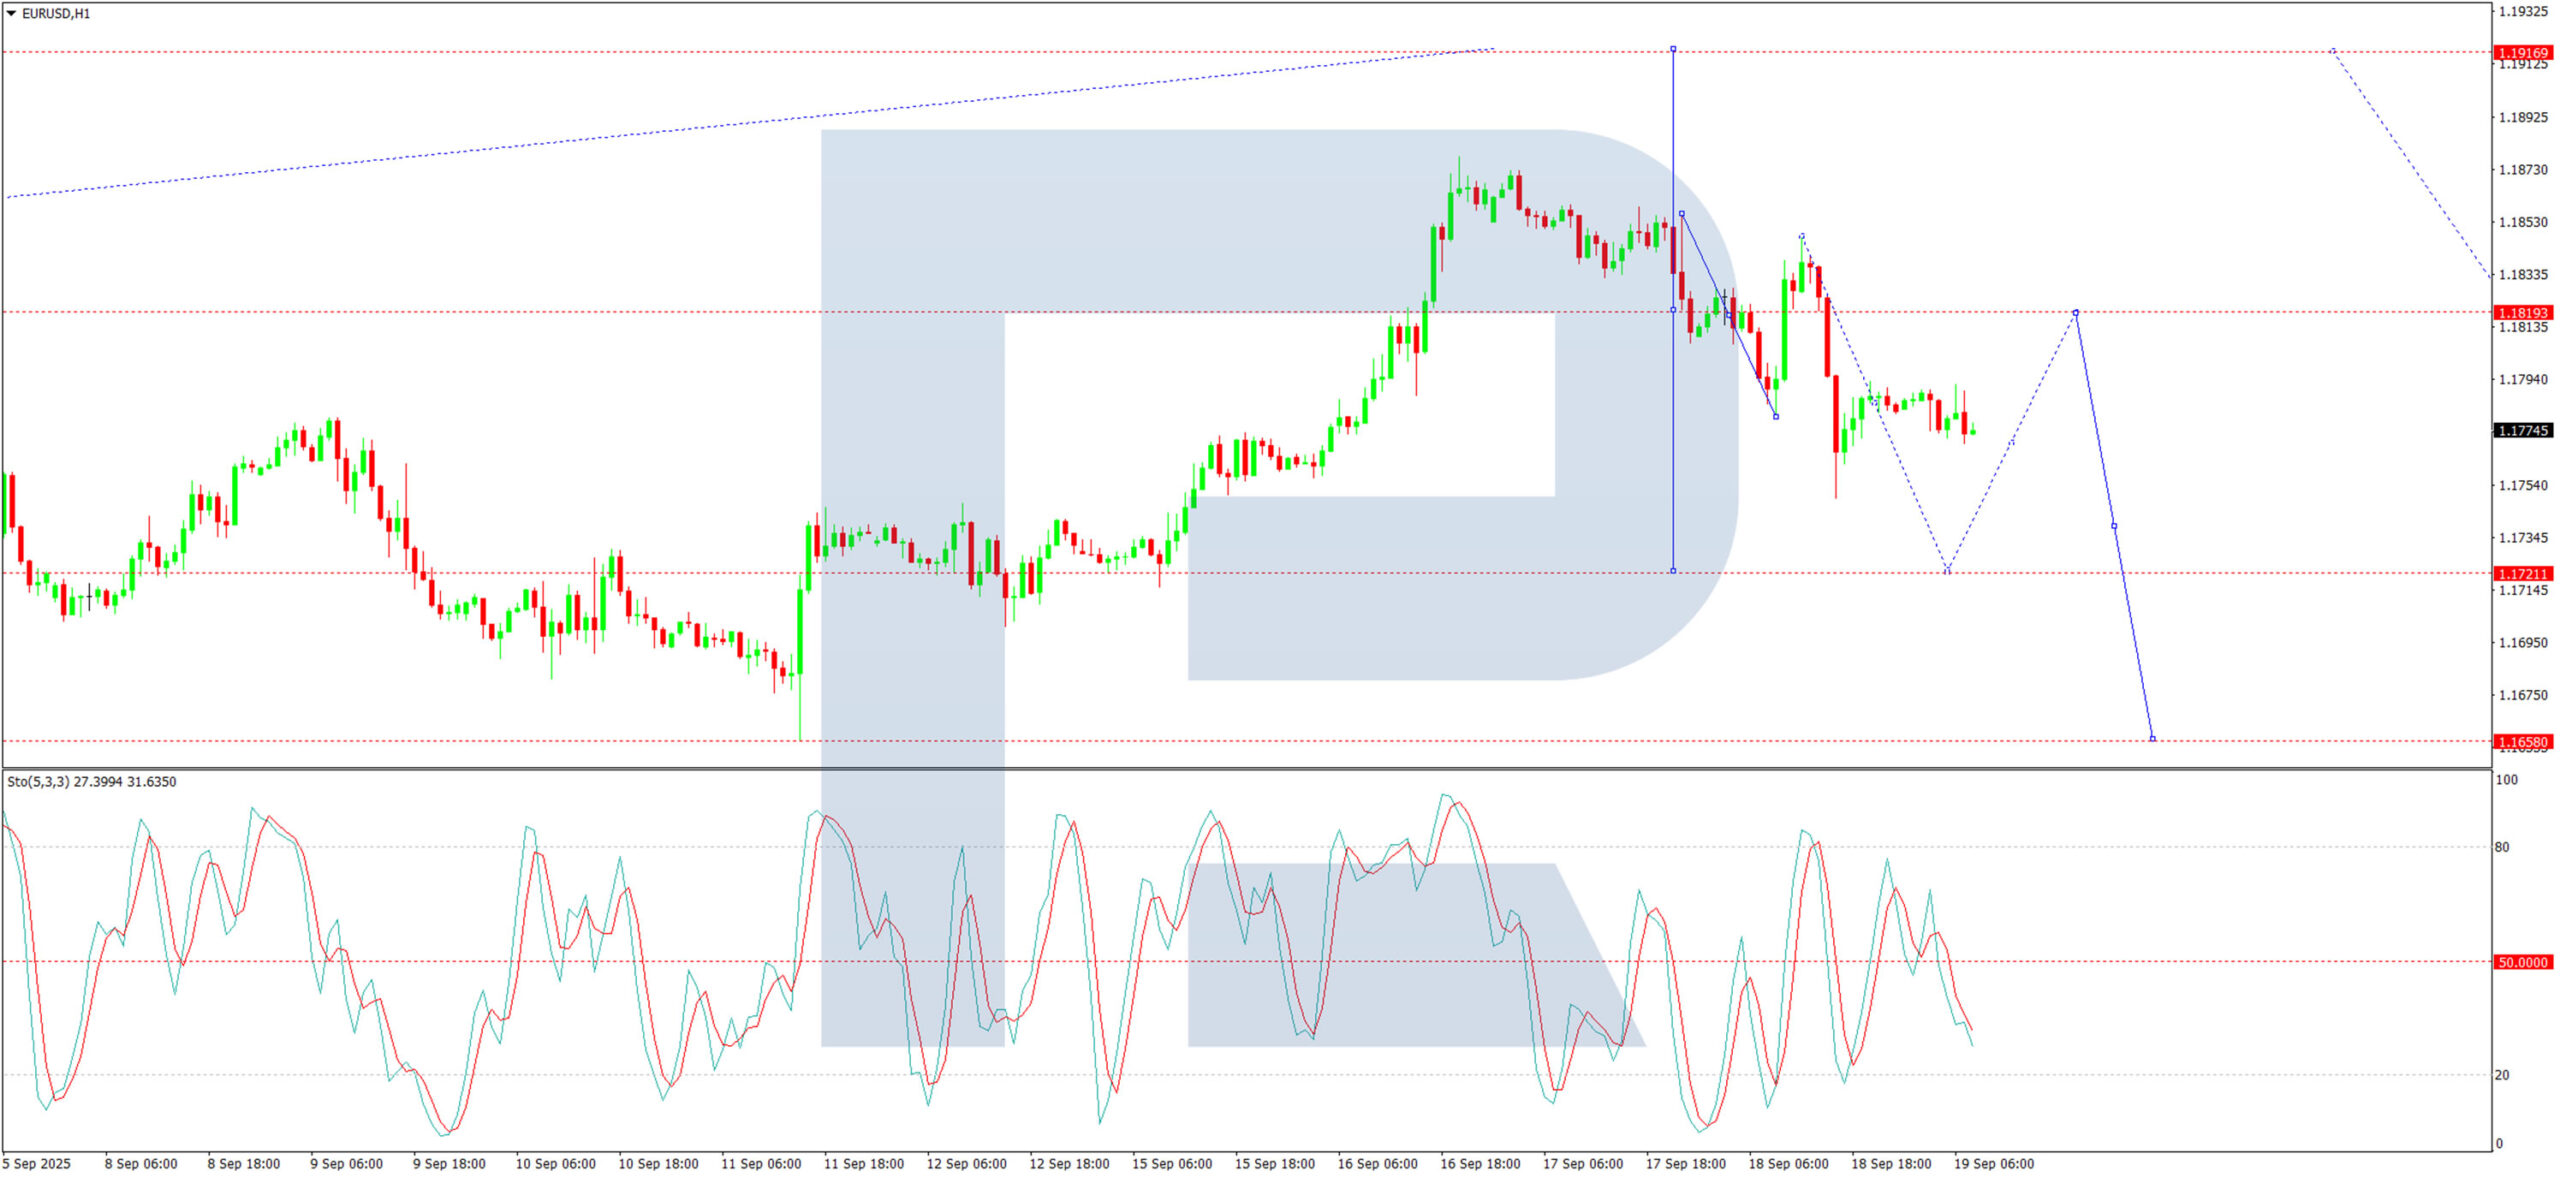
H1 Chart:
On the H1 chart, the pair completed a downward move to 1.1777 USD and a corrective bounce to 1.1845 USD. The market is now forming a new downward structure towards 1.1720 USD, with further downside potential to 1.1680 USD. A brief correction towards 1.1800 USD is possible before any renewed decline towards 1.1630 USD, and eventually 1.1550 USD. The Stochastic oscillator confirms the near-term bearish momentum, with its signal line below 50 and pointing downward towards 20.
Conclusion
EUR/USD is undergoing a technical correction after the Fed tempered expectations for aggressive easing. While the dollar has found near-term support, the euro’s underlying fundamentals remain steady, with inflation under control and growth concerns limited. The pair’s broader uptrend is likely to resume once the current corrective phase concludes, though a deeper retracement cannot be ruled out if US data continues to surprise to the upside. Traders will be watching next week’s eurozone PMI and US PCE data for fresh directional catalysts.
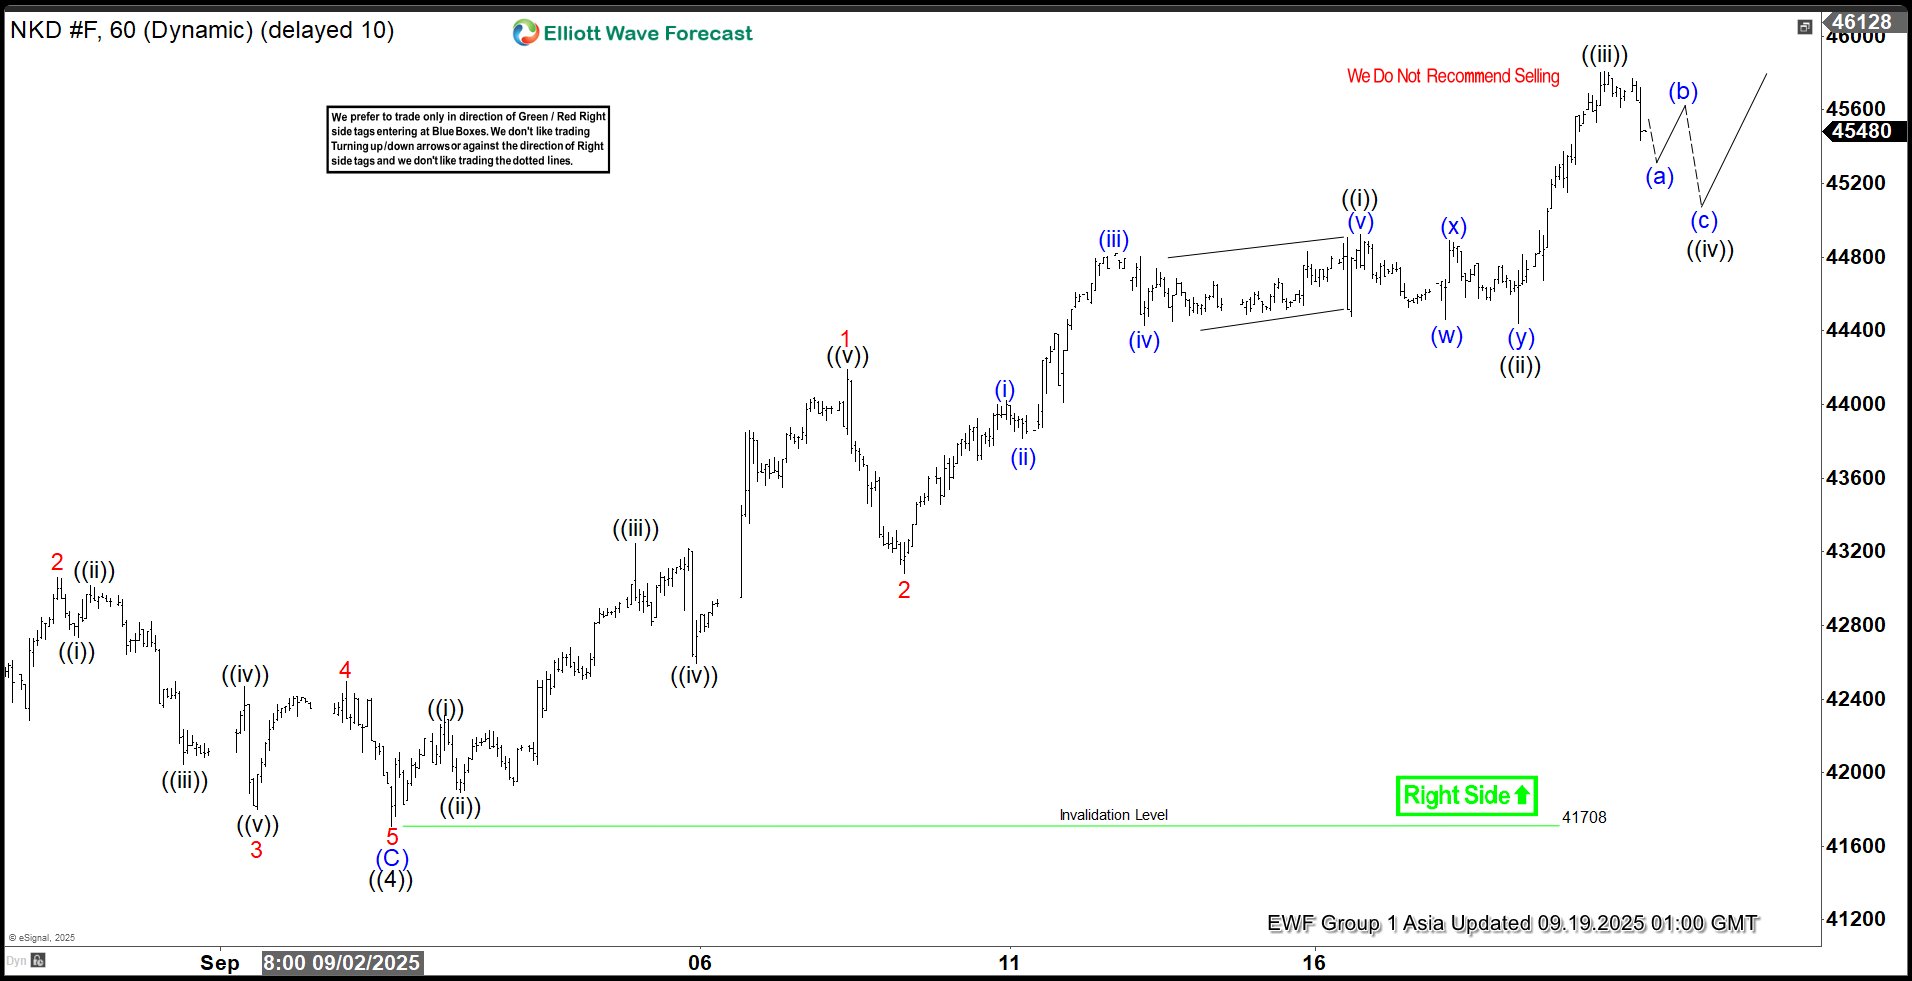
Elliott Wave Update: Nikkei (NKD) Advances in Fifth Wave
The short-term Elliott Wave analysis for Nikkei Futures (NKD) indicates that the pullback to 41,708 on September 2, 2025, marked the completion of wave ((4)). The Index has since resumed its upward trajectory in wave ((5)), structured as a five-wave impulse. From the wave ((4)) low, wave ((i)) concluded at 42,260, followed by a dip in wave ((ii)) to 41,890. The subsequent wave ((iii)) advanced to 43,245, with a pullback in wave ((iv)) ending at 42,595. The final leg, wave ((v)), peaked at 44,190, completing wave 1 in a higher degree. A corrective wave 2 followed, bottoming out at 43,080.
The Index has now embarked on wave 3, exhibiting another impulsive five-wave structure in a lesser degree. From the wave 2 low, wave ((i)) reached 44,925, and a pullback in wave ((ii)) concluded at 44,440. The Index then surged in wave ((iii)) to 45,810. A corrective wave ((iv)) is anticipated to retrace the cycle from the September 18, 2025, low, unfolding in a 3, 7, or 11 swing pattern before resuming higher. As long as the pivot at 41,708 holds, any near-term pullback should find support in a 3, 7, or 11 swing, setting the stage for further upside.
Nikkei (NKD) – 60 Minute Elliott Wave Technical Chart:
NKD – Elliott Wave Technical Video:
https://www.youtube.com/watch?v=FYA72fCZHkQ
USD/JPY Technical: USD Strength Capped (Again) Below 148.95 Range Resistance, BoJ Keeps Rate Hike Hopes Alive
The USD/JPY dropped further on Wednesday, 17 September 2025, with an initial intraday loss of -0.7% to print an intraday low of 145.48 before it reversed up higher ex-post FOMC to close higher and erased all its initial losses, reinforced by Fed Chair Powell’s “less dovish” press conference.
The USD/JPY has managed to survive at the 145.95 medium-term support (the lower boundary of the “Ascending Wedge” range configuration) in place since the 22 April 2025 low of 139.89 and rallied by 1.9% in the past two days, from the 17 September 2025 low of 145.48 to the 18 September 2025 high of 148.27.
The 18 September 2025 high of 148.27 of the USD/JPY is just below a key minor range resistance of 148.75/148.95 that keeps the US dollar bulls in check since 12 August 2025.
US dollar’s intraday bearish reversal against the JPY, 2 BoJ officials favoured a rate hike
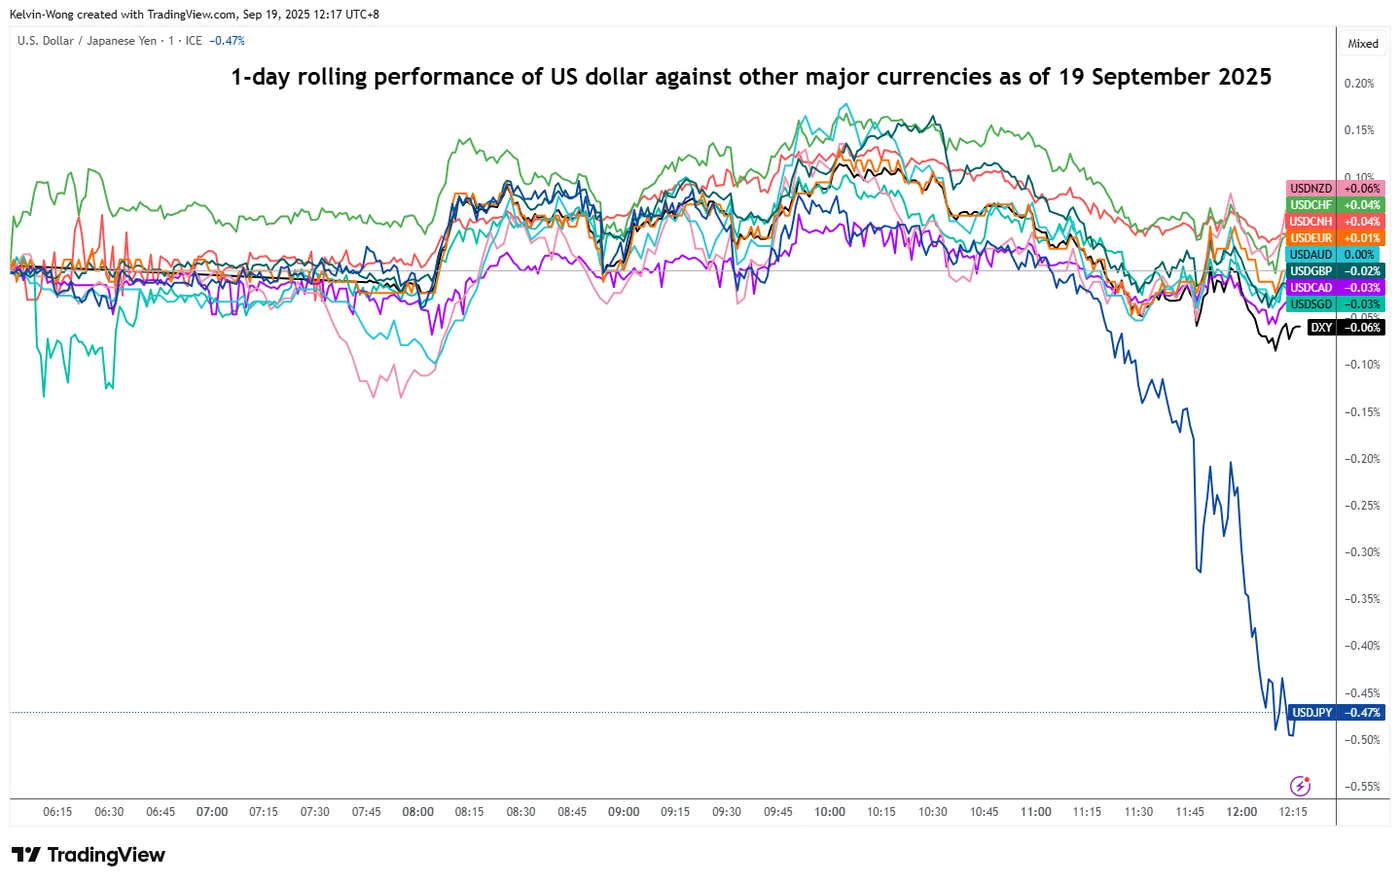
Fig. 1: 1-day rolling performances of the US dollar against major currencies as of 19 Sep 2025 (Source: TradingView)
Interestingly, the USD/JPY shed by -0.5% after the Bank of Japan (BoJ)’s monetary policy decision to keep its short-term policy interest rate unchanged at 0.5% as expected for the fifth consecutive meeting (see Fig. 1).
The main trigger of the US dollar's weakness against the Japanese yen was the BoJ officials’ voting patterns. In today’s BoJ’s monetary policy decision meeting, for the first time in 2025, two officials (Takata and Tamura) voted for an interest rate hike to 0.75%, citing that price stability (2% long-term inflation trend target in Japan) had been achieved, and the risks to prices becoming more skewed to the upside.
Let’s now examine fundamental factors.
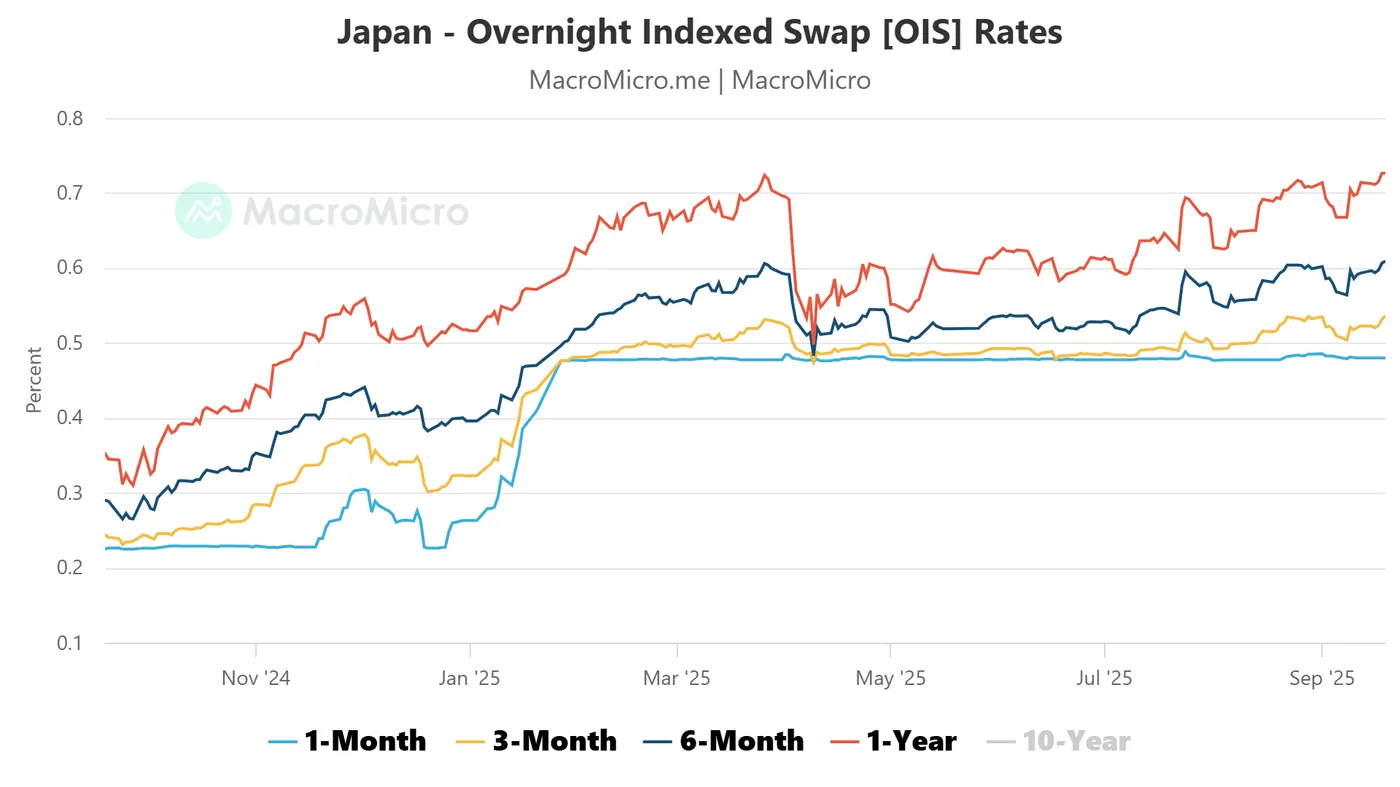
Fig. 2: Japan overnight interest rate swaps as of 19 Sep 2025 (Source: MacroMicro)
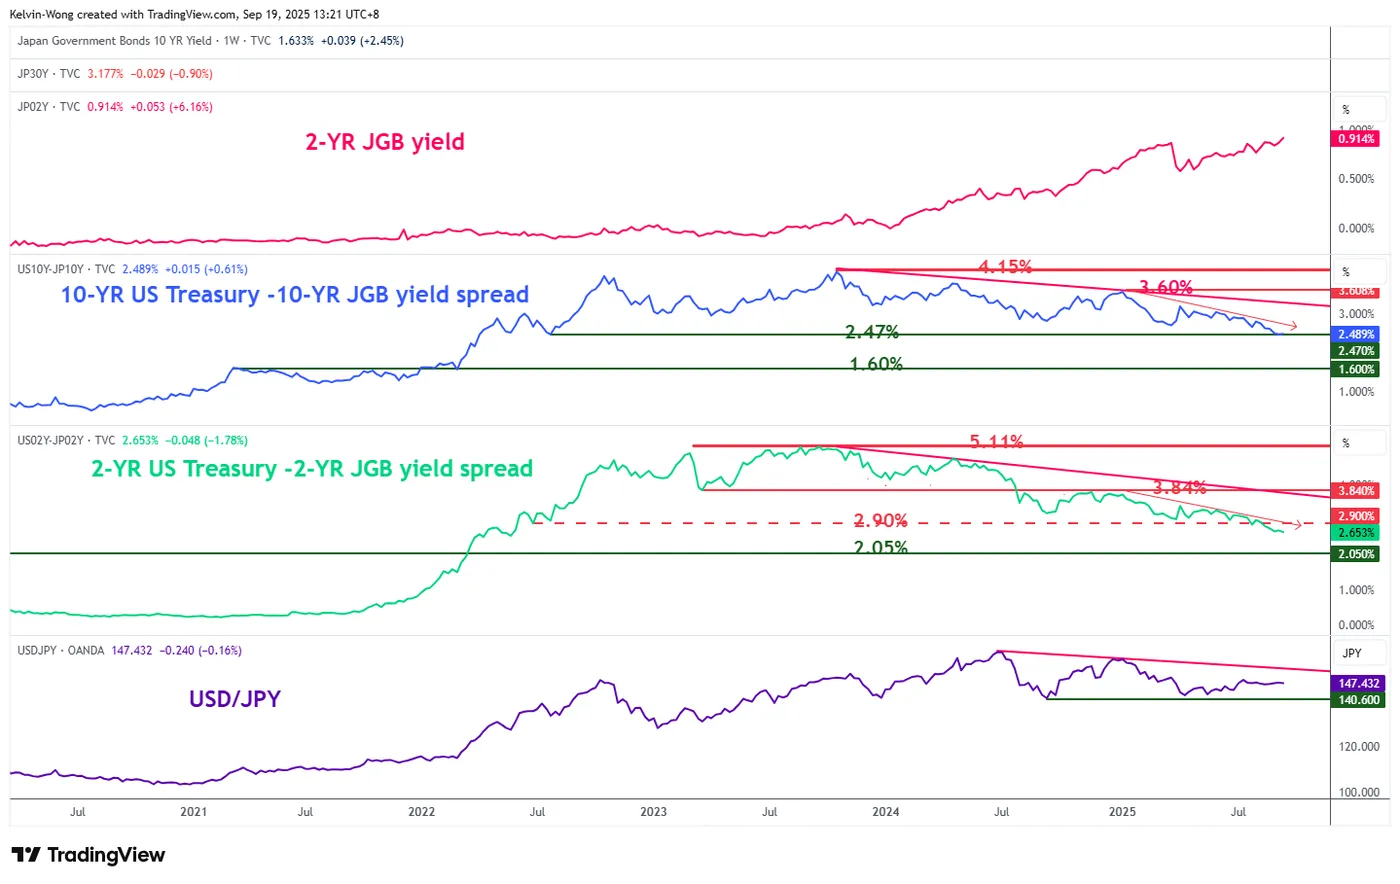
Fig. 3: Yield spreads of US Treasury/JGB with major trend of USD/JPY as of 19 Sep 2025 (Source: TradingView)
The overnight index swaps (OIS) market for Japan’s short-term interest rates is still pricing in a 25 basis points (bps) hike to the short-term overnight policy interest rate to 0.75% before 2025 ends.
The 3-month, 6-month, and 1-year OIS rates have continued to widen over the 1-month OIS rates in the past two weeks, where the 1-year OIS rate has increased from 0.67% on 8 September 2025 to 0.73% on Friday, 19 September 2025 at the time of writing (see Fig. 2).
The 2-year Japanese Government Bond (JGB) yield, which is sensitive to changes to the BoJ’s monetary policy stance, has continued its upward trajectory and climbed by to 0.91%, its highest level since 2008.
Hence, the yield premium between the 2-year US Treasury note and the 2-year Japanese Government Bond has continued to narrow steadily since the start of the year. The bearish breakdown of the 2.90% former major support on the week of 18 August 2025 is likely to add impetus for a further potential narrowing of the yield premium towards the next support at 2.05% (see Fig. 3).
This ongoing narrowing process suggests that 2-year US Treasuries have become relatively less attractive versus 2-year JGBs, reducing the yield premium in favour of the dollar. As a result, this dynamic may exert downside pressure on USD/JPY.
Let’s now examine the USD/JPY from a technical analysis perspective to determine its latest short-term (1 to 3 days) trend bias and key technical levels to watch.
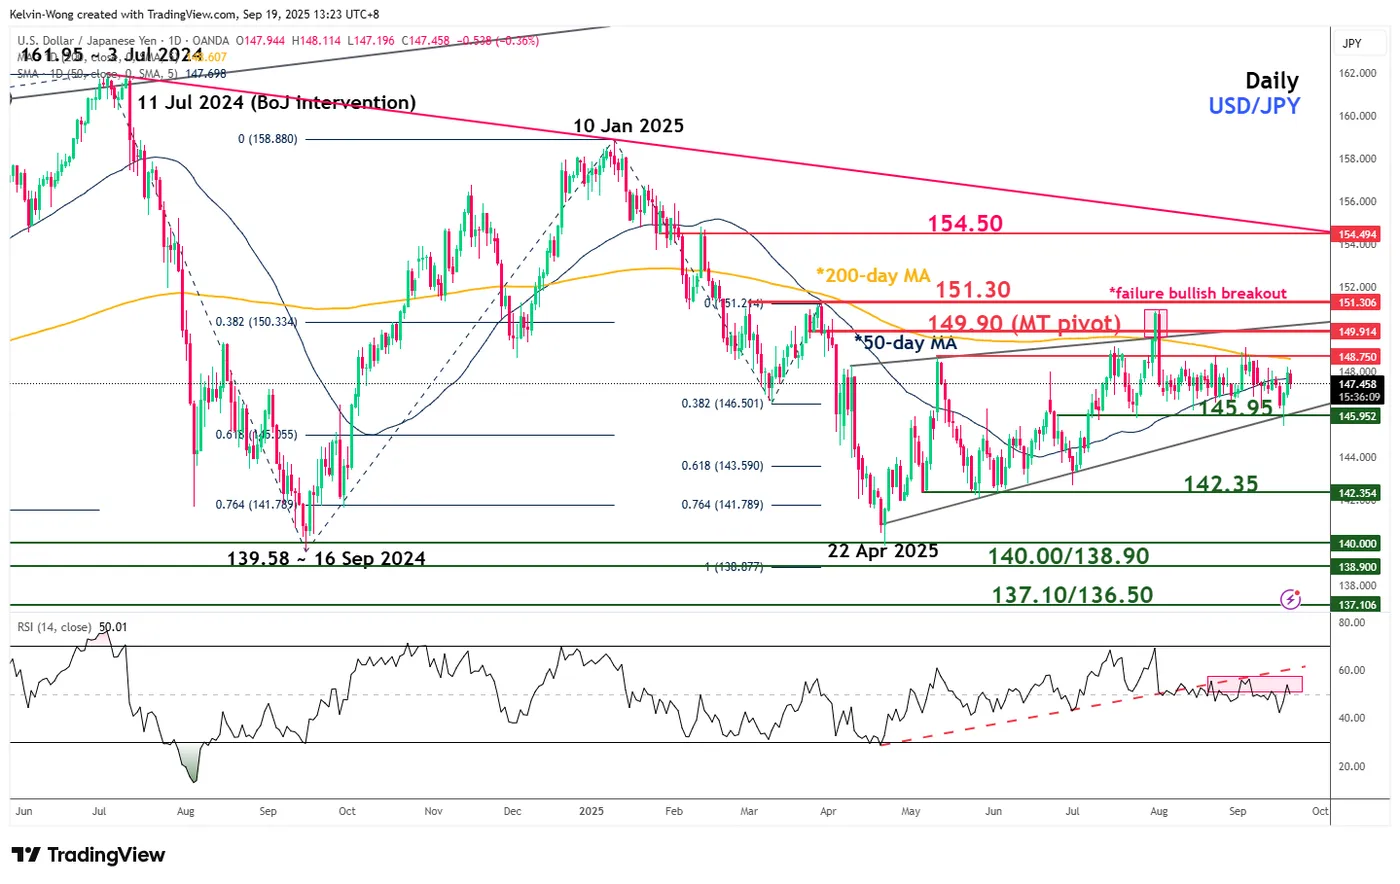
Fig. 4: USD/JPY medium-term trend as of 19 Sep 2025 (Source: TradingView)
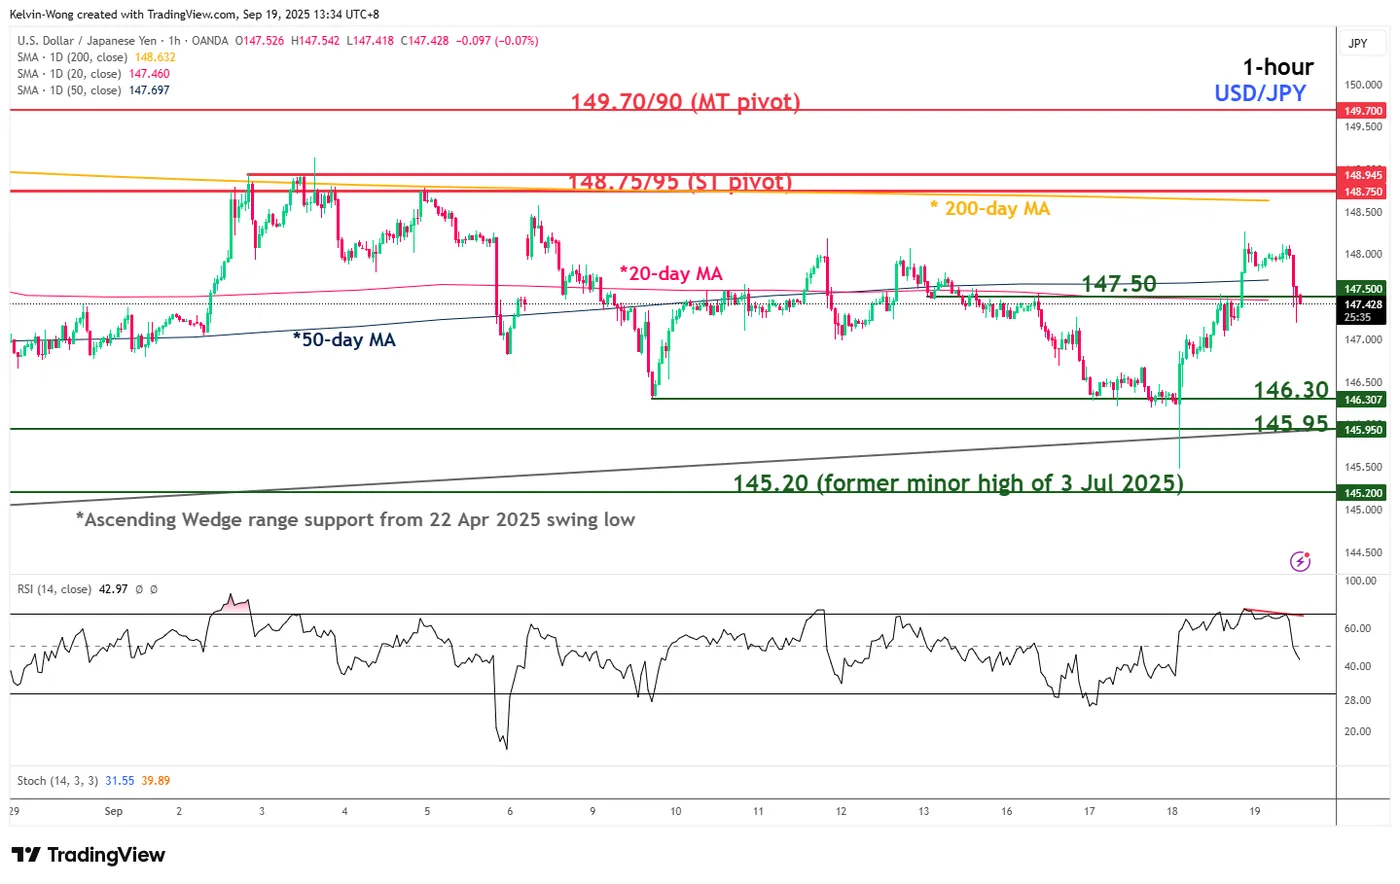
Fig. 5: USD/JPY minor trend as of 19 Sep 2025 (Source: TradingView)
Preferred trend bias (1-3 days)
Bearish bias below 148.75/148.95 short-term pivotal resistance for USD/JPY within its range configuration for the next intermediate support to come in at 146.30, followed by the medium-term “Ascending Wedge” range support at 145.95 (see Fig. 5)
Only a break with a daily close below 145.95 on the USD/JPY is likely to trigger the start of a medium-term (multi-week) Japanese yen strength against the greenback.
Key elements
- The daily RSI momentum indicator of the USD/JPY has continued to hover below its resistance at the 60 level and printed a “lower high”. These observations suggest the lack of medium-term bullish momentum (see Fig. 4).
- The 148.75/148.95 short-term pivotal resistance of the USD/JPY has also coincided with the key 200-day moving average that has capped dollar bulls' strength since 1 August 2025 (see Fig. 4).
- The hourly RSI momentum indicator has exited from its overbought level after it flashed out a bearish divergence condition (see Fig. 5).
Alternative trend bias (1 to 3 days)
A clearance above 148.95 invalidates the bearish scenario for the USD/JPY and sees a squeeze up towards the key medium-term resistance of 149.70/149.90 (the upper boundary of the “Ascending Wedge”).
Fed’s Dovish Stance Buoyed Stock Market
Buy the rumours, sell the facts. The US dollar was actively sold ahead of the announcement of the Fed meeting results. Investors expected the central bank to cut rates, with the FOMC’s updated forecasts showing two more acts of monetary expansion before the end of 2025, and the number of dissenters increasing from two in July to three.
In reality, only the first two expectations were met. The September forecast did indeed include two more rate cuts this year. The Fed lowered the rate by 25 basis points to 4.25% with 11 votes out of 12. Only the recently appointed president, Stephen Miran, voted for a 50 bp cut. However, after the initial downward impulse, the USD index went on a counterattack.
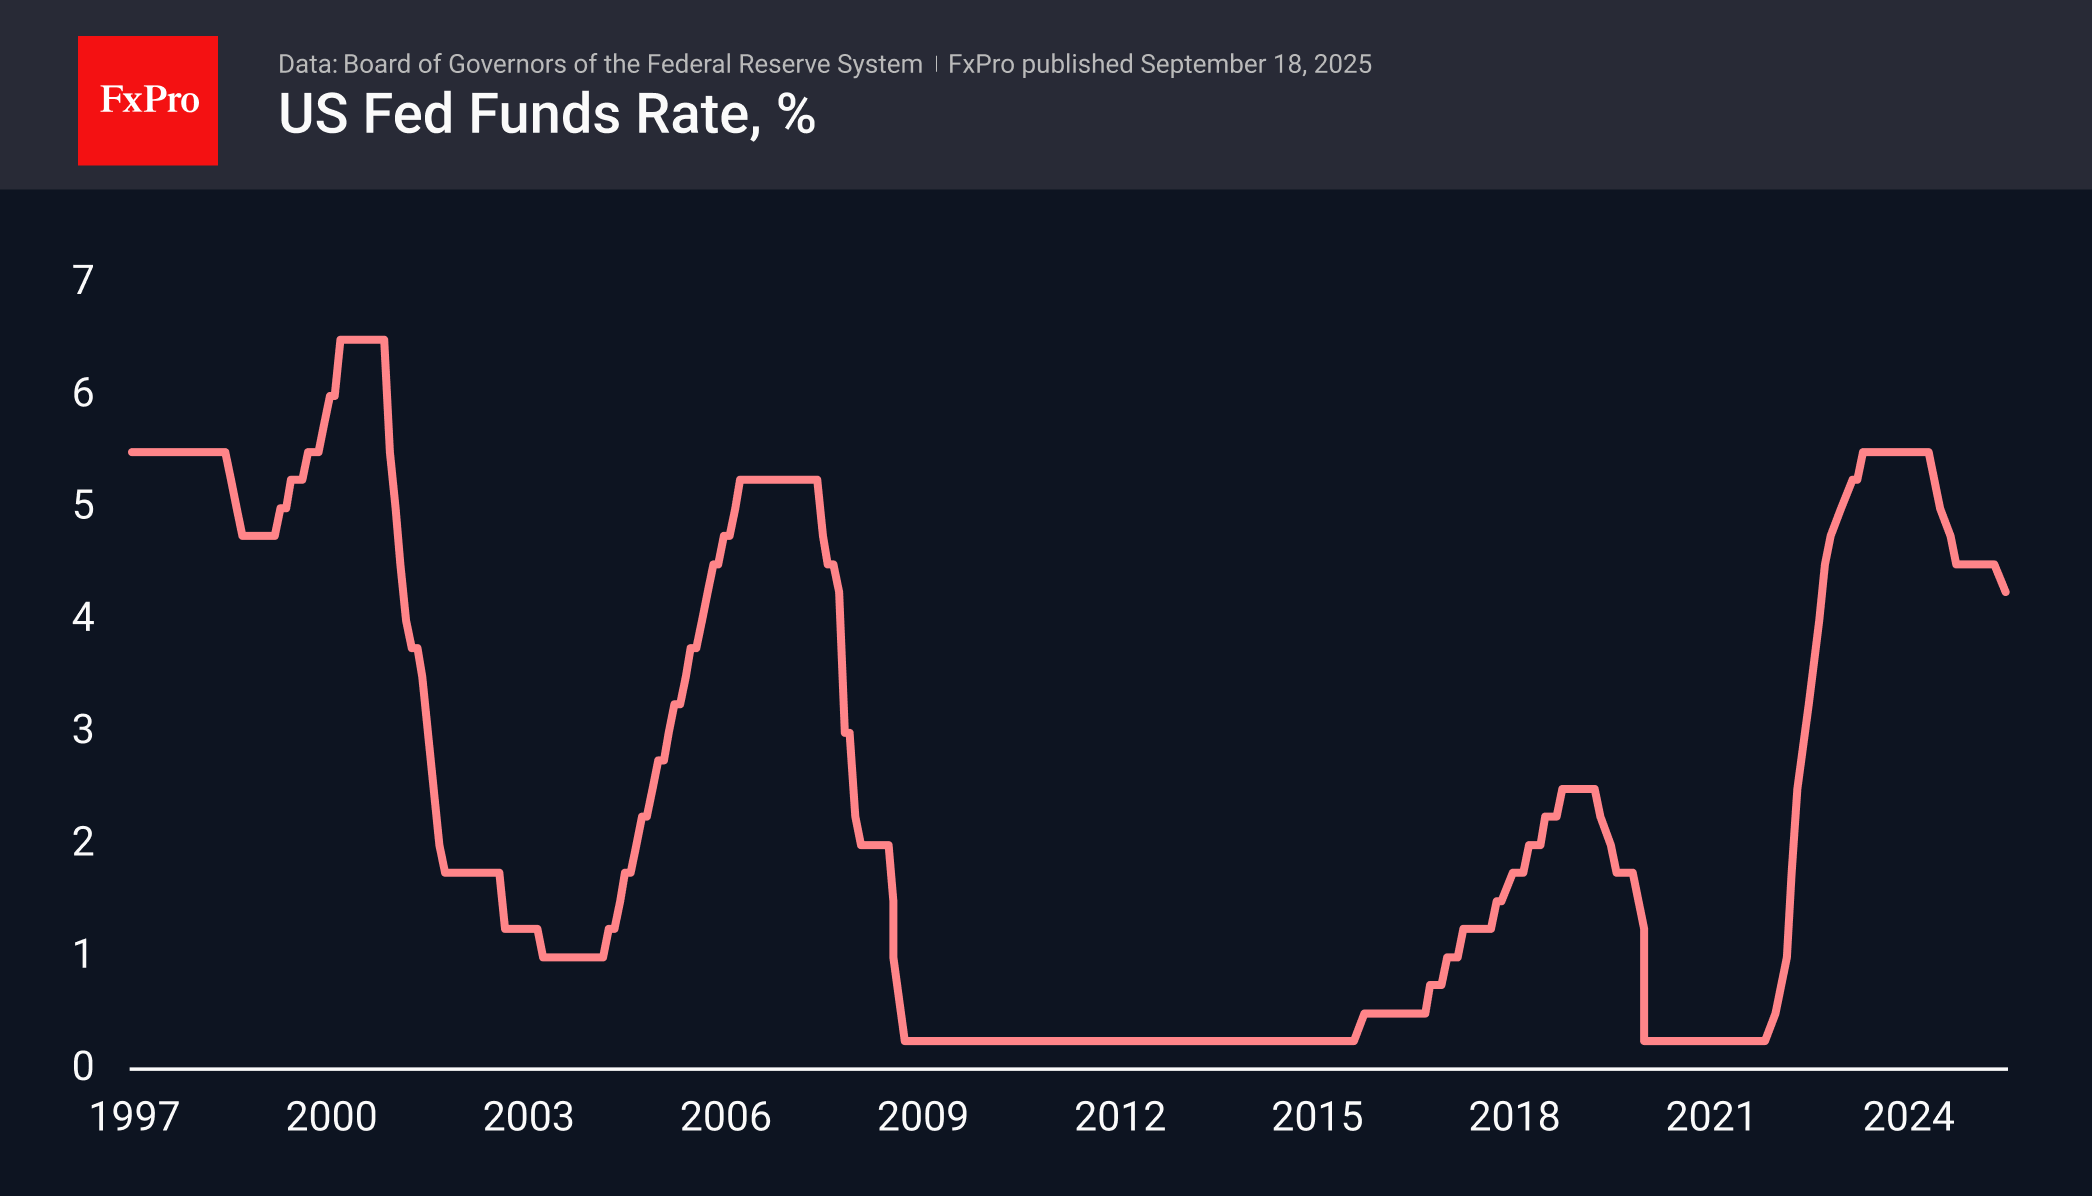
The US dollar’s success is primarily due to the closing of short positions. Fundamentals still do not favour the dollar. The Fed, as it did at the end of last year, will cut rates. The ECB and the Bank of England will leave them unchanged, while the Bank of Japan may raise them. Divergence in monetary policy encourages a strategy of selling the dollar’s rebounds.
Stock indices
Buying the dips in the S&P 500 is the most popular strategy in 2025. Bulls are lining up to pick up American stocks after the broad stock index fell following the September FOMC meeting and Jerome Powell’s comments. According to him, the Fed cannot avoid taking risks in a bilateral risk environment.
Over the past 50 years, the S&P 500 has risen in 13 out of 16 cases over a 6-week horizon if two conditions were met. The Fed cut rates, and the broad stock index was within 1% of its record high. History inspires bulls in US stocks.
At the same time, it is not wise to talk about a bubble. Over the past 12 months, the S&P 500 Information Technology Index has risen 27%, and the profits of its constituent issuers have risen 26.9%. For the rest of the broad stock index, these figures are 13% and 6.4%. If the market is overbought, it is outside of technology companies.
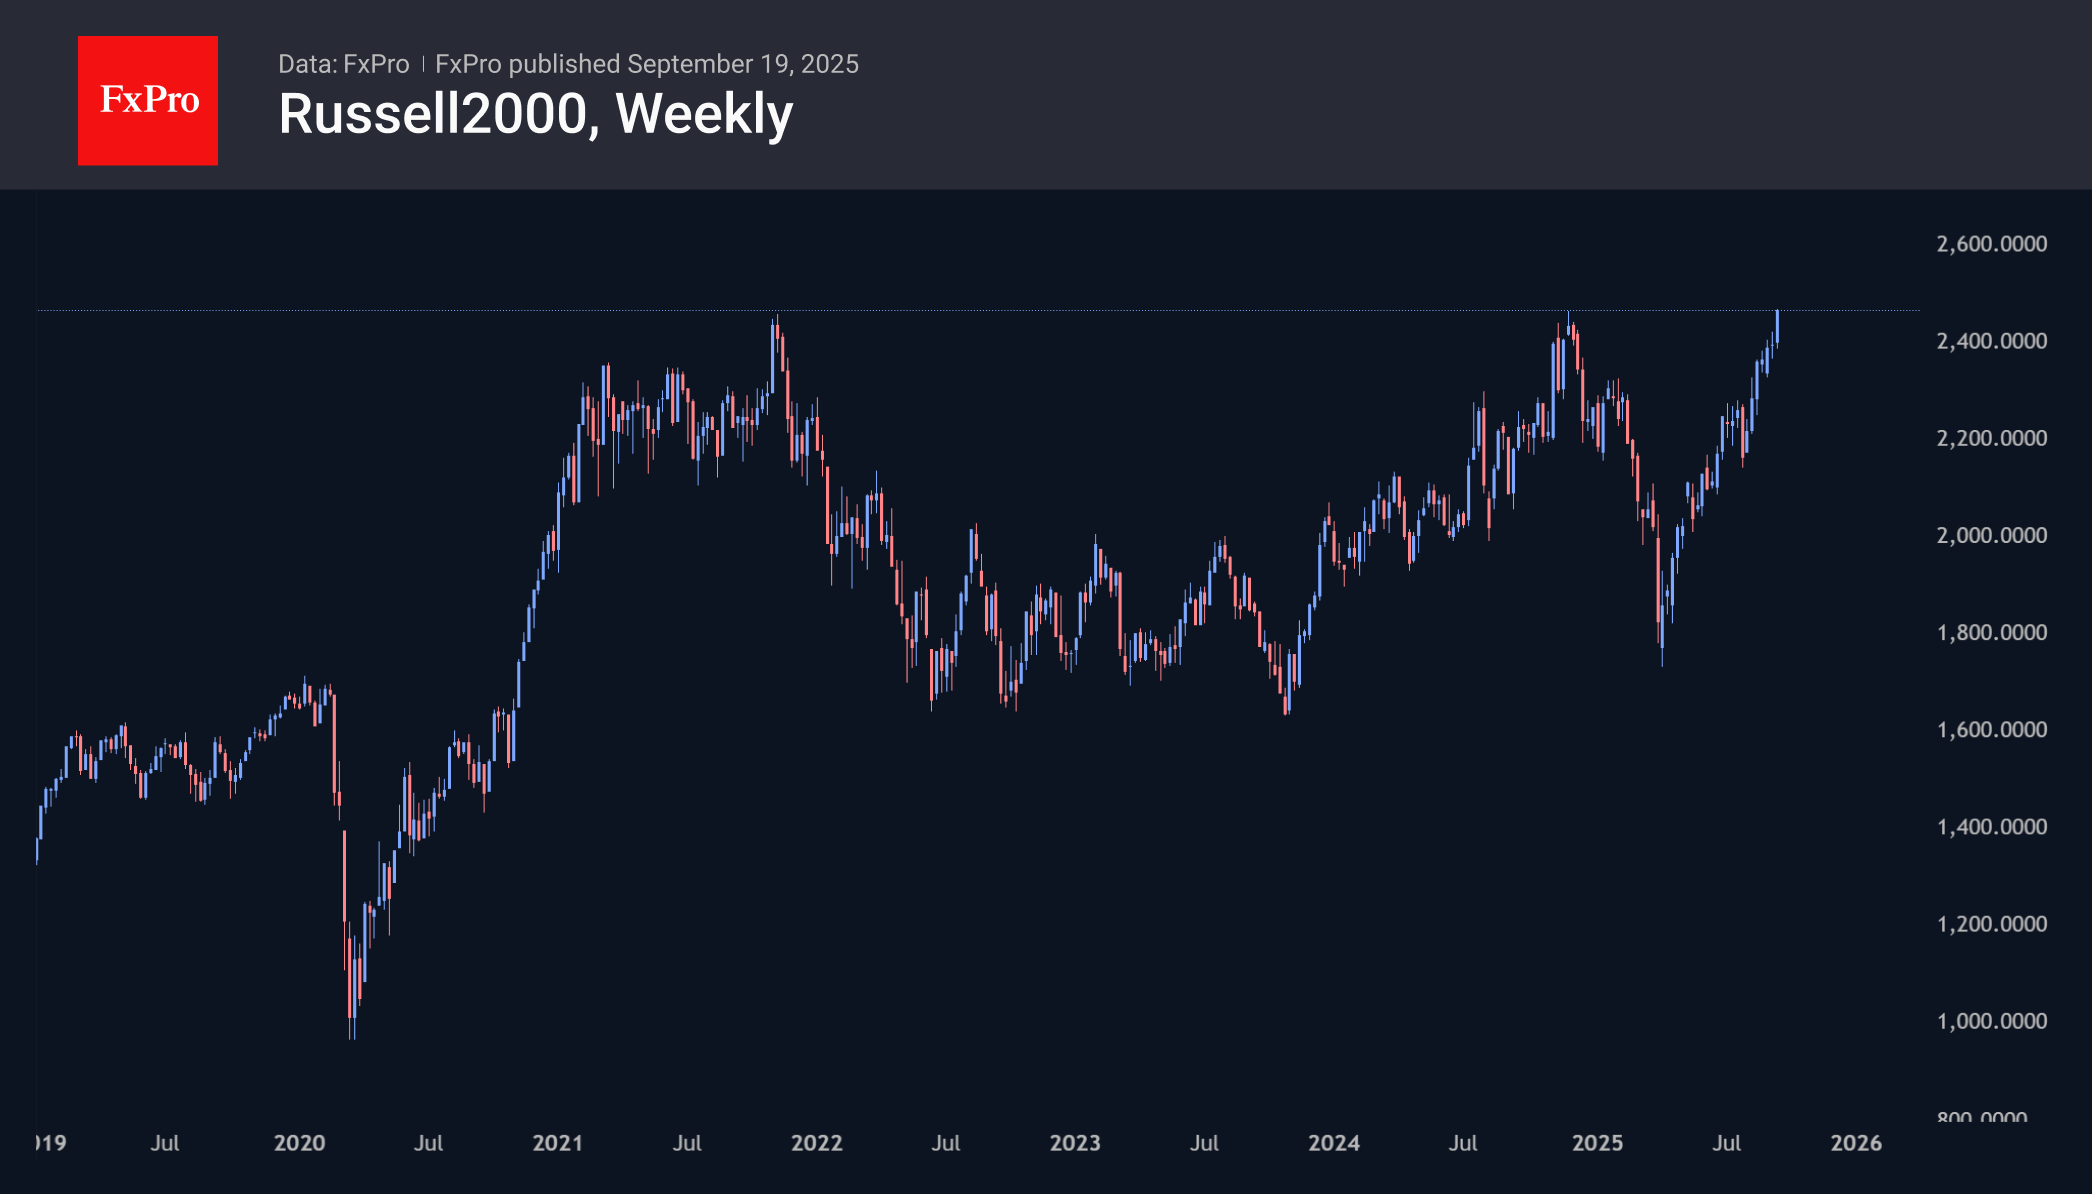
For the first time since November last year, the Russell 2000, an index of small-cap companies, has broken its historical record. It has borne the brunt of trade isolationism combined with the Fed’s restrictive monetary policy. The current peak is 0.3% above the highs of November 25, which were also only 0.3% above the peak of November 8, 2021. For comparison, the S&P 500 is now up 10.6% and 41% from those dates, and the Nasdaq 100 is up 17% and 49.7%, respectively. The main question for investors now is whether the Russell 2000 is sending a new signal of a market reversal by touching these highs, or whether it will catch up with the leaders.
EUR/USD Daily Outlook
Daily Pivots: (S1) 1.1743; (P) 1.1795; (R1) 1.1841; More...
Intraday bias in EUR/USD stays neutral at this point. Further rise will remain in favor as long as 1.1741 resistance turned support holds. Above 1.1917 will resume larger up trend to 1.2 psychological level. However, firm break of 1.1741 should confirm short term topping, and turn bias back to the downside for 1.1573 support.
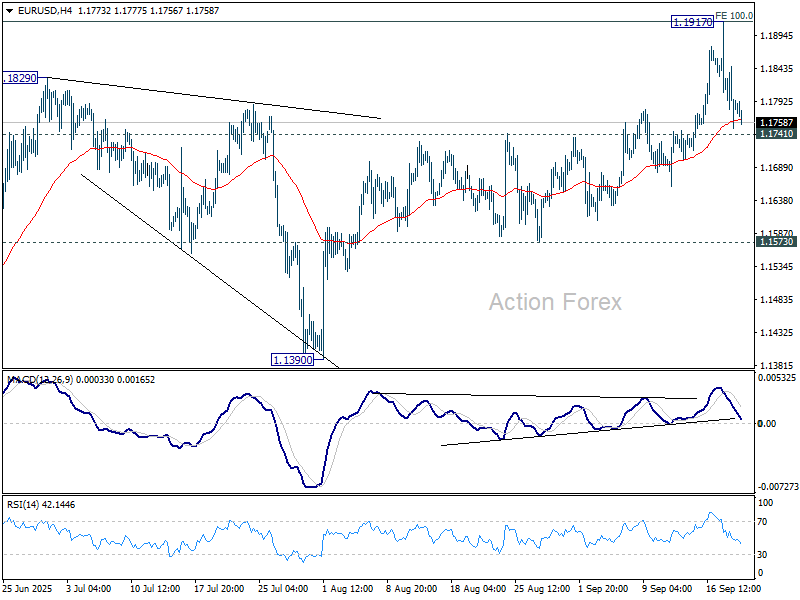
In the bigger picture, rise from 0.9534 (2022 low) long term bottom could be correcting the multi-decade downtrend or the start of a long term up trend. In either case, further rise should be seen to 100% projection of 0.9534 to 1.1274 from 1.0176 at 1.1916. Sustained break of 1.2 psychological level will carry larger bullish implications. Next target is 138.2% projection at 1.2581. This will remain the favored case as long as 55 W EMA (now at 1.1215) holds.
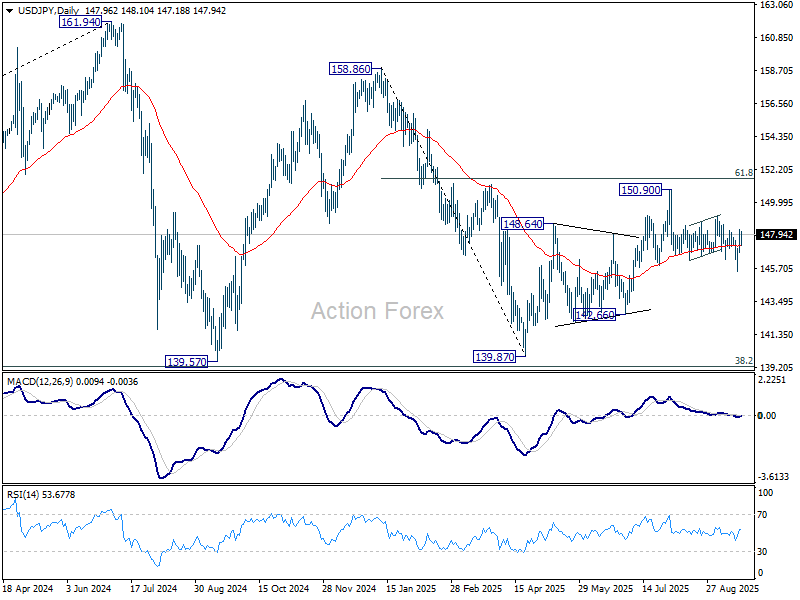
USD/JPY Daily Outlook
Daily Pivots: (S1) 147.09; (P) 147.68; (R1) 148.59; More...
Intraday bias in USD/JPY remains neutral for the moment. On the upside, break of 149.12 resistance will suggest that pullback from 150.90 has completed as a correction, and rise from 139.87 is still in progress. Further rise should then be seen back to retest 150.90 next. On the downside, below 145.47 will resume the fall to 142.66 support next.
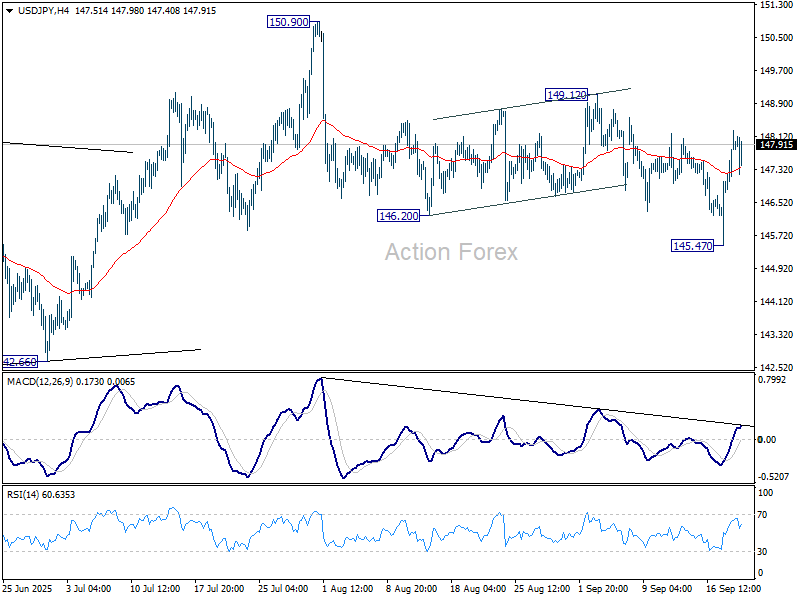
In the bigger picture, price actions from 161.94 (2024 high) are seen as a corrective pattern to rise from 102.58 (2021 low). Decisive break of 61.8% retracement of 158.86 to 139.87 at 151.22 will argue that it has already completed with three waves at 139.87. Larger up trend might then be ready to resume through 161.94 high. In case the corrective pattern extends with another fall, strong support is expected from 38.2% retracement of 102.58 to 161.94 at 139.26 to bring rebound.