
Sample Category Title
Fed’s Bostic sees only one rate cut in 2025, as uncertainty unlikely to resolve quickly
Atlanta Fed President Raphael Bostic reiterated his expectation for just one interest rate cut this year, citing persistent uncertainty surrounding global trade policy "is unlikely to resolve itself quickly.”
Speaking on Bloomberg’s Odd Lots podcast, Bostic pointed to the 90-day delay of reciprocal tariffs and the tentative nature of the recent US-China de-escalation, warning that the final outcomes of trade negotiations remain unclear.
Bostic emphasized that tariffs are expected to exert upward pressure on inflation, a view supported by the Atlanta Fed’s own analysis and echoed by many economists.
As a result, monetary policy may need to lean against those inflationary forces, limiting how far the Fed can ease. “Our policy is going to have to anticipate — and to some extent — potentially push against those inflationary forces,” he said.
Japan’s GDP Declines, Yen Rally Stalls
The Japanese yen is steady on Friday, after gaining 2% over the past three days. In the European session, USD/JPY is trading at 145.52, down 0.09% on the day.
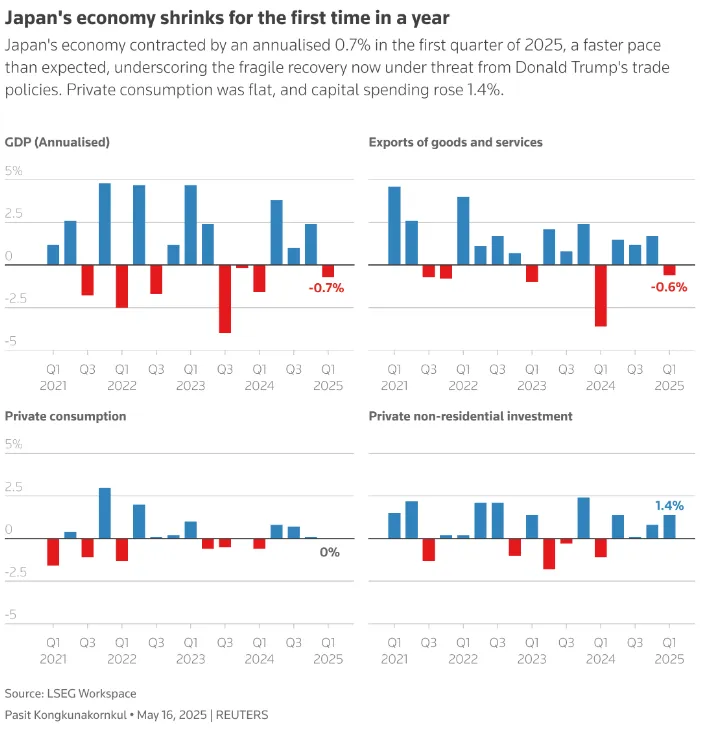
Japan's economy shrinks for first time in a year
Japan's GDP report was a major disappointment, as the economy contracted for the first time in a year. The economy declined by 0.7% in the first quarter, a sharp reversal from the upwardly revised 2.4% gain in Q4 2024. This was below the -0.2% market estimate. Quarterly, GDP declined 0.2%, down from 0.6% in the fourth quarter and weaker than the market estimate of -0.1%.
The weak GDP report preceded the US tariffs which took effect in April. The tariffs will be felt in the second quarter and will likely dampen growth. Japan's export sector is under pressure due to escalating trade tensions and domestic consumption has been weak. This had led to calls from some lawmakers to increase fiscal spending to cushion the expected blow from the the tariffs.
The Bank of Japan can't be pleased with the soft GDP numbers. The Bank is looking for stronger consumption and higher wage growth before it raises interest rates. The uncertainty over Trump's trade policy has forced the BoJ into a wait-and-see stance, hoping that US tariff policy will become more clear in the following months.
The US releases UoM consumer sentiment and inflation expectations for May later today. Consumer sentiment is expected to improve to 53.4 from an upwardly revised 52.2. Inflation expectations surged in April to 6.5% from 4.7% and are projected to rise to 6.6%, as consumers remain anxious about inflation.
USD/JPY Technical
- USD/JPY is testing support at 145.51. Below, there is support at 145.22
- 145.72 and 146.01 are the next resistance lines
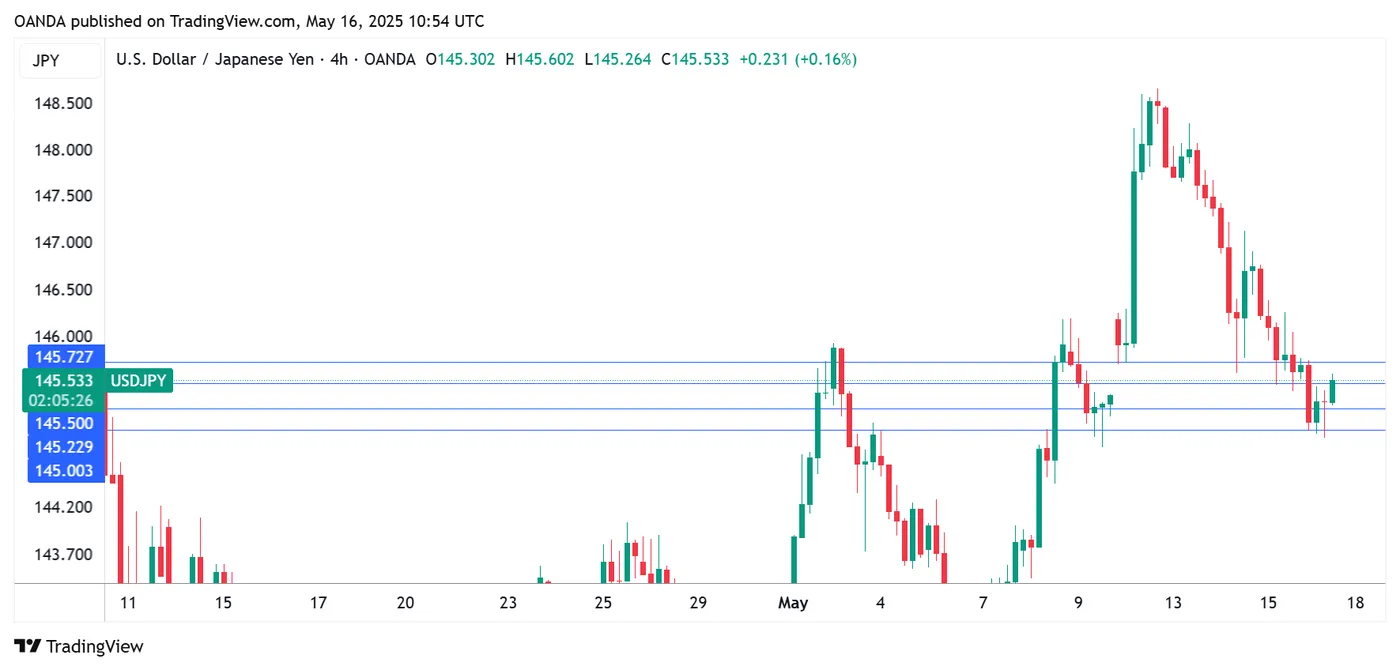
USDJPY 1-Day Chart, May 16, 2025
New Zealand Dollar Jumps as Inflation Expectations Hits 1-Year High
The New Zealand dollar is in positive territory on Friday. In the European session, NZD/USD is trading at 0.5906, up 0.54% on the day.
New Zealand inflation expectations rise
New Zealand's two-year inflation expectations climbed to 2.29% in the second quarter, up from 2.06% in Q1, its highest level since last May. The survey also predicted that one-year inflation expectations would rise to 2.41% in Q2, up from 2.15% in the first quarter, also the highest since last May.
The rise in inflation expectations can be viewed as a "Trump bump" as consumers are concerned that US tariffs will lead to higher inflation. For the Reserve Bank of New Zealand, the increase is a reminder of the upside risks for inflation, but at the same time inflation and inflation expectations are within the Reserve Bank's target range of 1%-3%.
Will RBNZ cut in May?
With inflation largely contained, the RBNZ is looking to continue lowering interest rates in order to boost the economy. The RBNZ cut rates last month to 3.5% from 3.75% and is expected to cut rates again at the May 28 meeting.
The problem for Bank policymakers is the uncertainty over President Trump's erratic trade policy, which has made it tricky to make growth and inflation forecasts. The US and China engaged in a tit-for-tat tariff war which resulted in massive tariffs, only to suddenly reach a temporary agreement to slash tariffs. Will this lead to a permanent agreement or will the US and China resume their damaging trade war? It's unclear what happens next, especially given the unpredictability of Donald Trump.
The US wraps up the week with UoM consumer sentiment and inflation expectations for May. Consumer sentiment is expected to improve to 53.4 from an upwardly revised 52.2. Inflation expectations surged in April to 6.5% from 4.7% and are projected to rise to 6.6%, as consumers remain anxious about inflation.
NZD/USD Technical
- NZD/USD has pushed above resistance at 0.58 an85d is testing resistance at 0.5909 Above, there is resistance at 0.5940
- 0.5854 and 0.5830 are the next support levels
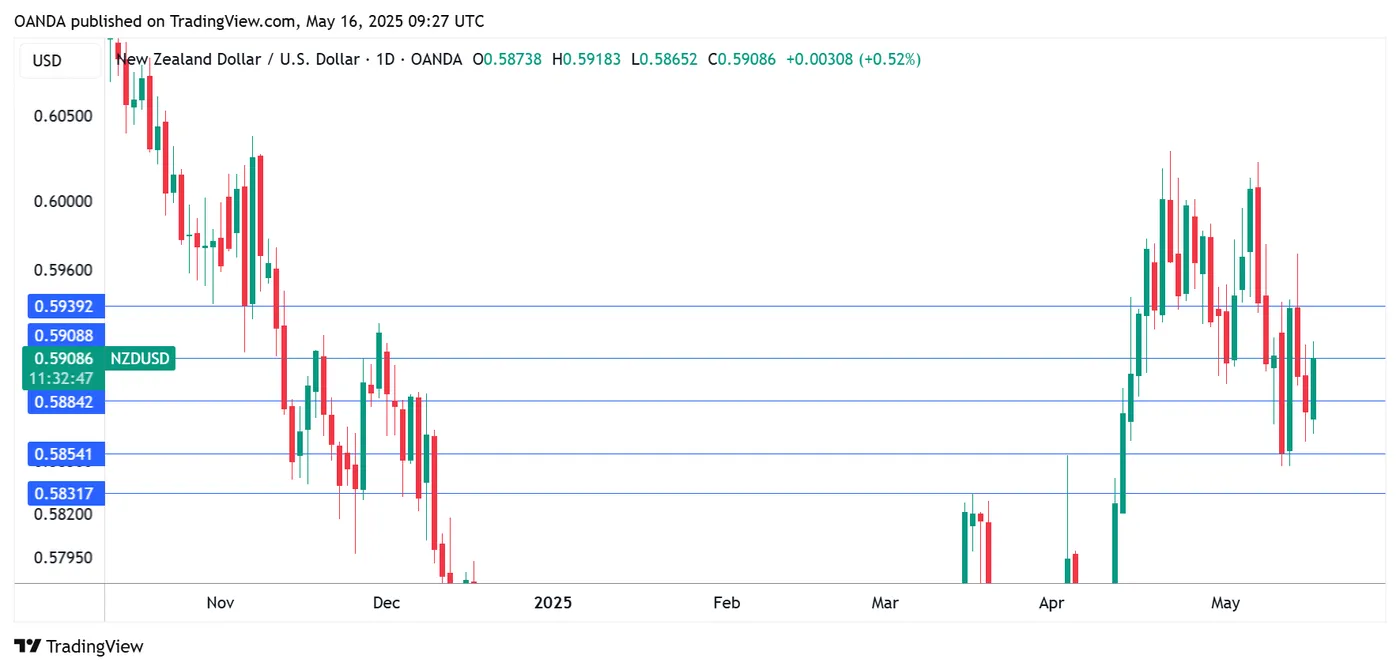
NZDUSD 1-Day Chart, May 16, 2025
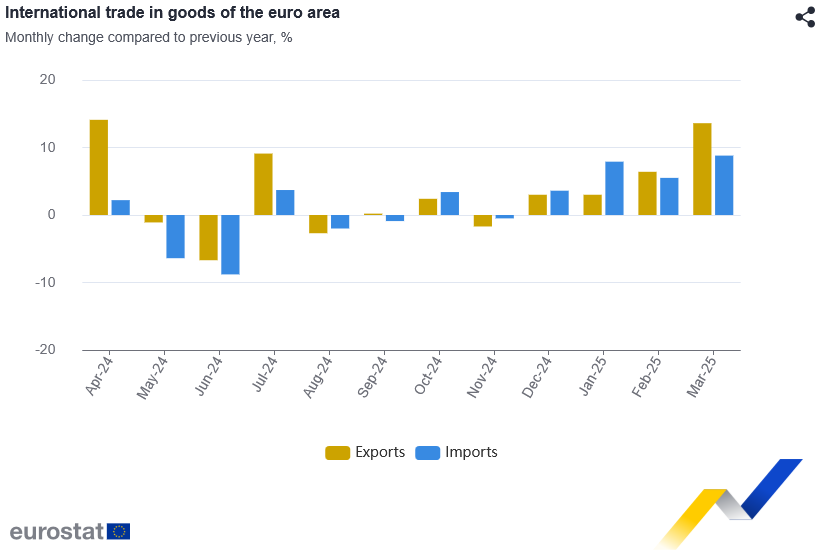
EU exports jump 15.% yoy in March on strong US shipments
Eurozone trade data showed a strong performance in March, with exports rising 13.7% yoy to EUR 279.8B and imports up 8.8% yoy to EUR 243.0B, resulting in a solid trade surplus of EUR 36.8B. Intra-eurozone trade also rose 1.7% yoy to EUR 226.0B, indicating modest growth in internal demand.
For the broader European Union, the trade picture was similarly positive. Exports jumped 15.2% yoy to EUR 254.8B, while imports increased by 10.4% yoy to EUR 219.5B, yielding a EUR 35.3B surplus.
The standout development came from transatlantic trade: EU exports to the United States surged 59.5% yoy to EUR 71.4B, far outpacing the 15.8% yoy rise in imports from the U.S.
Meanwhile, trade with the UK also showed moderate growth, with exports rising 4.8% yoy and imports increasing 5.4% yoy. In contrast, trade with China as a weak spot. EU exports to China fell sharply by -10.1% yoy to EUR 17.9B, while imports surged 15.8% yoy to EUR 48.6B.
USD/JPY Forecast: Yen Strength Revival Below 149.00 Resistance
Key takeaways
- USD/JPY rebounded sharply from 140.00 to 148.65 but quickly reversed, showing signs of a failed bullish breakout amid profit-taking and technical resistance.
- The Bank of Japan held rates steady and cut its growth forecast, reinforcing expectations of a slower pace of policy normalization in 2025.
- US-Japan 10Y and 2Y yield spreads continue to narrow, putting downside pressure on USD/JPY and signalling weakening dollar-yen fundamentals.
- Bearish momentum resurfaced in USD/JPY, but a break above 149.00 would invalidate the bearish scenario and open the door to 151.30–154.50.
Since our last publication, the USD/JPY has staged an initial push down to test the first medium-term support zone of 140.30/140.00, as highlighted (it printed an intraday low of 139.89 on 22 April).
Before the expected relief US dollar bounce took shape, the USD/JPY rallied by 4.4% to hit an intraday high of 145.93 on 2 May. A US dollar setback occurred, causing it to slide towards an intraday low of 142.35 on 6 May.
A pause in JPY strength due to BoJ and risk-on sentiment
The initial two weeks of US dollar strength against the Japanese yen have been reinforced by the recently concluded Bank of Japan (BoJ) monetary policy decision meeting last Thursday, 1 May. The BoJ switched into a “dovish hold” stance by keeping its short-term policy interest rate unchanged at 0.5% but slashed its current fiscal year growth forecast to 0.5% from 1.1%, citing trade tariff uncertainty.
However, the Japanese yen's strength against the US dollar was short-lived as the USD/JPY managed to propel higher by 4.4% to hit a high of 148.65 on Monday, 12 May, triggered by a renewed bout of risk-on sentiment over the growing optimism of US-China trade tensions de-escalation.
BoJ’s normalisation monetary policy is likely to be less hawkish
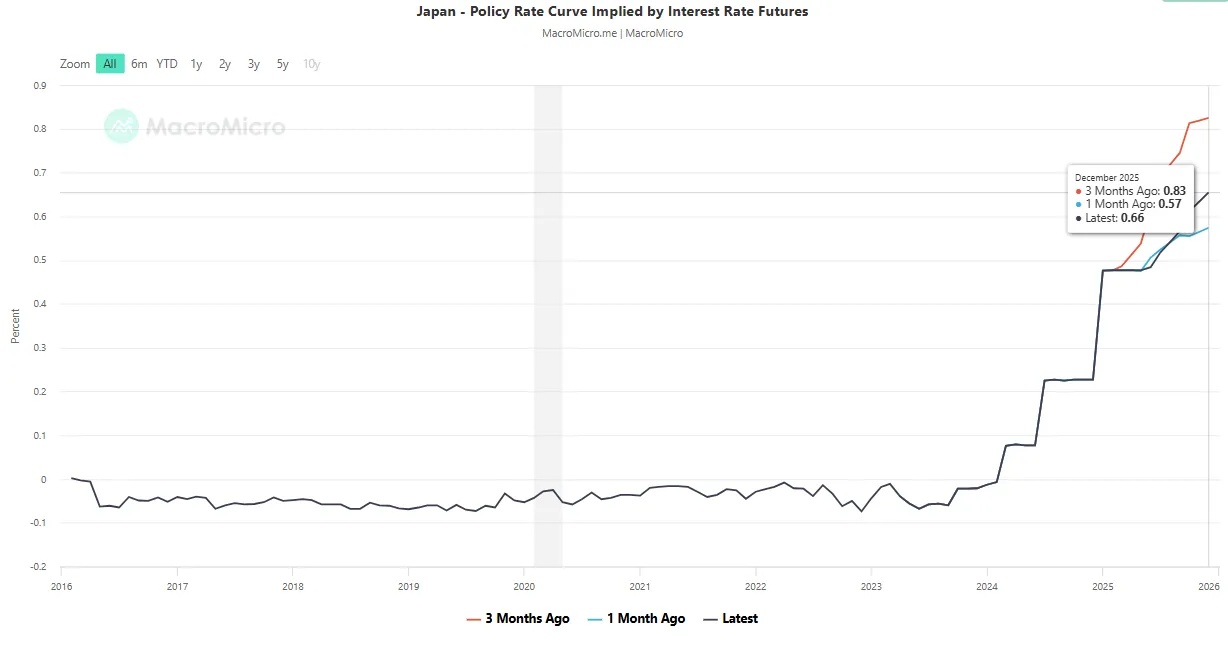
Fig 1: Japan implied forward short-term interest rate curve as of 15 May 2025 (Source: Macro Micro)
Market expectations for Bank of Japan rate hikes in 2025 have softened compared to three months ago. The forward-implied short-term policy rate, derived from interest rate futures, has shifted lower, now projected at 0.66% by December 2025, down from 0.83% previously. However, this remains slightly above the 0.57% level seen just a month ago (see Fig 1).
However, other factors can support a potential resurgence of Japanese yen strength.
US Treasuries-JGBs yield spreads remain below key resistances
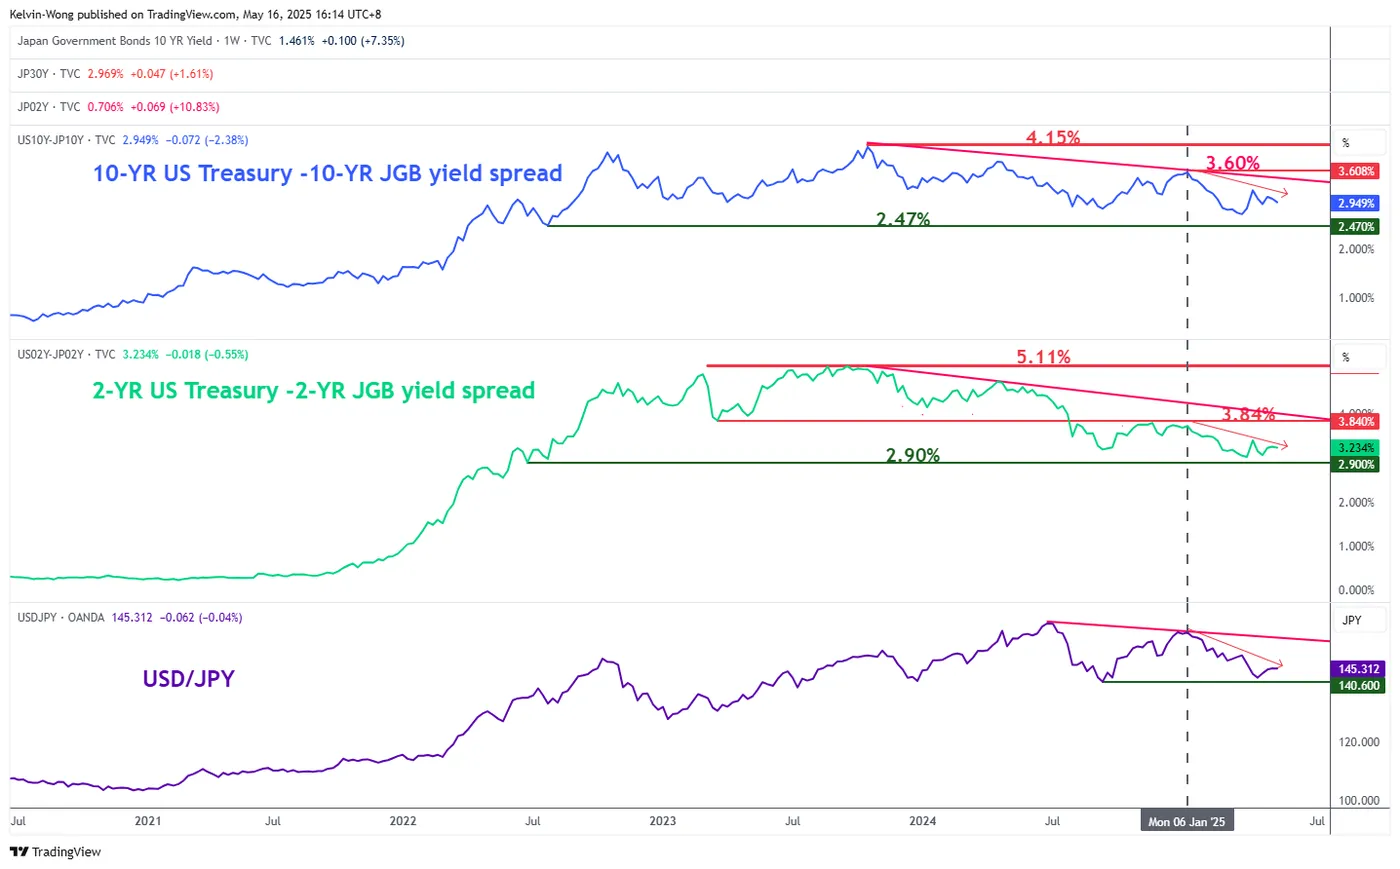
Fig 2: 10-YR & 2-YR yield spreads of US Treasuries/JGBs medium-term trends as of 16 May 2025 (Source: TradingView)
Since 6 January 2025, the 10-year and 2-year yield spreads of the US Treasury notes over Japanese Government Bonds (JGBs) have continued to narrow (trended downwards) below their respective key medium-term pivotal resistances of 3.60% and 3.84%, respectively.
If their downward trajectory remains intact, the 10-year and 2-year yield spreads of the US Treasury notes over JGBs may see further downside towards 2.47% and 2.90% next, which in turn may trigger further downside pressure on the USD/JPY (see Fig 2).
A failure bullish breakout in the USD/JPY technical chart
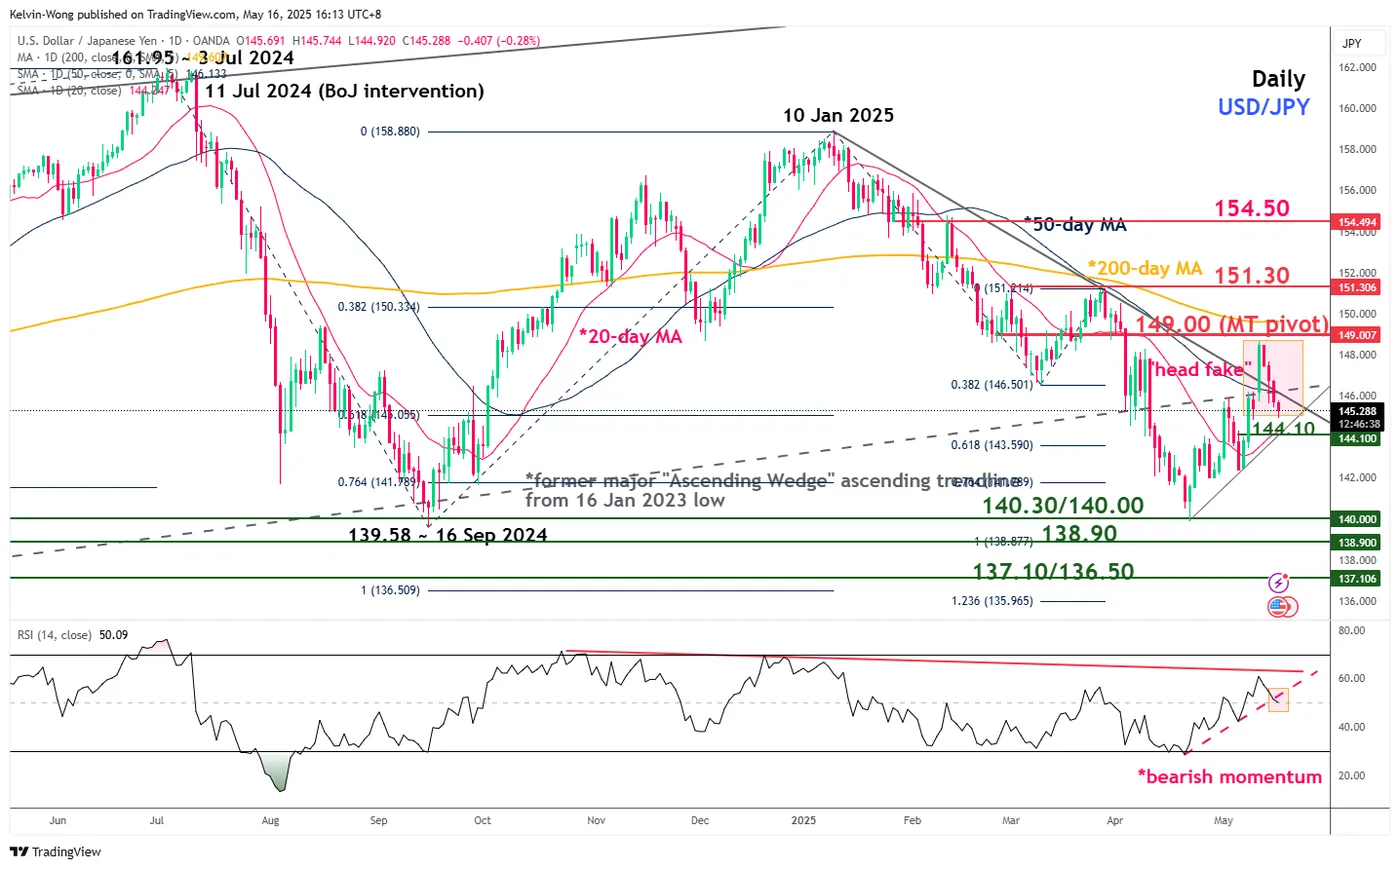
Fig 3: USD/JPY medium-term trend as of 16 May 2025 (Source: TradingView)
The USD/JPY’s swift intraday rally of 2.1% seen on Monday, 16 May, is the best single-day gain of the USD/JPY since 17 June 2022.
Interestingly, the bullish momentum of the US dollar's strength was short-lived, and the USD/JPY staged a decline of -2.5% to print an intraday low of 144.92 on Friday, 16 May at the time of writing, which wiped out its initial gains (see Fig 3).
In addition, the price actions of the USD/JPY have reintegrated back below its 50-day moving average and the medium-term descending trendline from its 10 January 2025 swing high, coupled with a bearish momentum condition being flashed out on its daily RSI momentum indicator.
Hence, the rally of 16 May is likely considered a “head fake” failure bullish breakout. Watch the 149.00 key medium-term pivotal resistance (also the key 200-day moving average), and a break below the 144.10 key intermediate support may see further weakness on the USD/JPY to retest 140.30/140.00 medium-term support in the first step before exposing the next medium-term supports at 138.90 and 137.10/136.50.
On the other hand, a clearance above 149.00 invalidates the bearish scenario for a recovery towards the next medium-term resistances at 151.30 and 154.50.
EUR/USD Unchanged Amid Mixed News and Lingering Risks
The EUR/USD pair remained steady near 1.1196 on Friday, closing the week with little movement.
Key drivers influencing EUR/USD
Earlier in the week, the US dollar strengthened as the US-China trade dispute showed signs of easing. However, this optimism was short-lived due to disappointing economic data.
The greenback initially rose by around 1% after Washington and Beijing agreed to reduce tariffs temporarily for 90 days, fuelling hopes of progress toward a broader trade deal. Yet, weak US economic indicators soon dampened sentiment:
- The April producer price index (PPI) fell to 2.4% year-on-year, down from 3.4% and below the forecast of 2.5%
- Month-on-month PPI dropped 0.5%, against expectations of no change
- US retail sales growth slowed sharply to 0.1% in March, following February’s 1.7% surge
- Industrial production stagnated in March after a 0.3% decline in February
These concerning figures have led traders to price in additional Fed rate cuts for 2025.
Technical analysis: EUR/USD
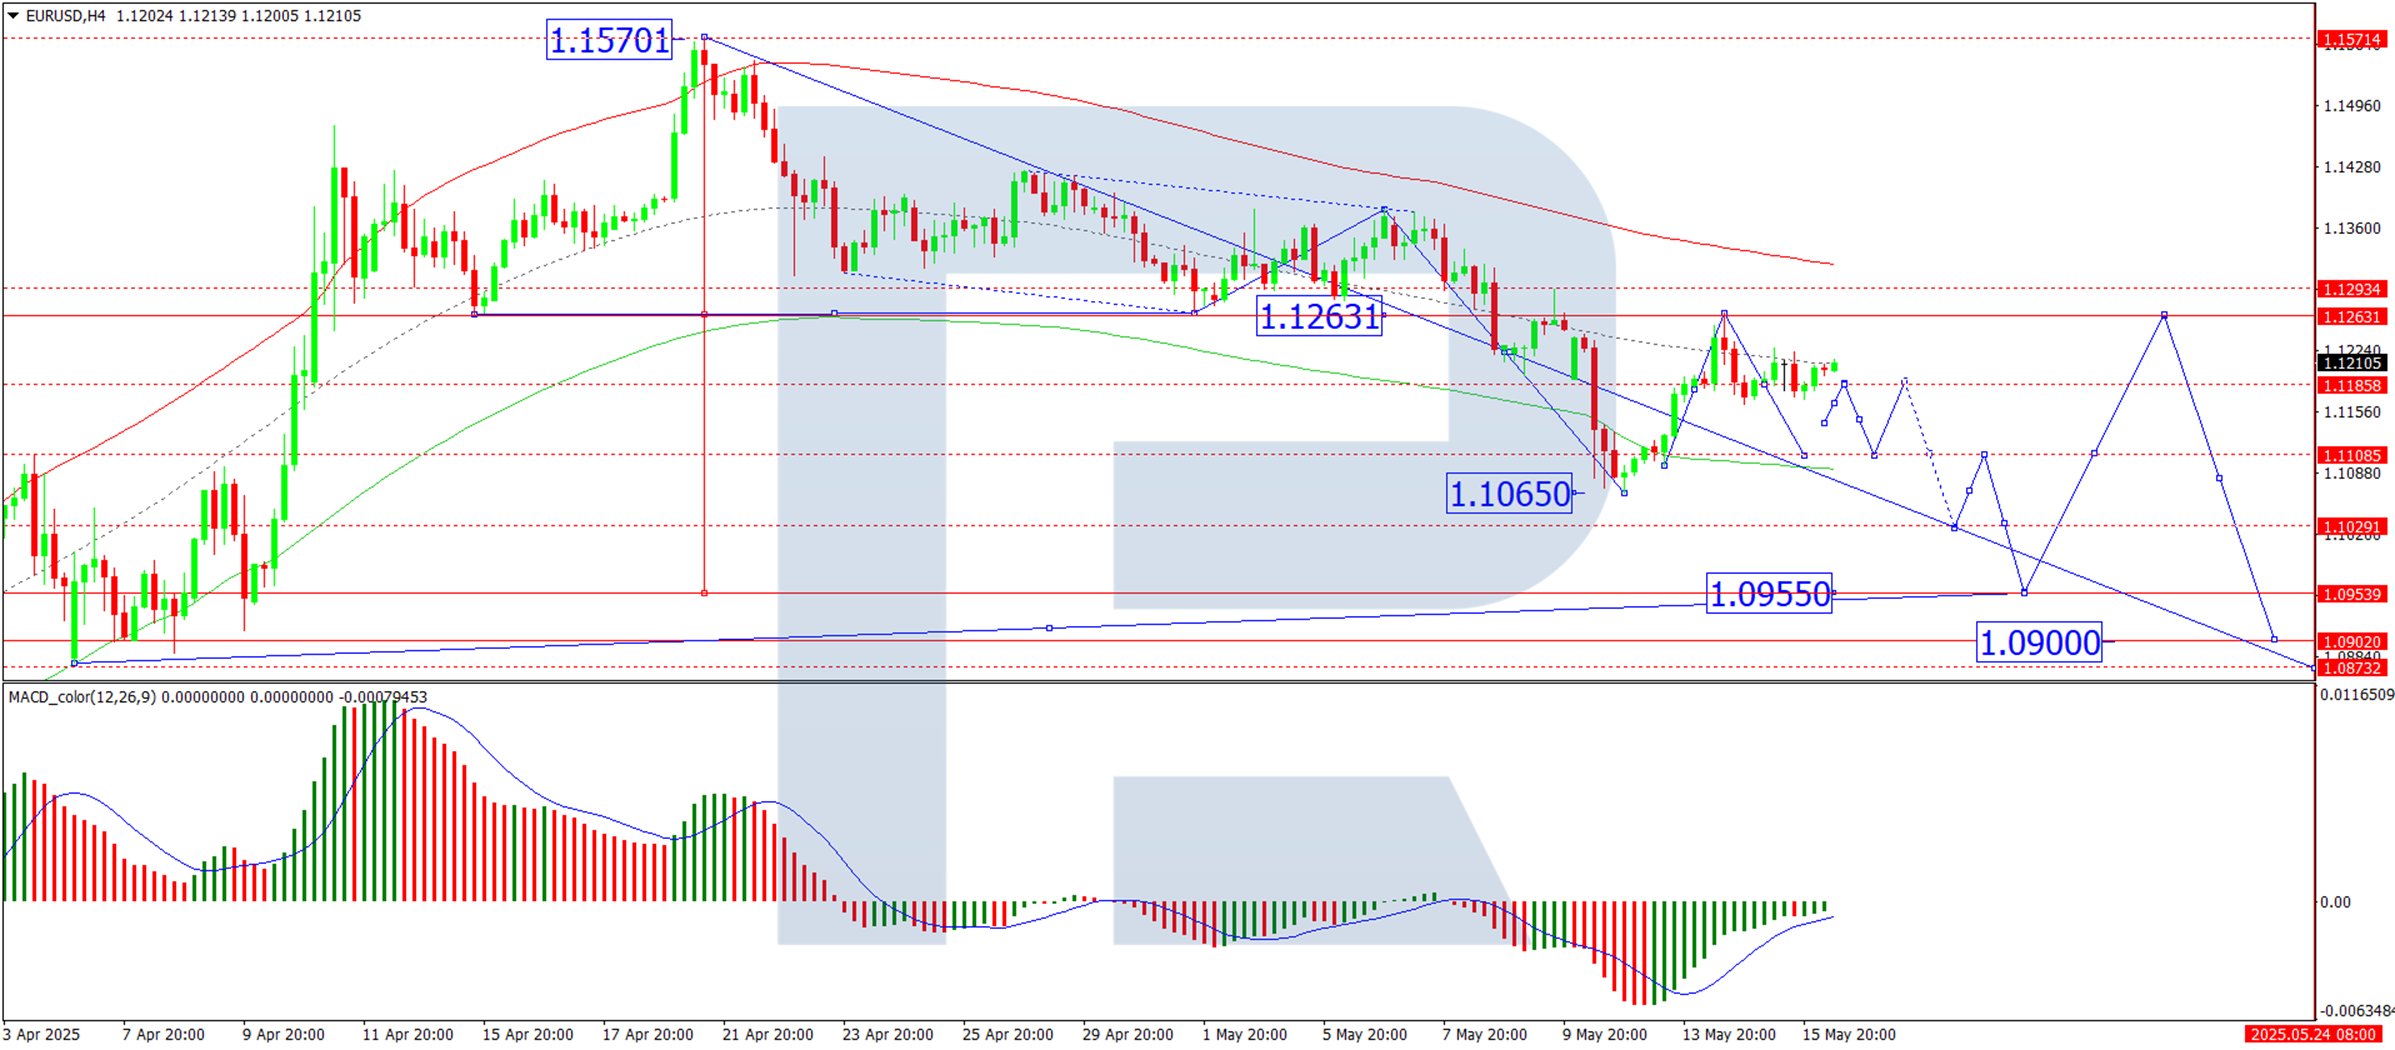
H4 Chart:
The EUR/USD continues to consolidate around 1.1173. A temporary rise to 1.1276 (testing resistance from below) remains possible, but this uptick is considered a corrective phase within the broader downtrend. Once complete, the pair may resume its decline toward 1.0950, this being the first key support level. The MACD indicator confirms this outlook, with its signal line below zero and pointing downward.
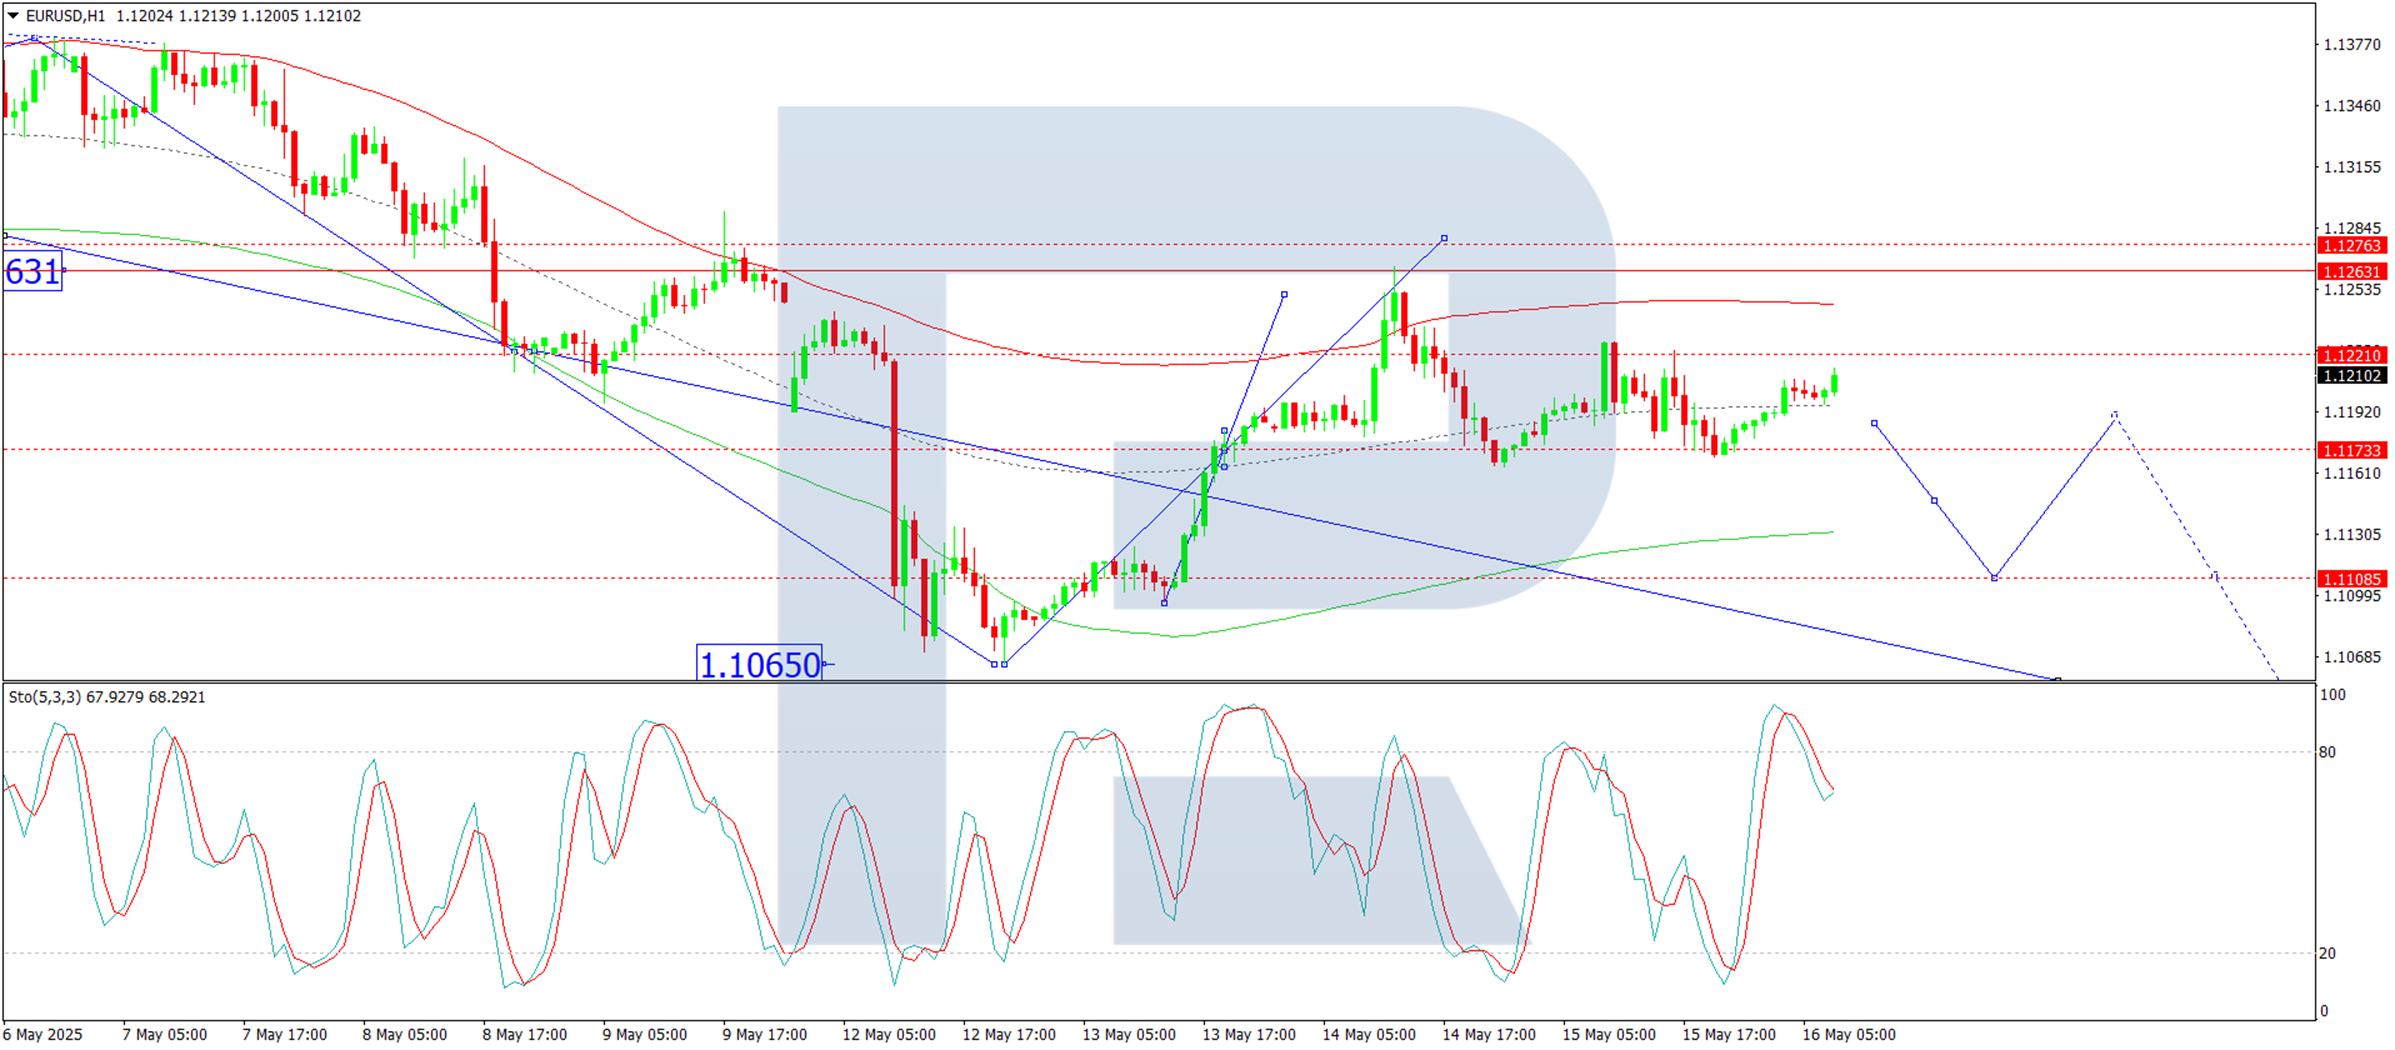
H1 Chart:
The pair has already met a local bullish target at 1.12653, followed by a pullback to 1.1170. Today, another test of 1.1276 is plausible, but the broader expectation remains bearish, with a potential drop towards 1.1100. This scenario is reinforced by the Stochastic oscillator, whose signal line is above 80, suggesting an imminent downward reversal towards 20.
Conclusion
The EUR/USD remains range-bound amid mixed fundamentals and technical signals. While a short-term rebound is possible, the dominant downtrend is expected to prevail, with key support levels at 1.0950 (H4) and 1.1100 (H1). Traders should monitor Fed policy expectations and upcoming economic data for further direction.
ETH/USD Rate Rises by Over 40% Since the Start of May
On 7 May, a major upgrade to the Ethereum network — known as Pectra — was successfully implemented. It significantly enhanced the network’s scalability and efficiency, while also improving conditions for ETH stakers.
This triggered a surge in demand for Ethereum, and the ETH/USD rate rose confidently from the $1,800 area to current levels around $2,600.
Can the Ethereum price continue to rise?
Technical Analysis of the ETH/USD Chart
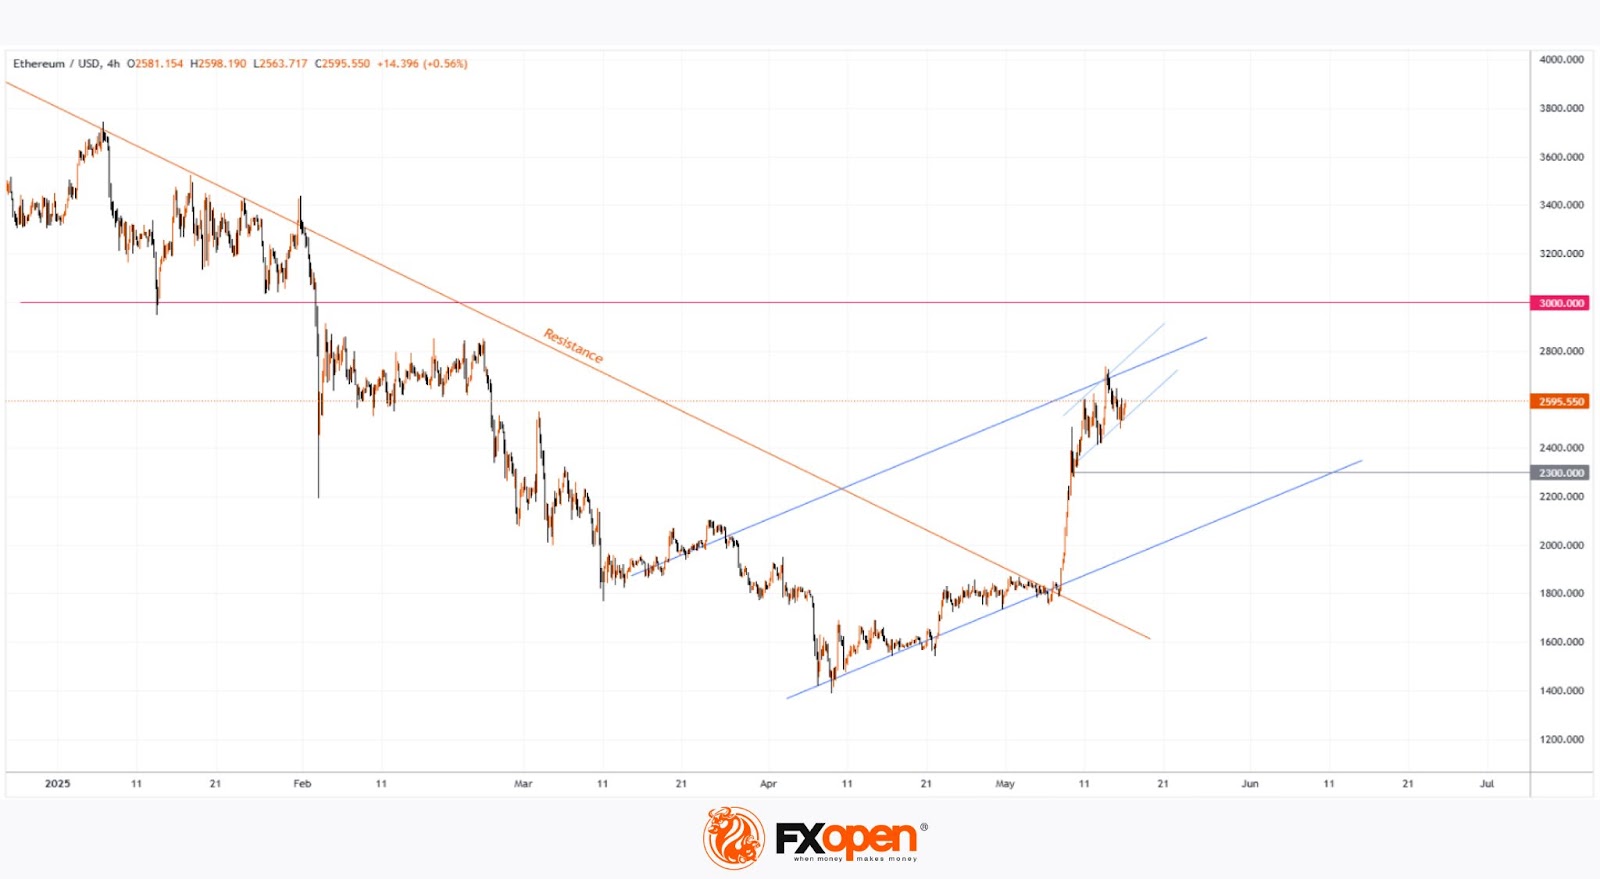
The bearish trendline acting as resistance — which originated at the end of 2024 — was largely driven by increasing competition, for instance from Solana (SOL) and Cardano (ADA). However, the Pectra upgrade has made Ethereum more competitive, resulting in a bullish breakout above the trendline.
On the one hand, recent ETH price movements provide a basis for outlining an upward channel (shown in blue), with the price now approaching the upper boundary, which may act as resistance. This could encourage bulls to take profits, potentially setting the stage for a pullback after the sharp rally.
On the other hand, the rise from $1,800 to $2,300 appears almost uninterrupted. From the perspective of the Smart Money Concept methodology, this area could be seen as a significant bullish Fair Value Gap, where strong demand outweighed supply — suggesting that it may act as support in the event of a pullback.
Given the major improvements to the Ethereum blockchain, it is reasonable to assume that:
- any pullbacks are likely to be shallow;
- demand appears strong enough to support the continued movement of the ETH/USD price within the emerging upward channel.
FXOpen offers the world's most popular cryptocurrency CFDs*, including Bitcoin and Ethereum. Floating spreads, 1:2 leverage — at your service. Open your trading account now or learn more about crypto CFD trading with FXOpen.
*Important: At FXOpen UK, Cryptocurrency trading via CFDs is only available to our Professional clients. They are not available for trading by Retail clients. To find out more information about how this may affect you, please get in touch with our team.
This article represents the opinion of the Companies operating under the FXOpen brand only. It is not to be construed as an offer, solicitation, or recommendation with respect to products and services provided by the Companies operating under the FXOpen brand, nor is it to be considered financial advice.
Japan and US Data Hit Sentiment, DAX Eyes 24000
Asian Session Market Wrap
A mixed Asian session for stocks as US Futures struggled after the S&P 500 finished with gains of 0.4% on Thursday. It appears early week optimism around the US-China trade deal may be fading. Will potential trade deal announcements reignite risk appetite?
For now though, it appears concerns continue to linger with yesterday's US data not doing much to allay fears that a global slowdown may still be in offing. The picture around consumers and small businesses remains one of concern.
The NFIB Small Business Optimism Index declined 1.6 points in April, to 95.8, its lowest since October 2024. 6 of the 10 index components decreased, with expected business conditions having the most negative contribution.Over the last 4 months, the index has fallen 9.3 points, the sharpest drop since the 2020 pandemic.
At the same time, the share of small firms expecting better business conditions 6 months from now has plummeted 37 percentage points, to 15%, the lowest since October 2024.
In short, despite the US-China 90 day pause, businesses are getting more pessimistic rather than optimistic about the US economy.
Stocks went up in Taiwan, Australia, and South Korea, while they were volatile in Japan and dropped in China. Alibaba Group shares fell as much as 6.7% in Hong Kong after quarterly revenue disappointed.
Adding to the concerns of a global slowdown, Japan's economy shrank for the first time in a year, showing its weakness even before feeling the effects of US President Donald Trump’s tariffs. Finance Minister Katsunobu Kato said he plans to meet with Scott Bessent next week to discuss currency issues he had previously talked about with the US treasury secretary.
All of the above appear to weigh on sentiment as we head into Friday's European session.
Source: LSEG
The European Open
Heading into the European open, Eurozone government bond yields fell on Friday, moving further down from the multi-week highs reached earlier this week.
The DAX continues to advance with modest gains heading into the open. The Index is up 0.2% following yesterday's gains of around 0.9%.
European shares on the whole are bracing for a subdued open though with little data or events scheduled later in the day to provide a clear catalyst.
Gold prices faltered once more, dropping 0.7% to $3,217 an ounce after jumping 2% the night before. Over the week, they’re down by 3.2%.
Oil prices leveled off after dropping over 2% overnight due to news of a possible U.S.-Iran nuclear deal. However, they’re still up 1% for the week thanks to an improved global economic outlook.
On the FX front, traders resumed selling the dollar on Friday, causing it to drop 0.3% against the Japanese yen and 0.2% against the Swiss franc. Meanwhile, the Australian dollar went up 0.4%, and the New Zealand dollar rose 0.5% on the back of rising inflation expectations.
Currency Power Balance
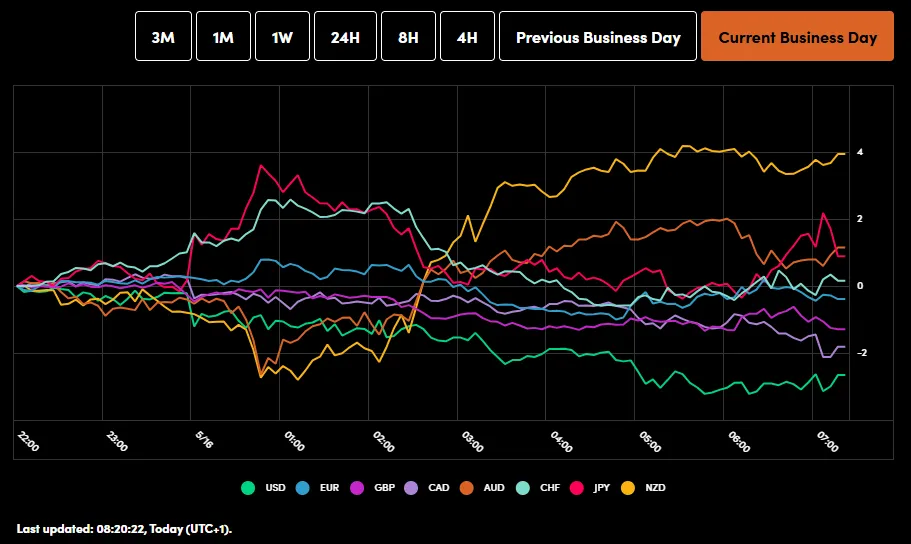
Source: OANDA Labs
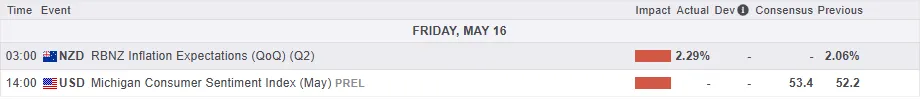
Economic Data Releases
Looking at the economic calendar, it is a quiet end to the week for European markets with a sparse calendar. The major market moving event could come in the US session by means of the US Michigan Consumer Sentiment Preliminary release.
This could provide more insight into consumer expectations moving forward and depending on the numbers could either weigh or boost sentiment ahead of the weekend.
For all market-moving economic releases and events, see the MarketPulse Economic Calendar. (click to enlarge)
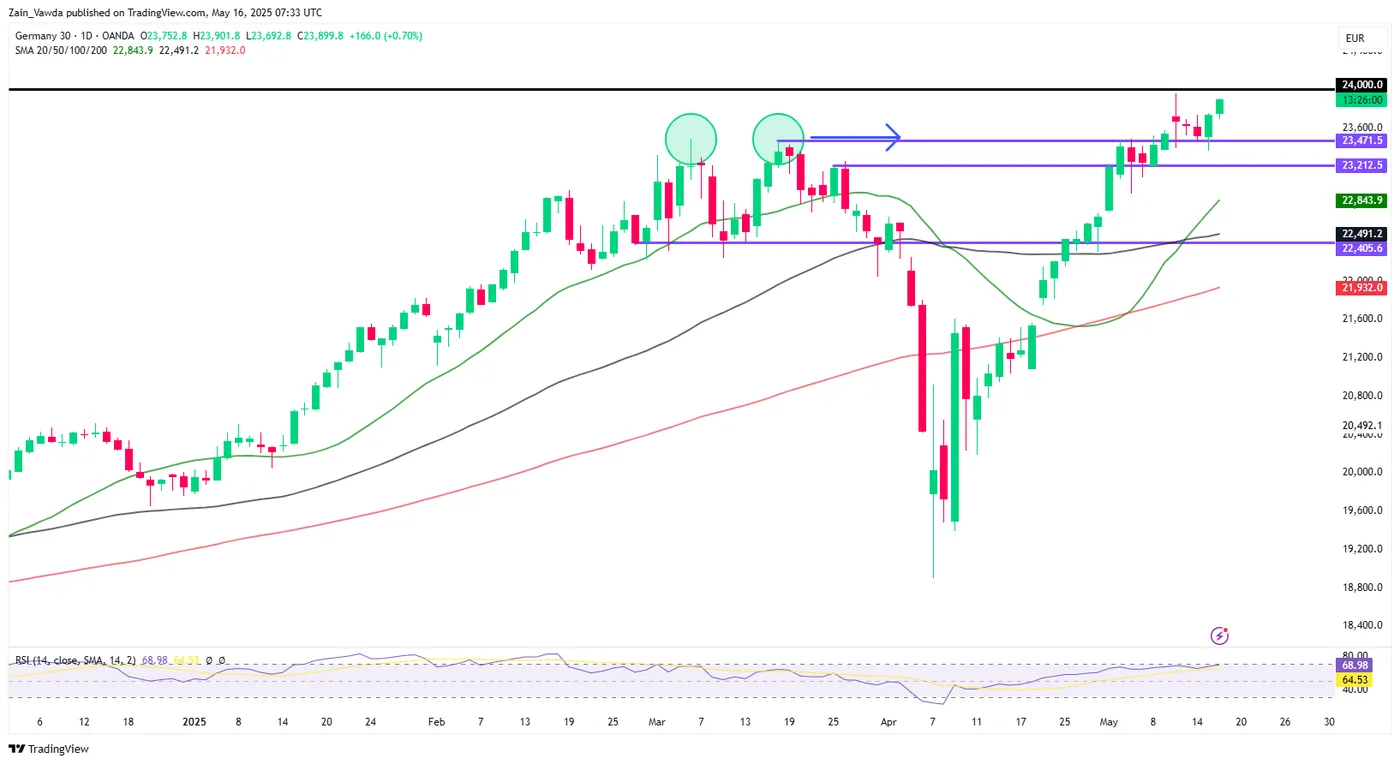
Chart of the day - DAX
From a technical standpoint, the DAX held support yesterday and closed as a hammer candlestick on the daily timeframe.
Early European session gains position the index favorably for a retest of the 24000 handle and potentially a break higher.
The fading optimism around the US-China trade pause may halt the rally and is something worth monitoring.
The only concern from a technical aspect comes from the period-14 RSI which is in overbought territory.
The Index does need a break and daily candle close beyond 24000 if bulls are to push on and print fresh all-time highs.
Definitely worth monitoring ahead of the weekend.
Immediate Resistance may be found at 24000, 24250 and potentially 24500.
Immediate support rests at 23750, 23471 and 23212 respectively.
DAX Daily Chart, May 16, 2025
Source: TradingView.com (click to enlarge)
ECB’s Kazaks: Interest rates near terminal level of easing cycle
Latvian ECB Governing Council member Martins Kazaks indicated market pricing of a 25bps cut at the June 5 meeting is “relatively appropriate”.
Nevertheless, speaking to CNBC, Kazaks added that inflation developments are "by and large within the baseline scenario". Thus, ECB is “relatively close to the terminal rate” of its easing cycle.
Kazaks' comments argue that ECB may enter a phase of pause after the June rate cut.
Meanwhile, French Governing Council member Francois Villeroy de Galhau, in an interview with a regional French newspapers, acknowledged the risk of a trade war but dismissed the notion that central banks are currently engaged in a currency war.
Villeroy defined a currency war as using interest rates competitively to gain economic advantage. Instead, he said recent currency movements are more reflective of "revisions to economic forecasts."
BoJ’s Nakamura urges caution on rate hikes as economy faces mounting downward pressure
BoJ board member Toyoaki Nakamura, known for his dovish stance, warned that Japan’s economy is under “mounting downward pressure” and cautioned against "rushing" to interest rate hikes.
Speaking today, Nakamura highlighted the risks of tightening policy while growth slows, noting that higher rates could "curb consumption and investment with a lag".
Nakamura also pointed to growing uncertainty stemming from US tariff policy, which he said is already causing Japanese firms to delay or scale back capital spending plans.
He warned that escalating trade tensions could spark a “vicious cycle of lower demand and prices,” undermining both growth and inflation.