Sample Category Title
Crypto Hovering at Altitude
Market picture
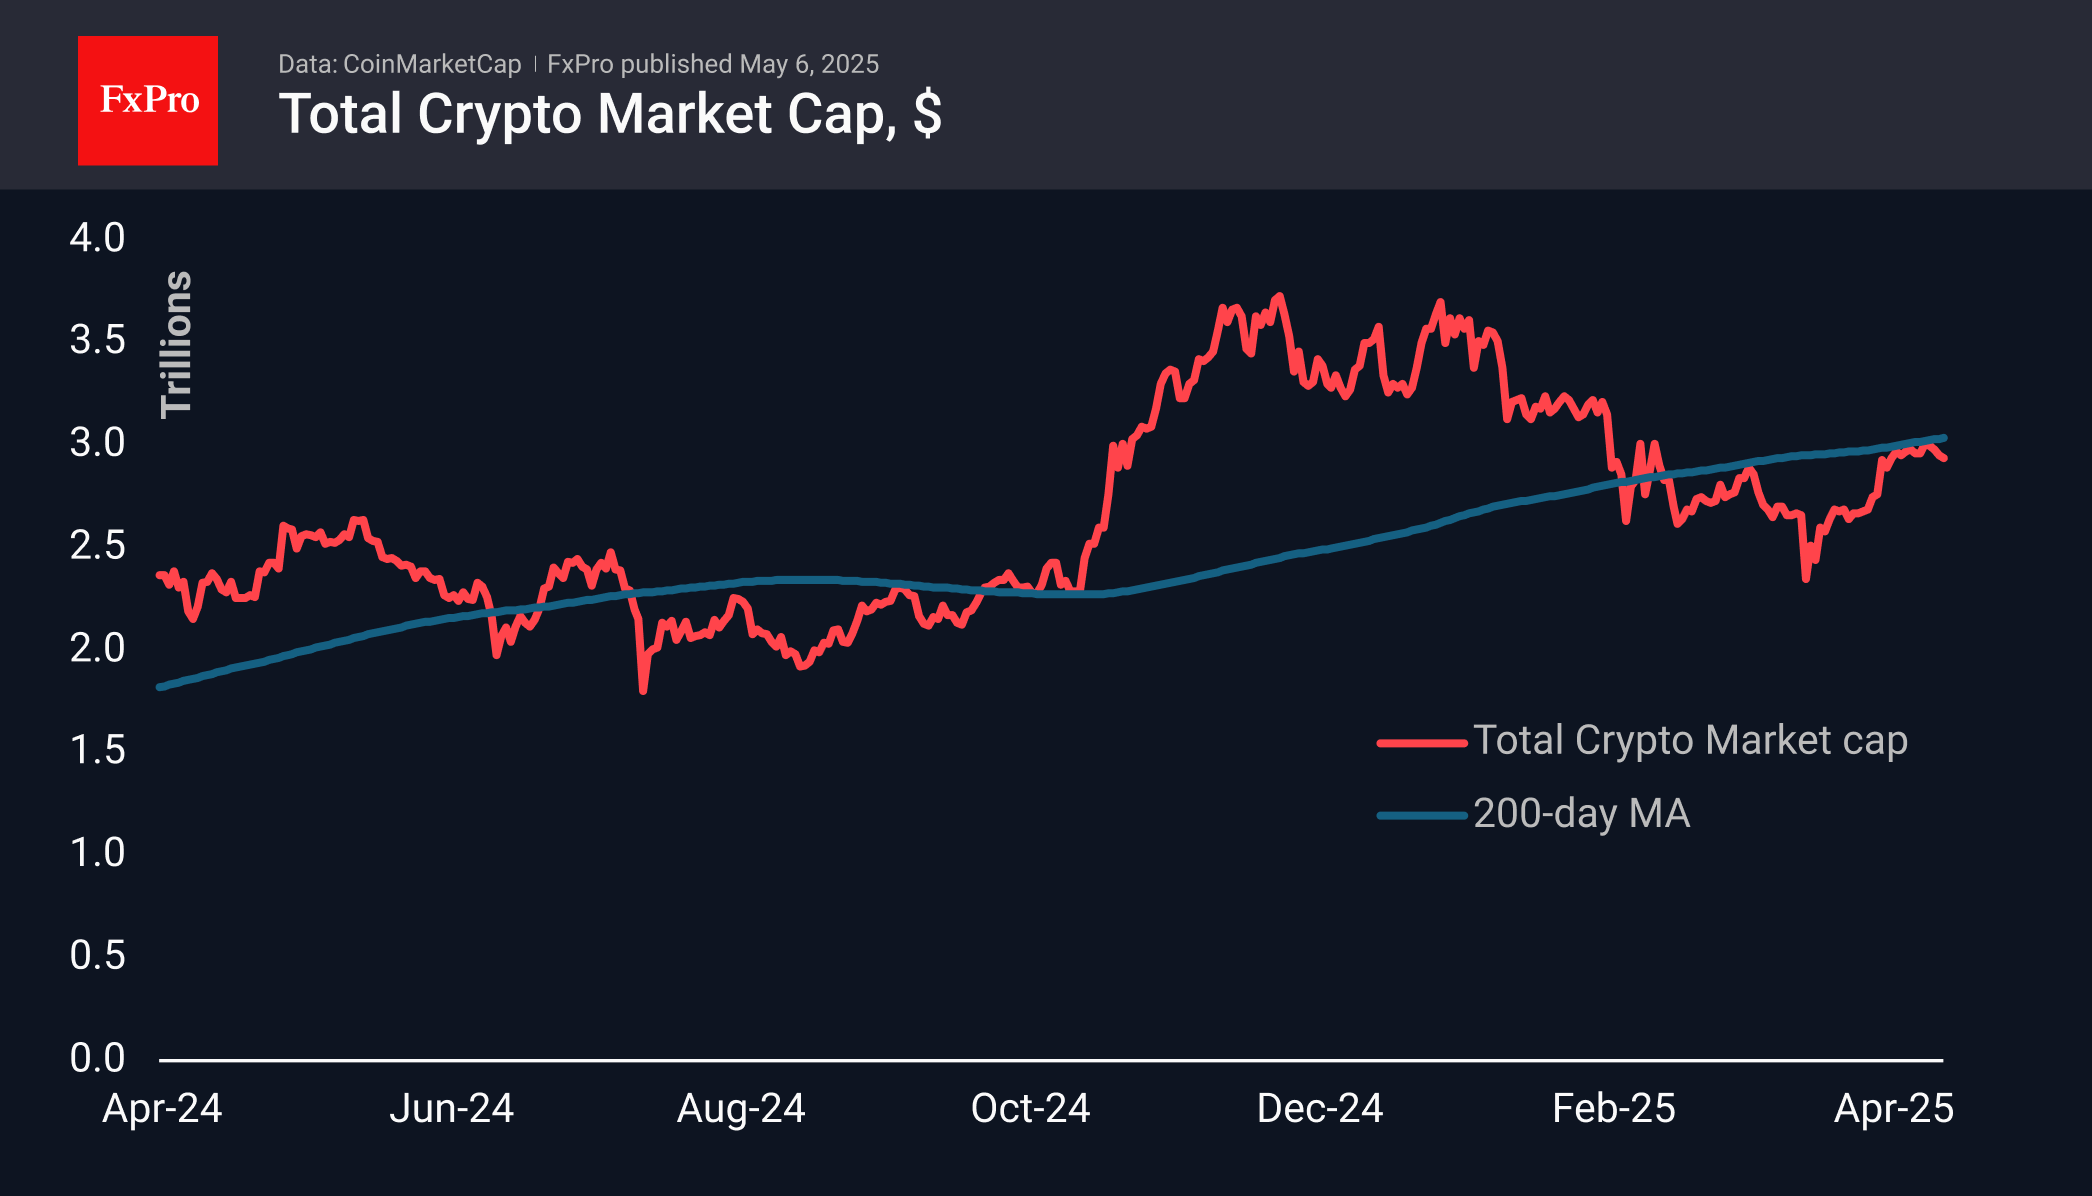
The cryptocurrency market is losing about 1%, charting a downward trend after soaring in the second half of April and plateauing at the very end of the month. With a market capitalisation of $2.94 trillion, the cryptocurrency market is just over 1% below the levels of a week ago. Among the top coins over the past seven days, anonymous Monero and zCash remain in the lead, remaining in positive territory after surging due to a hacker theft last week, which reminds us of the advantages of this type of coin.
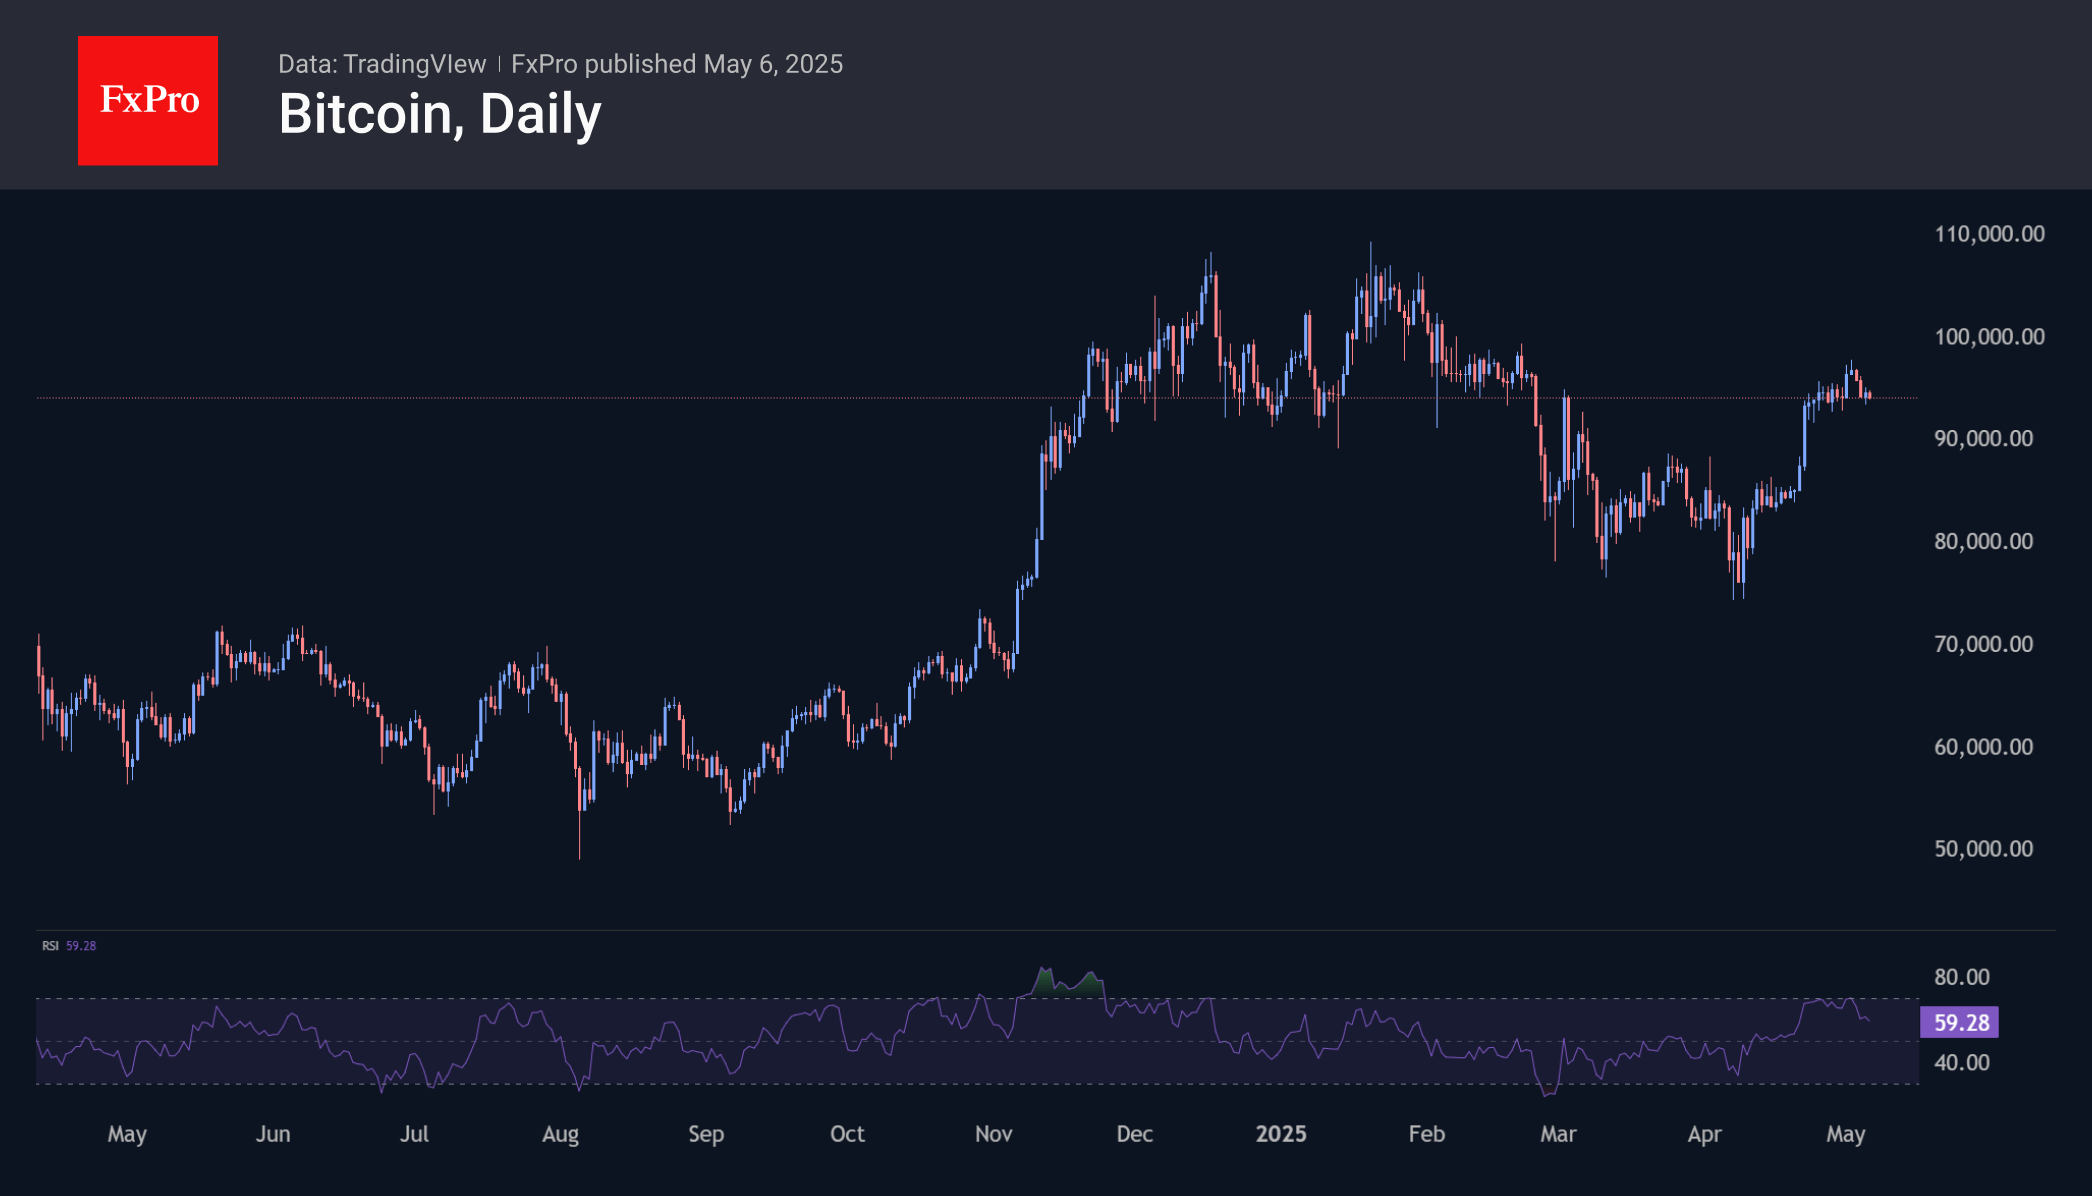
Bitcoin, on the other hand, echoes the general mood of US stock indices, letting off steam in recent days following a surge in the second half of April. This timely cooldown after reaching overbought levels could be a healthy pause, paving the way for further gains.
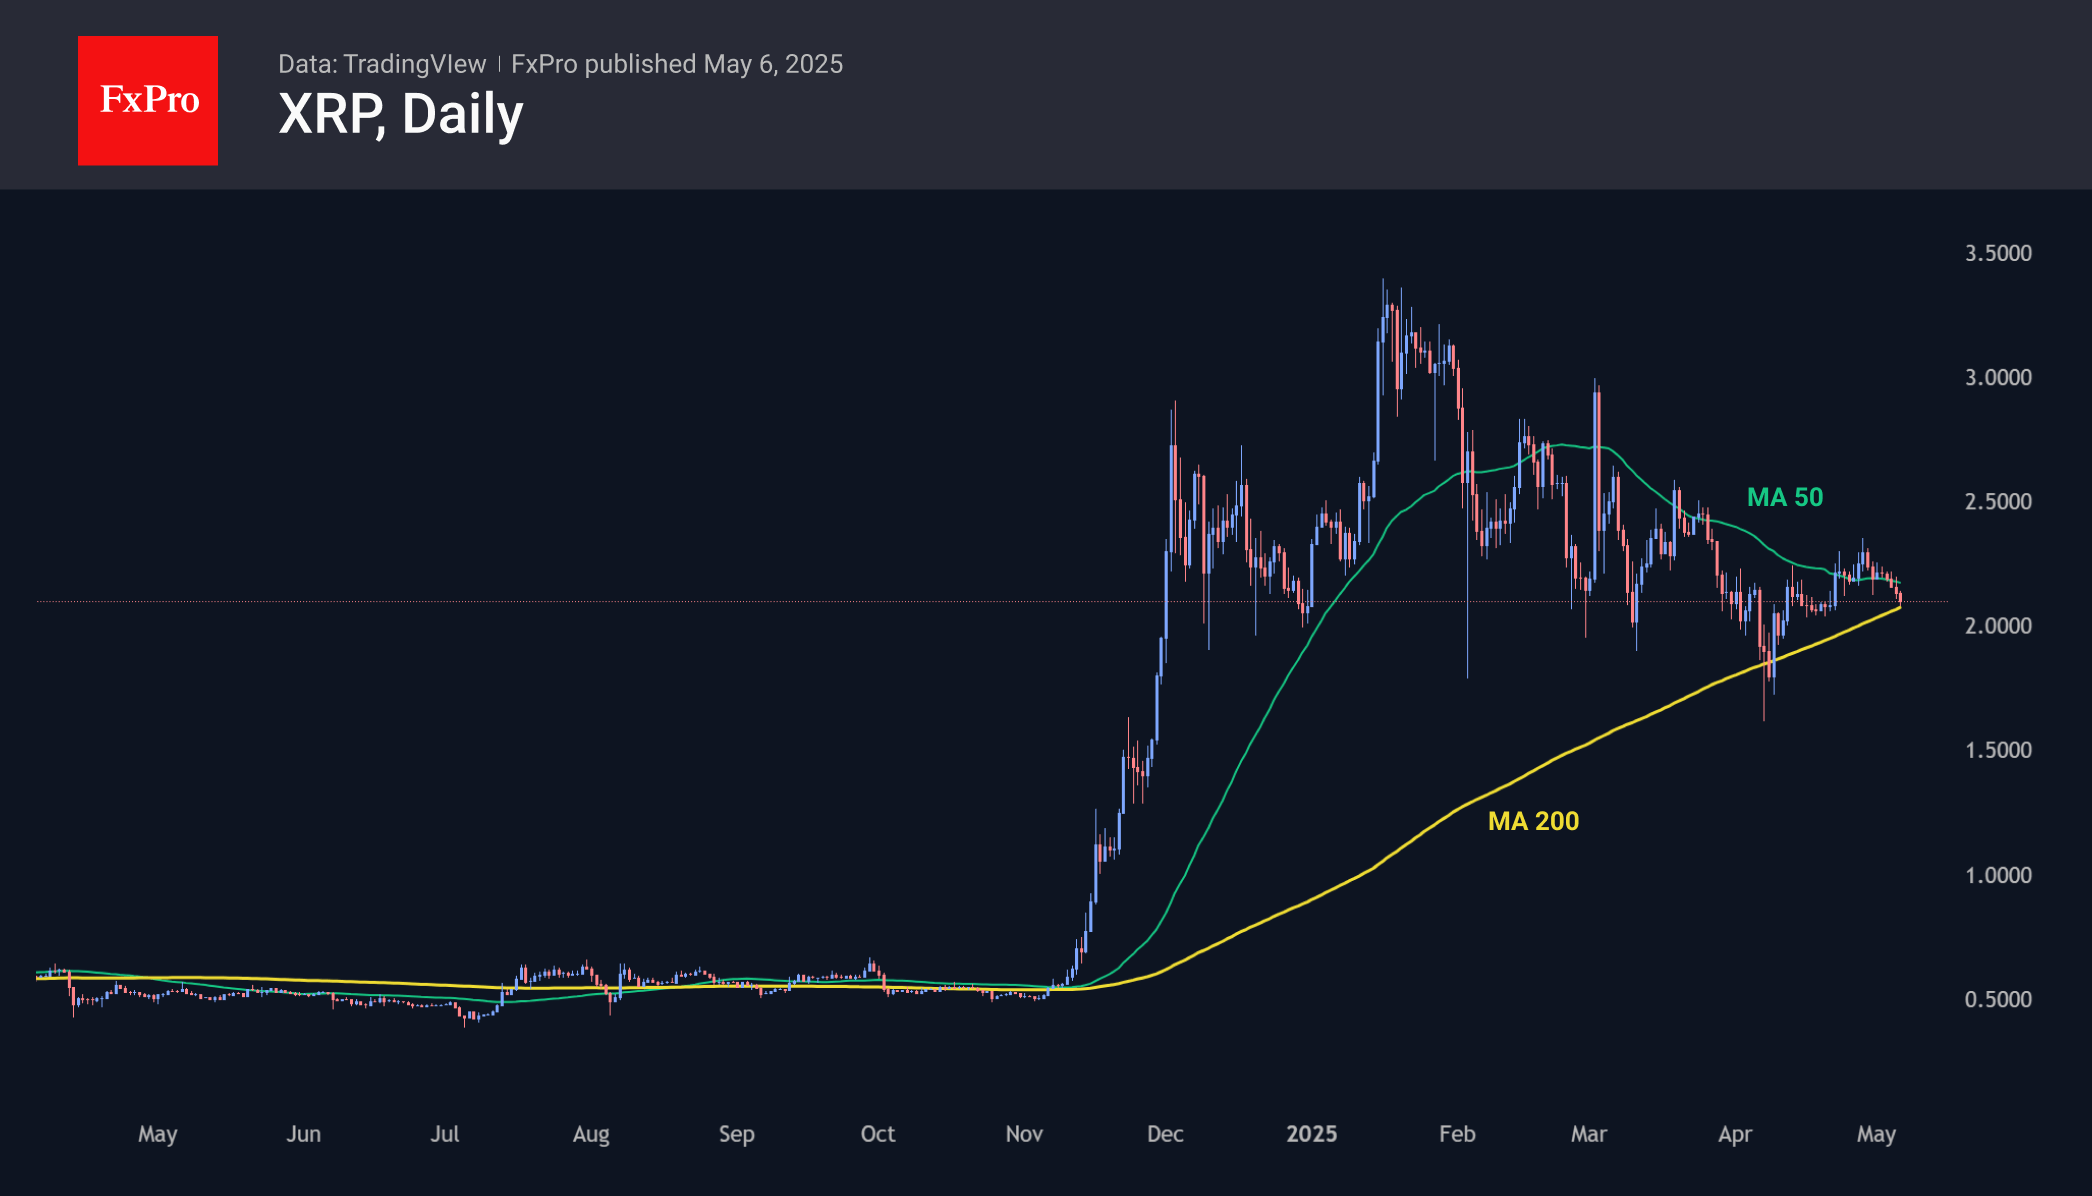
XRP missed out on much of the cryptocurrency rally in late April, and it never managed to break away from its 200- and 50-day moving averages. At $2.09, XRP is trading through the important support of recent months, forcing us to keep a close eye on the direction of the breakout, as it would open the way for a 50% change from the current price. That’s a huge potential.
News background
According to CoinShares, global crypto fund investments rose by a significant $2.029bn last week after inflows of $3.423bn, with bitcoin investments up $1.84bn, Ethereum up $149m, XRP up $11m, Tezos up $8m and Solana up $6m.
Ethereum is preparing for increased volatility following the Pectra hardfork on 7 May. Bollinger bands in the ETH/BTC pair have narrowed sharply in the run-up to the hardfork; the upcoming trend depends largely on the direction of the breakout, notes CoinDesk analyst Omkar Godbole.
88% of BTC supply remains in profit, with losses concentrated among buyers in the $95,000 to $100,000 range. The figure also bounced from its long-term average, indicating a broad reset of investor expectations without a large-scale capitulation, Glassnode noted.
Strategy reported an additional 1,895 BTC ($180.3 million) in purchases last week at an average price of $95,167 per coin. The company owns 555,450 BTC, which were bought at an average price of $68,550. The total investment is valued at $38.08bn.
SNB’ Schlegel signals willingness to revisit negative rates
SNB Chairman Martin Schlegel said that while the central bank does not favor negative interest rates, it remains fully prepared to reintroduce them if necessary.
Speaking at an event today, Schlegel said "if we have to do it, the negative interest rates, we're certainly prepared to do it again".
"For the last couple of quarters, we have always said we are ready to intervene in the forex market if it's necessary," Schlegel said.
The comments come just a day after Swiss CPI data revealed that inflation slowed to 0% in April — the lowest reading in four years. The data has triggered market expectations that SNB will cut its policy rate from the current 0.25% at its upcoming meeting on June 19. Expectations are also mounting that rates could eventually fall back below zero this year.
XAU/USD: Renewed Safe Haven Demand Lifts Gold Price Further
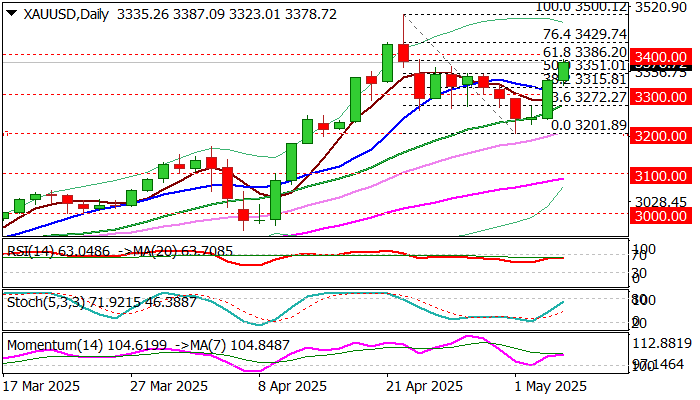
Gold extends strong recovery into second consecutive day and hit two week high on Tuesday, as fresh extension higher cracks Fibo 61.8% of $3500/$3201 pullback ($3286) and near psychological $3400 barrier.
Fresh rise in safe haven demand on renewed concerns about trade conflict with China and worsening geopolitical situation, lifted metals’ price and signaling that pullback from new record high was a healthy correction, which is likely over.
This adds to signals that larger uptrend remains intact and fragile economic and geopolitical situation will continue to fuel migration into safety, implying that gold may rise well above current peak.
Markets also focus on Fed’s policy decision on Wednesday, with wide expectations for unchanged rates at the May meeting and wait for signals about the rate trajectory in the near term from Fed Chief Powell’s press conference.
Technical picture on daily chart is again firmly bullish, with close above $3351 (50% retracement) seen as minimum requirement to validate positive signal and further strengthen near term structure.
Violation of $3386 and $3400 (Fibo 61.8% / psychological) to open way for fresh attack at key $3500 barrier.
Res: 3387; 3400; 3430; 3450.
Sup: 3351; 3315; 3300; 3272.
Gold Price Surge and European Market Overview
European shares barely moved on Tuesday as investors reviewed corporate earnings, watched for possible tariff changes, and waited for the U.S. Federal Reserve's policy decision later this week.
Market sentiment does appear to be holding steady and this is a welcome sign following weeks of swings between risk-on and risk-off. It appears markets are more prepared to deal with remarks and comments from US President Trump which had been a major driving force of sentiment since the start of his Presidential term.
The US administration continues to tout trade deals which as of now have yet to materialize. Investors remain uneasy due to the absence of clear details about deals between the U.S. and its partners, especially after Trump announced new tariffs. On Sunday, President Trump announced a 100% tariff on foreign-made movies and said the next day that he plans to introduce pharmaceutical tariffs in the next two weeks.
For his part, US Treasury Secretary Scott Bessent called the U.S. the top choice for global investment and said Trump's policies would strengthen that position, pushing back against last month’s “sell America” trend. The comments however have done little with both US Stock indices and the US Dollar struggling to gain any traction this week following last week's improved performance.
On the FX front, the US Dollar looked to be over with last week's positive close. However, Asian currencies have been on the offensive against the Greenback.
The shifts raise concerns for the dollar, as they indicate large amounts of money are flowing into Asia, weakening a major source of support for the dollar.
On Tuesday, things stabilized somewhat after Taiwan's currency surged 10% in just two days. Meanwhile, Hong Kong's dollar is nearing the upper limit of its peg, and the Singapore dollar is close to its highest level in over a decade.
EUR/USD is holding above the 1.1300 handle with positive PMI data this morning barely moving the major. Is there room for another upside rally?
Currency Strength Chart, Strongest - Weakest: NZD, EUR, GBP, JPY, USD, CAD, AUD, CHF

Source: FinancialJuice
Gold prices have put in some excellent gains to start the week just as it appeared that bullish pressure may be dissipating. The precious metal reached an Asian session high of $3387/oz and held onto those gains as the European session got underway.
Oil prices rose by more than $1 per barrel on Tuesday. This was due to bargain hunters and technical factors after OPEC+ decided to increase production, which had caused a drop in prices the day before. However, worries about an oversupply in the market remain.
Economic data releases
From a data standpoint, Euro Area PMI for Germany came in better than expected this morning in a welcome boost for Europe's most industrialized economy. Germany was joined by better than expected PMI data from France, Italy and the EU as a whole.
Looking toward the rest of the session we have Euro Area PPI data due in a short while as well as corporate earnings. Later we also have ECB policymaker Panetta speaking which could give more insights into the thoughts of the ECB on recent data and global trade tensions.

For all market-moving economic releases and events, see the MarketPulse Economic Calendar. (click to enlarge)
Chart of the day - Gold
From a technical standpoint, the rise in gold this week should not come as a surprise.
Gold ended last week with what appeared to be sellers exhaustion as the pair failed to print a fresh low on Friday.
Yesterdays massive bullish engulfing candlestick set the stage for the rally to continue today with price action now hinting at fresh highs if the daily candle can close above the 3354.50 swing high.
Immediate resistance rests at 3380 before the 3400 and 3425 handles come into focus.
A pullback from here may find support at 3354 before the 3325 and 3300 handles come back into focus.
Gold Daily Chart, May 6, 2025

Source: TradingView.com (click to enlarge)
New Zealand Economic Outlook: Employment Concerns, RBNZ Decisions, and NZD/USD Analysis
New Zealand Economy: Employment, Inflation, and RBNZ Interest Rate Cuts in Focus
New Zealand's economic landscape is under scrutiny as upcoming employment data and anticipated interest rate decisions influence the value of the New Zealand dollar (NZD). On Tuesday, all eyes are on the quarterly employment change figures, which, according to Bloomberg analyst surveys, are expected to show a marginal improvement of +0.1% compared to the previous quarter's -0.1%. This prior figure marked the lowest point in nearly five years, indicating ongoing weakness in the labor market since early 2024.
Persistent labor market weakness raises concerns that the Reserve Bank of New Zealand (RBNZ) may adopt a more aggressive stance on interest rate cuts than previously anticipated. This potential shift in monetary policy is a key factor impacting the NZD's performance.
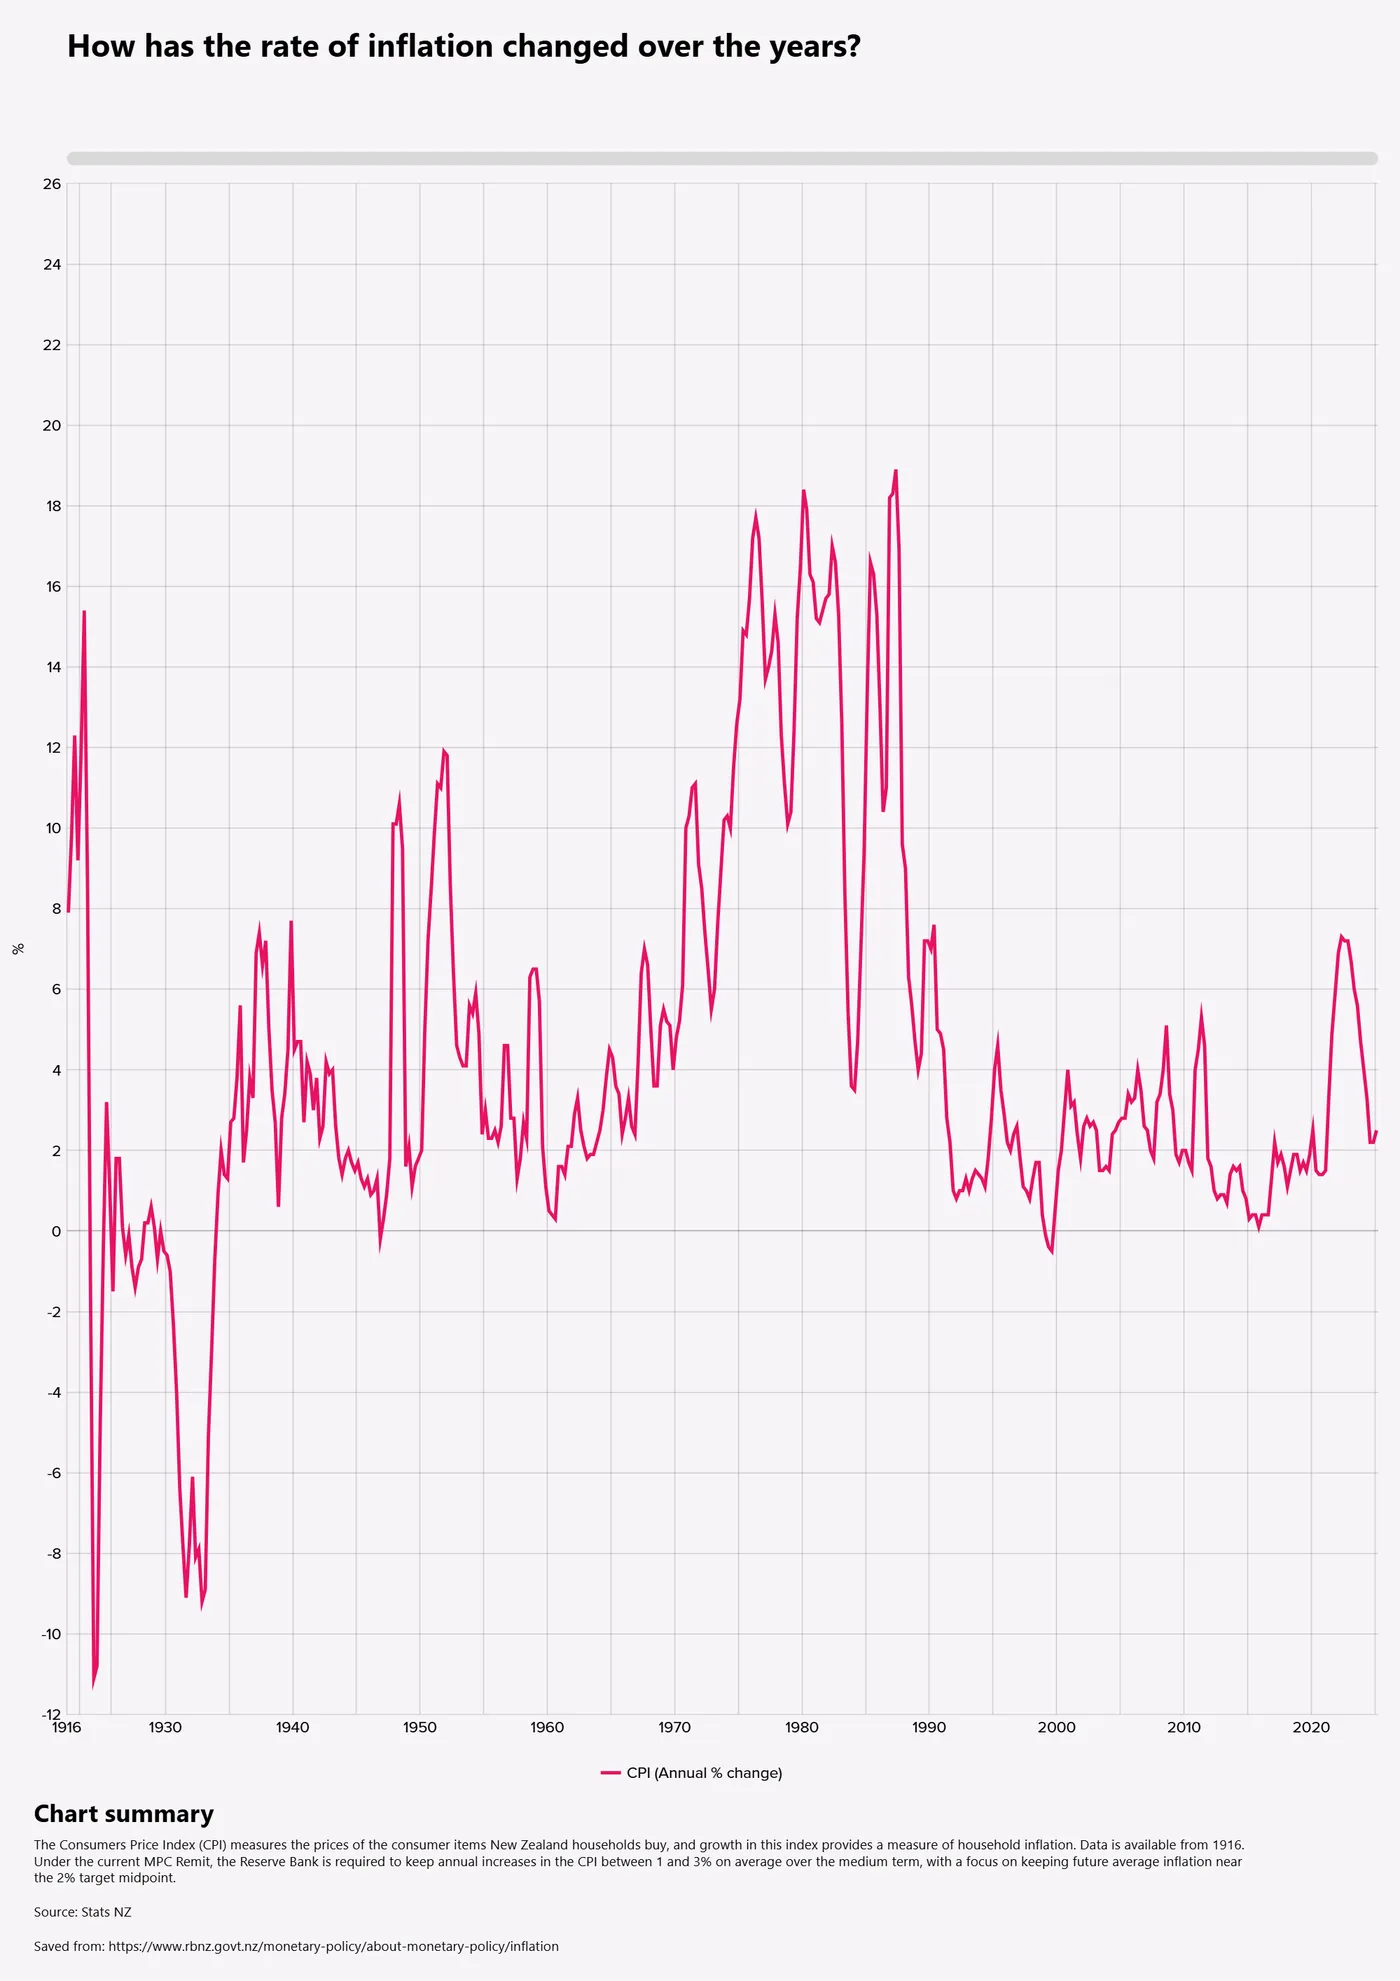
New Zealand Inflation CPI Y/Y Source: Stats NZ - RBNZ https://www.rbnz.govt.nz/monetary-policy/about-monetary-policy/inflation
Currently, New Zealand's annual inflation rate (CPI Y/Y) stands at 2.5%. Surveys suggest a median inflation rate of 2.10% by the end of 2025, remaining steady through 2026. These figures align with the government's target range of 1%-3% in the medium term and 2% in the longer term.
Market consensus overwhelmingly points to an imminent interest rate cut by the RBNZ. Bloomberg's analyst surveys reveal that 100% of participants expect a 25 basis point cut at the upcoming May 28th, 2025 meeting, bringing the interest rate to 3.5%. This follows a previous 25 basis point cut on April 8th, 2025, with further cuts signaled throughout the year.
NZD/USD Technical Analysis and Key Levels - Daily chart
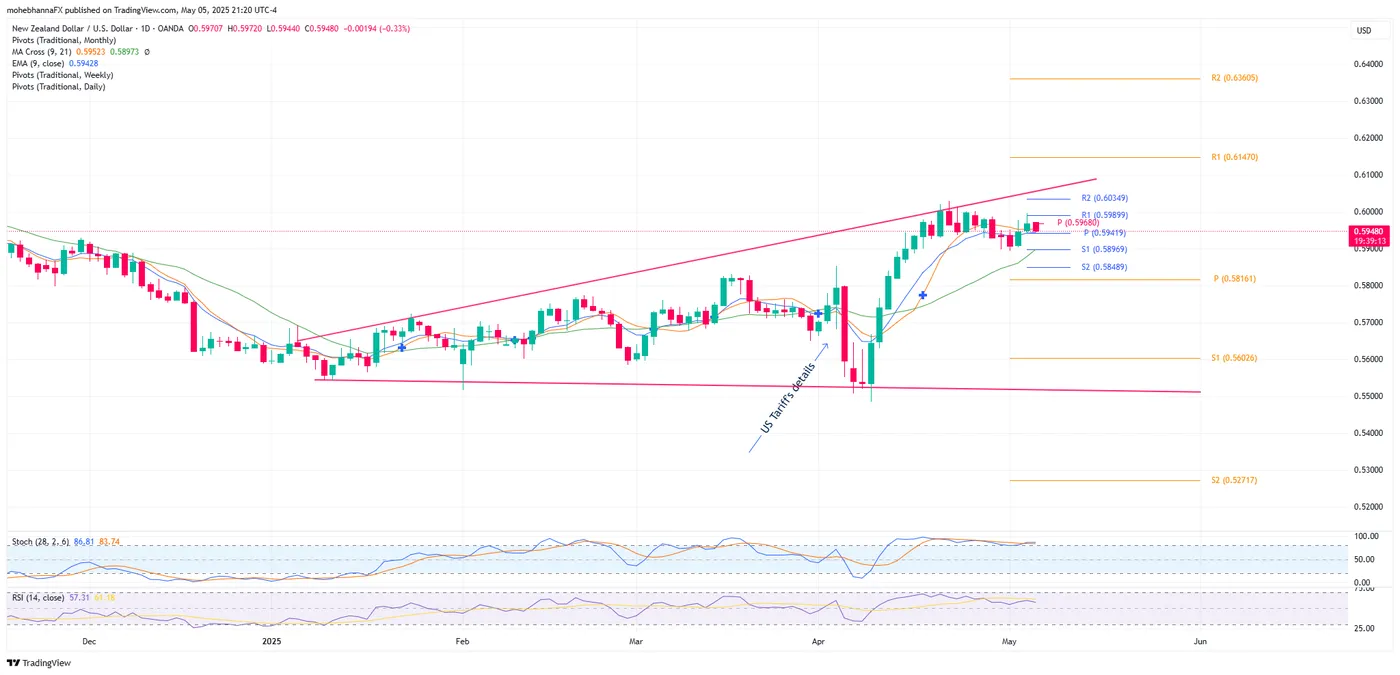
Since the beginning of 2025, the NZD has been trading within a widening pattern against the US dollar. However, the NZD's upward trajectory faced a setback in early April 2025 due to uncertainty surrounding tariffs, pushing the price down to the 0.5480 range, below its yearly open of approximately 0.5600. The NZD has since recovered, regaining lost ground and rising by nearly 10%, briefly surpassing the 0.6000 psychological level, where it currently encounters resistance.
NZD/USD Daily Chart Technical Analysis Source: https://www.tradingview.com/
Technical analysis indicates that the NZD/USD price action is trading above critical support levels, including daily, weekly, and monthly pivot points, as well as its fast and intermediate moving averages. These levels, ranging from 0.5940 to 0.5820, provide significant support. The recent upward movement faces resistance near April 2025 highs, just below 0.6000, which also coincides with the upper boundary of the widening formation. A break above 0.6000 could pave the way for further gains, while a drop below key support levels could lead to further declines towards the pattern's lower boundary.
Both the Relative Strength Index (RSI) and Stochastic indicators reflect the current price action, showing overbought conditions since early April 2025 without any divergences.
In conclusion, New Zealand's economic situation, particularly the employment data and the RBNZ's anticipated interest rate decisions, continues to play a crucial role in shaping the NZD's performance against the USD. Traders and investors are closely monitoring these developments for potential market movements.
GBP/USD Shows Bullish Spark, But Key Resistance Nearby
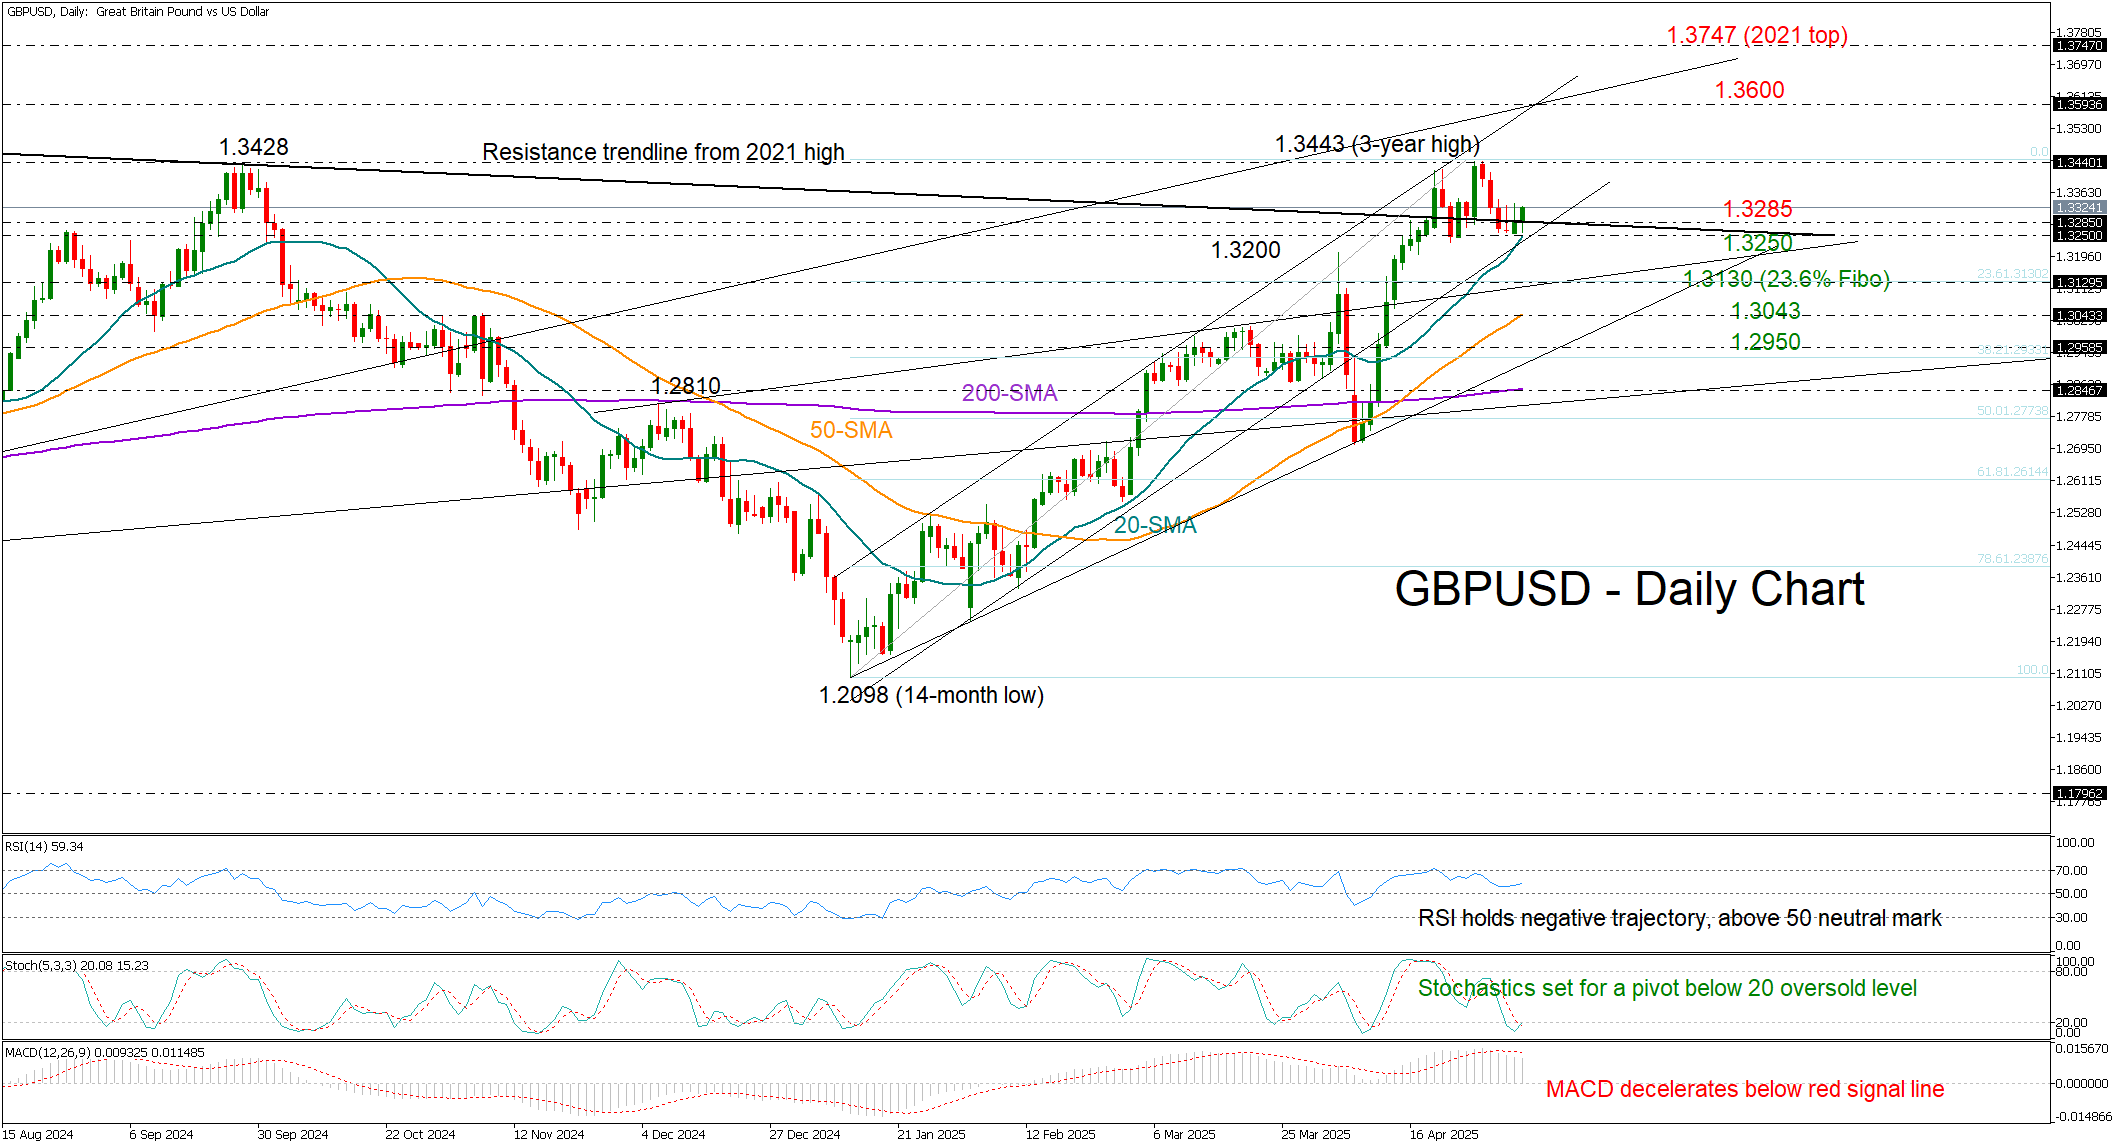
- GBPUSD sends mixed signals near key support area of 1.3250.
- Bulls need a decisive close above 1.3285.
GBPUSD seems to have ended Monday’s session with an inverted hammer candlestick - a potential sign of a positive reversal - just ahead of this week’s key FOMC and Bank of England (BoE) rate decisions on Wednesday and Thursday respectively.
The promising pattern is developing near 1.3250, a support area that has been holding for two weeks, with the rising 20-day simple moving average (SMA) adding extra credence to the region. This suggests a rebound could be brewing. However, the long-term resistance trendline from June 2021 has resumed its role near 1.3285 and the bulls will have to successfully breach that border to activate fresh buying.
Fundamentally, the Fed is expected to hold rates steady at 4.50%, while the BoE is forecast to cut by 25 basis points to 4.25%. The widening rate gap would slightly favor the dollar, but it remains to be seen whether the Fed will still consider cutting rates as early as June, especially after a disappointing Q1 GDP reading was followed by a surprisingly strong employment report.
Technically, a sustainable move above 1.3285 could lift the price straight to April’s three-year high of 1.3443. A victory there could cause a swift bull run towards the key trendline zone around 1.3600 and then up to the 2022 top of 1.3747.
Conversely, a drop below the 20-day SMA at 1.3250 could drag the pair toward 1.3130, where the 23.6% Fibonacci retracement of the 2025 uptrend is located. A break lower could meet the 50-day SMA currently near 1.3043, while a deeper decline might halt around the support trendline at 1.2950.
All in all, GBPUSD is still rangebound, sending conflicting signals, with traders awaiting a clear breakout above 1.3285 or a breakdown below 1.3250 to determine its next direction.
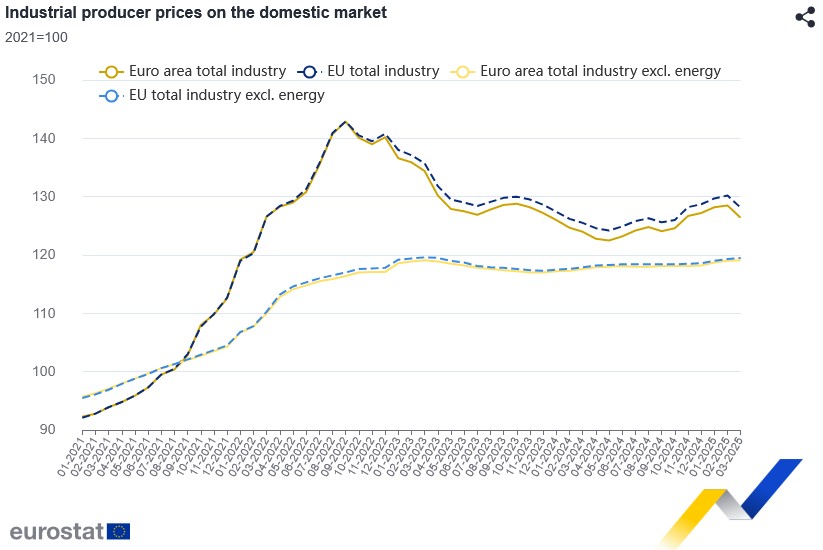
Eurozone PPI falls -1.6% mom in March on steep energy decline
Eurozone PPI fell -1.6% mom in March, dragged down by a steep -5.8% mom drop in energy costs. Excluding energy, however, PPI ticked up 0.1% mom. Annually, PPI stood at 1.9% yoy, down from prior month's 3.0% yoy.
Modest monthly gains was seen across most segments — 0.1% mom for capital goods, 0.2% mom for durable consumer goods, and 0.5% mom for non-durable goods. Intermediate goods were unchanged.
In the broader EU, PPI also fell -1.6% m/m and rose 2.1% yoy. The largest monthly decreases in industrial producer prices were recorded in Estonia (-8.0%), Spain (-3.9%) and Italy (-3.3%). The highest increases were observed in Greece (+1.3%), Luxembourg (+0.9%) and Slovenia (+0.6%).
Japanese Yen Halts Gains as US Trade Negotiations Return to the Spotlight
USD/JPY had an opportunity to correct after two consecutive days of decline, with Tuesday’s trading centred around 143.78.
Dollar strengthens on trade optimism and Fed anticipation
The US dollar regained ground as markets reacted to renewed expectations surrounding US-China trade negotiations. Investor caution also grew ahead of the Federal Reserve’s meeting, which begins today.
President Donald Trump cautiously suggested that the 145% tariffs on Chinese imports might be reduced. However, true to form, he offered only a vague hint, further adding to the already uncertain outlook for US-China relations.
Markets are also paying attention to the US-Japan bilateral talks regarding trade engagement. Tokyo aims to finalise an agreement before the June deadline, and any delays could complicate the process further.
Meanwhile, last week’s Bank of Japan meeting saw no change in the key interest rate, which remains at 0.5% per annum. However, the BoJ lowered its GDP and inflation forecasts, reinforcing the view that it does not intend to raise rates soon.
Japan observes a bank holiday on Tuesday, so no major domestic news is expected.
Technical analysis of USD/JPY
On the H4 chart, USD/JPY completed a growth wave towards 145.86, followed by the start of a corrective phase. The first downward impulse reached 143.72, followed by a correction to 145.05. The market is now forming a consolidation range around 144.30. A downward breakout from this range could send the pair to 142.75. The MACD indicator supports this scenario, as its signal line has exited the histogram area and points firmly downwards, suggesting continued bearish pressure.

On the H1 chart, the pair is building a corrective structure targeting 142.75. The local correction target of 143.53 has already been achieved. Today, there is a strong likelihood of a fifth downward wave in this correction, with 142.75 as the next target. Once this level is reached, a new upward wave towards 145.86 may begin. The Stochastic oscillator confirms this view, with its signal line below 50 and heading sharply towards 20, indicating strong short-term downside momentum.

Conclusion
USD/JPY is currently in a corrective phase as markets digest renewed trade hopes and prepare for the Fed’s decision. Technical indicators support further downside towards 142.75, with a possible reversal to 145.86 thereafter. Trade talks with both China and Japan, along with the Fed’s stance, will remain the key drivers of short-term volatility for the pair.
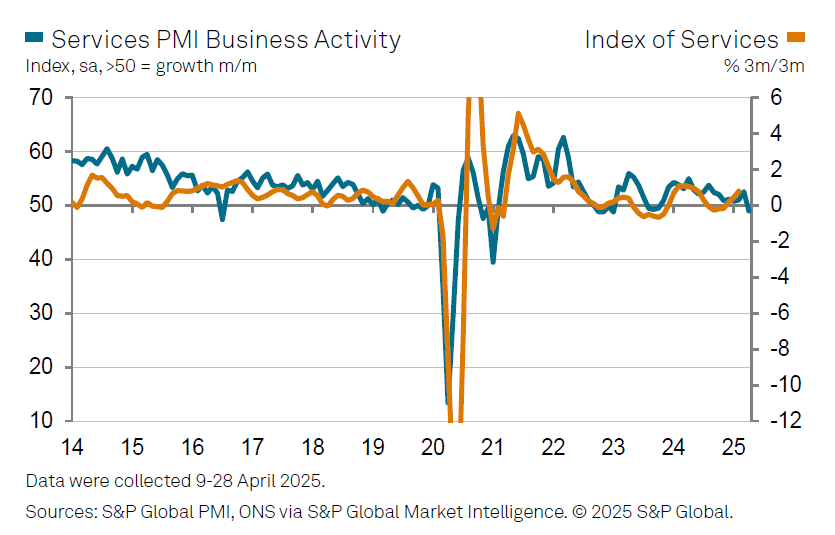
UK PMI services finalized at 49.0, tariffs and wage costs hit outlook
UK PMI Services was finalized at 49.0 in April, down from 52.5 in March, its lowest level since January 2023. PMI Composite also dropped into contraction at 48.5, marking the first negative reading in 18 months.
S&P Global’s Tim Moore pointed to heightened business uncertainty as a major drag on activity. Export conditions were the weakest since early 2021. Rising payroll costs linked to National Insurance hikes and increased National Living Wage rates contributed to the sharpest input cost growth since mid-2023. Service providers responded with their steepest price increases in nearly two years.
Business confidence deteriorated significantly as "service sector firms braced for an extended period of global economic turbulence and heightened recession risks." 22% of firms forecasted a decline in activity over the next 12 months—more than triple the level seen after the 2024 general election.
Eurozone PMI services finalized at 50.1, cost pressure easing, hiring hesitant
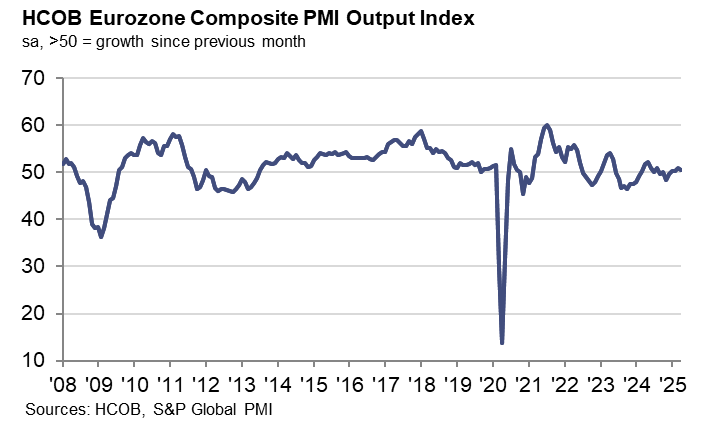
Eurozone's PMI Composite was finalized at 50.4 in April, down from 50.9 in March, confirming a sluggish start to Q2. The services sector, a critical growth engine, nearly stalled with a reading of 50.1, down from 51.0.
Nationally, Ireland (54.0) led the bloc in growth, followed by Spain (52.5) and Italy (52.1). Germany (50.1) was in slight expansion, while France (47.8) fell deeper into contraction territory.
Cyrus de la Rubia of Hamburg Commercial Bank noted that cost pressures in services remain "relatively high", but easing price trends are adding weight to expectations for an ECB rate cut in June.
Employment growth across the Eurozone has stabilized, though businesses remain hesitant to expand their workforce amid continued uncertainty.
Country-level divergence is also growing more apparent. Germany’s growth is fragile but could improve in coming months, supported by its new fiscal stimulus measures.