Sample Category Title
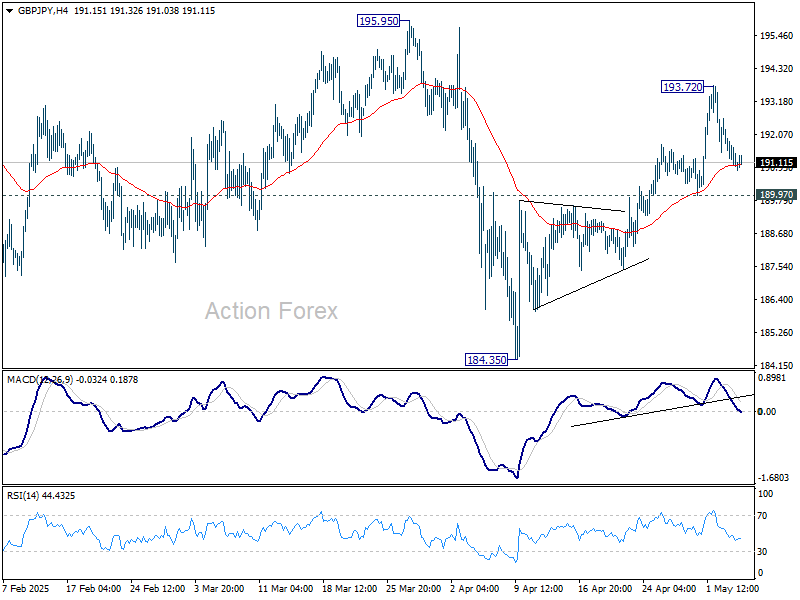
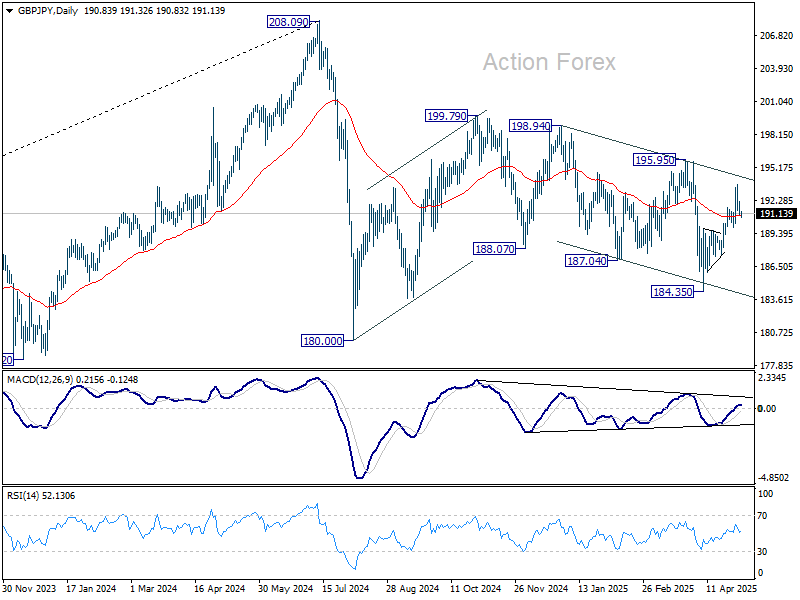
GBP/JPY Daily Outlook
Daily Pivots: (S1) 190.63; (P) 191.47; (R1) 191.92; More...
Intraday bias in GBP/JPY remains neutral and more consolidations could be seen below 193.72. Further rise is expected as long as 189.97 support holds. Above 193.72 will resume the rise from 184.35 and target 195.95 resistance next.
In the bigger picture, price actions from 208.09 are seen as a correction to rally from 123.94 (2020 low). Strong support should be seen from 38.2% retracement of 123.94 to 208.09 at 175.94 to contain downside. However, sustained break of 175.94 will bring deeper fall even still as a correction.
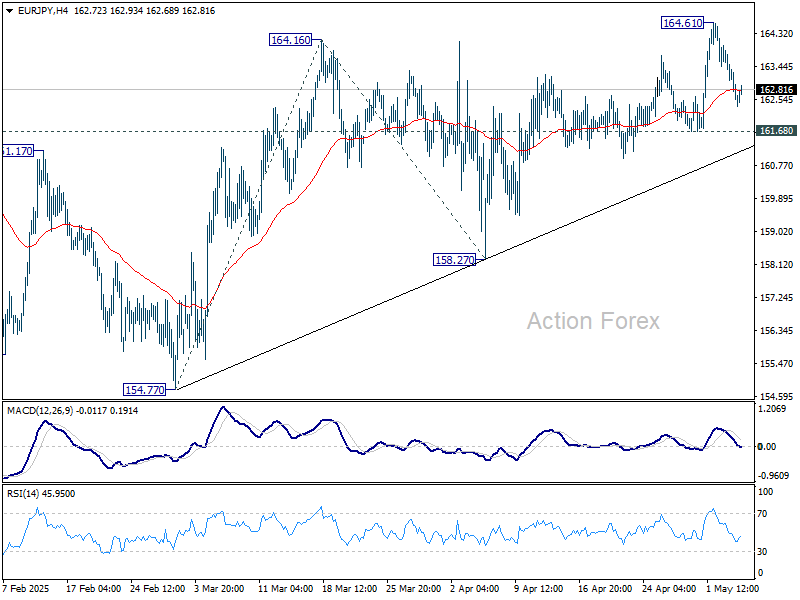
EUR/JPY Daily Outlook
Daily Pivots: (S1) 162.15; (P) 163.02; (R1) 163.48; More...
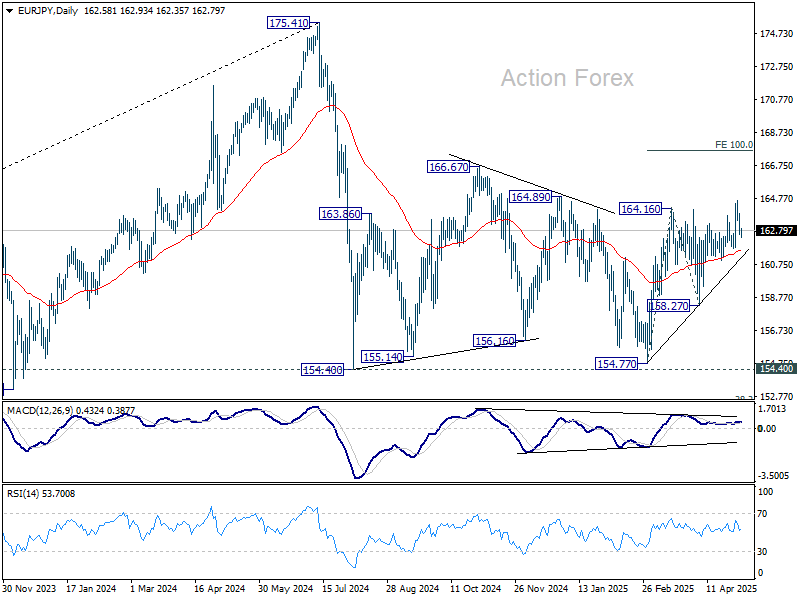
Intraday bias in EUR/JPY remains neutral at this point, and some more consolidations could be seen. But further rally is expected as long as 161.68 support holds. Above 164.61 will resume the rise from 154.77 to 100% projection of 154.77 to 164.16 from 158.27 at 167.66.
In the bigger picture, price actions from 175.41 are seen as correction to rally from 114.42 (2020 low). Strong support should be seen from 38.2% retracement of 114.42 to 175.41 at 152.11 to contain downside. However, sustained break of 152.11 will bring deeper fall even still as a correction.
EUR/GBP Daily Outlook
Daily Pivots: (S1) 0.8504; (P) 0.8518; (R1) 0.8527; More...
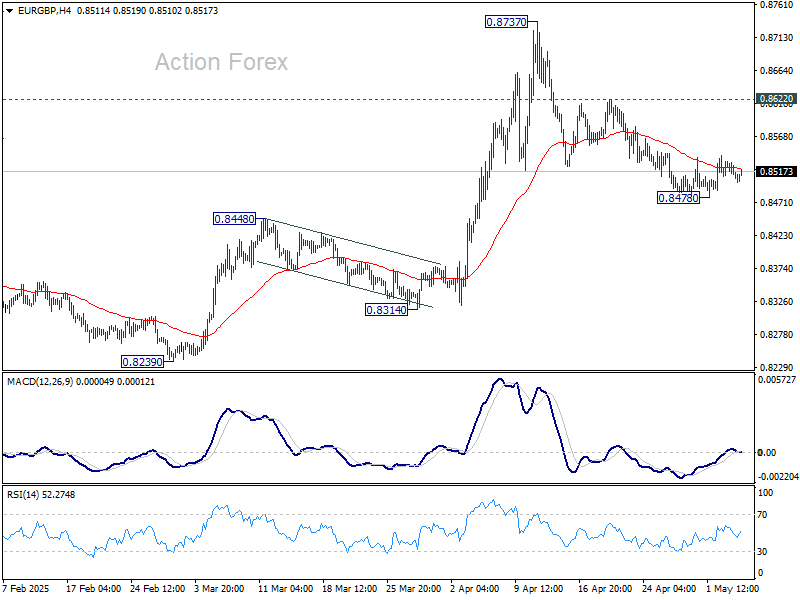
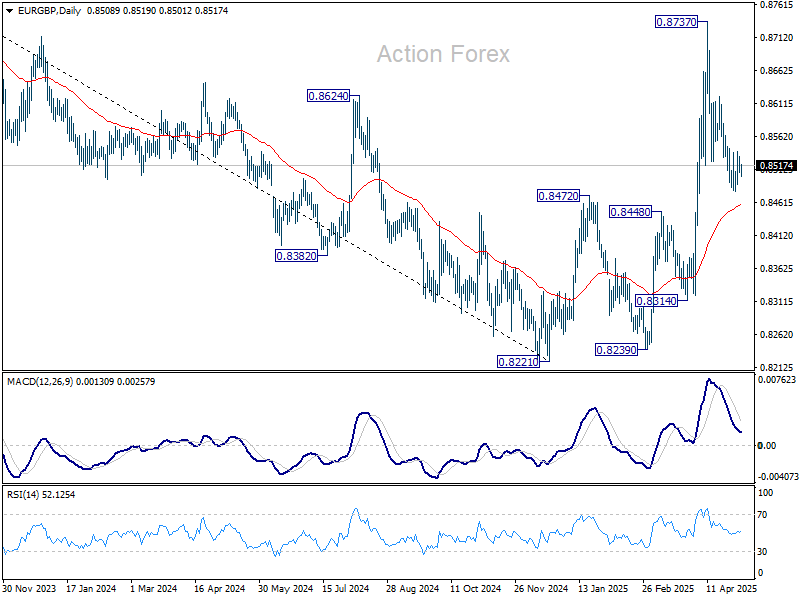
Intraday bias in EUR/GBP stays neutral at this point. On the downside, below 0.8478 will target 55 D EMA (now at 0.8455). Sustained trading below there will suggest that whole rise from 0.8221 has already complete and turn outlook bearish. However, break of 0.8622 resistance will suggest that the correction from 0.8737 has completed, and retain near term bullishness.
In the bigger picture, down trend from 0.9267 (2022 high) should have completed at 0.8221, just ahead of 0.9201 key support (2024 low). Rise from 0.8221 is likely reversing the whole fall. Further rise should be seen to 61.8% retracement of 0.9267 to 0.8221 at 0.8867 next. This will remain the favored case as long as 0.8472 resistance turned support holds.
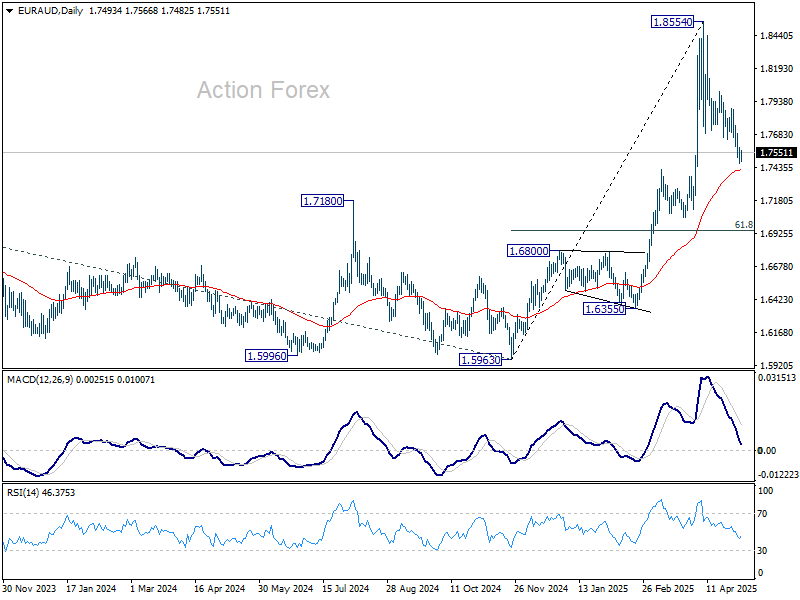
EUR/AUD Daily Outlook
Daily Pivots: (S1) 1.7441; (P) 1.7514; (R1) 1.7565; More...
Intraday bias in EUR/AUD is turned neutral firs with current recovery. Another fall is mildly in favor as long as 1.7886 resistance holds. Sustained break of 55 D EMA (now at 1.7418) will target 61.8% retracement at 1.6953. On the upside, though, break of 1.7886 resistance will turn bias back to the upside for retesting 1.8554 high.
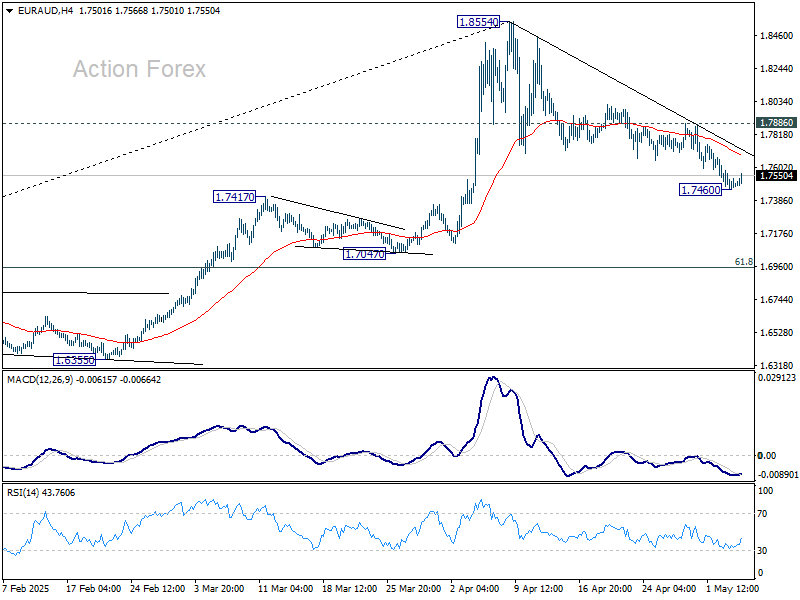
In the bigger picture, up trend from 1.4281 (2022 low) is in progress for 100% projection of 1.4281 to 1.7062 from 1.5963 at 1.8744. Firm break there will pave the way to 138.2% projection at 1.9806, which is close to 1.9799 (2020 high). Outlook will remain bullish as long as 1.7062 resistance turned support (2023 high) holds even in case of deep pullback.
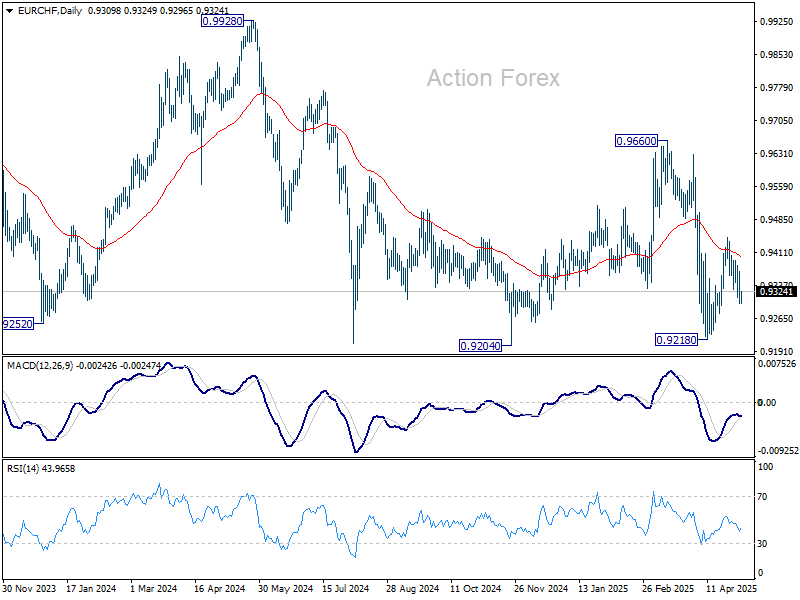
EUR/CHF Daily Outlook
Daily Pivots: (S1) 0.9279; (P) 0.9324; (R1) 0.9348; More....
Intraday bias in EUR/CHF stays neutral and outlook is unchanged. On the upside, above 0.9445 will resume the rebound from 0.9218, either as a corrective move or the third leg of the pattern from 0.9204. However, break of 0.9274 will suggest that that recovery has completed, and bring retest of 0.9204/18 support zone.
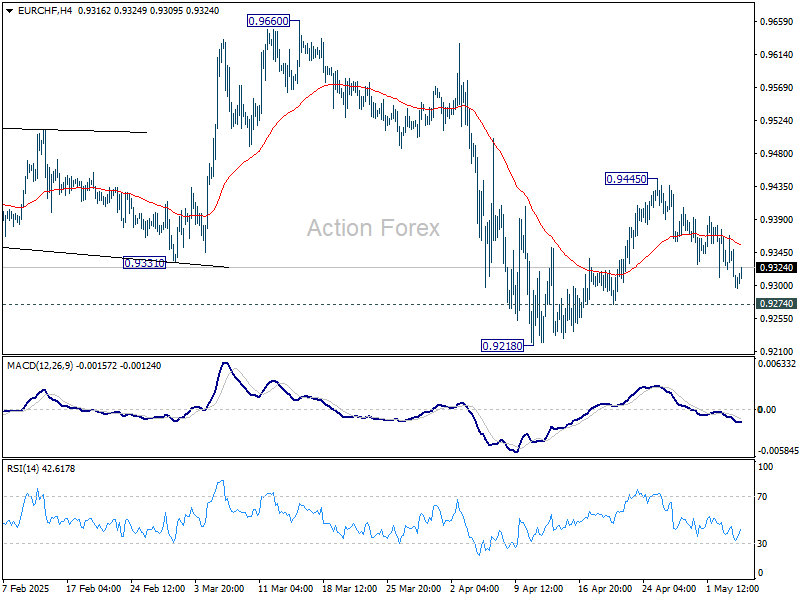
In the bigger picture, prior rejection by long-term falling channel resistance (now at 0.9555) retains medium term bearishness. That is, down trend from 1.2004 (2018 high) is still in progress. Firm break of 0.9204 (2024 low) will confirm resumption. This will remain the favored case as long as 0.9660 resistance holds.
USD/CAD Daily Outlook
Daily Pivots: (S1) 1.3797; (P) 1.3814; (R1) 1.3840; More...
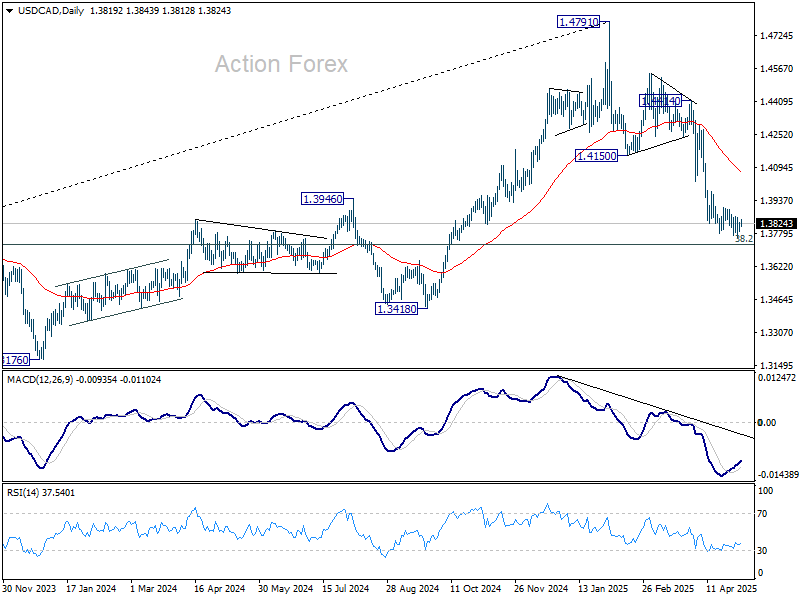
Further decline is mildly in favor with 1.3903 resistance intact, for 1.3727 fibonacci level next. However, considering bullish convergence condition in 4H MACD, firm break of 1.3903 resistance should indicate short term bottoming, and turn bias back to the upside for stronger rebound to 55 D EMA (now at 1.4068).
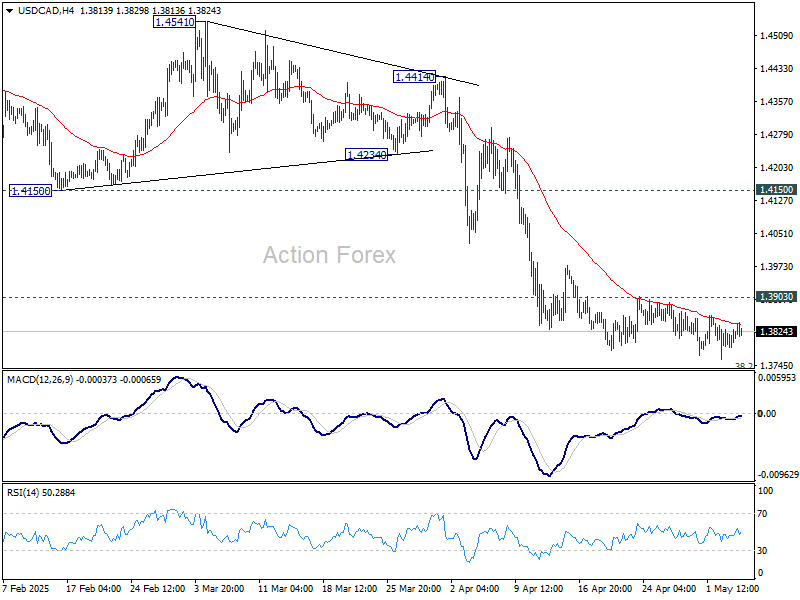
In the bigger picture, price actions from 1.4791 medium term top could either be a correction to rise from 1.2005 (2021 low), or trend reversal. In either case, further decline is expected as long as 1.4150 resistance turned support holds. Firm break of 38.2% retracement of 1.2005 (2021 low) to 1.4791 at 1.3727 will pave the way back to 61.8% retracement at 1.3069.
AUD/USD Daily Report
Daily Pivots: (S1) 0.6437; (P) 0.6465; (R1) 0.6497; More...
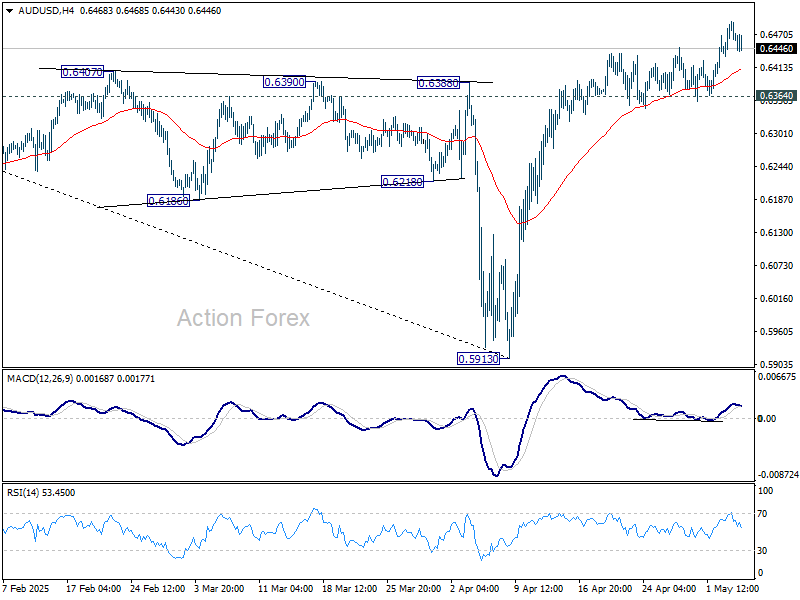
AUD/USD's rise from 0.5913 is in progress. Intraday bias remains on the upside for 61.8% retracement of 0.6941 to 0.5913 at 0.6548. On the downside, though, break of 0.6364 support will indicate short term topping, and turn bias to the downside for 55 D EMA (now at 0.6325) and below.
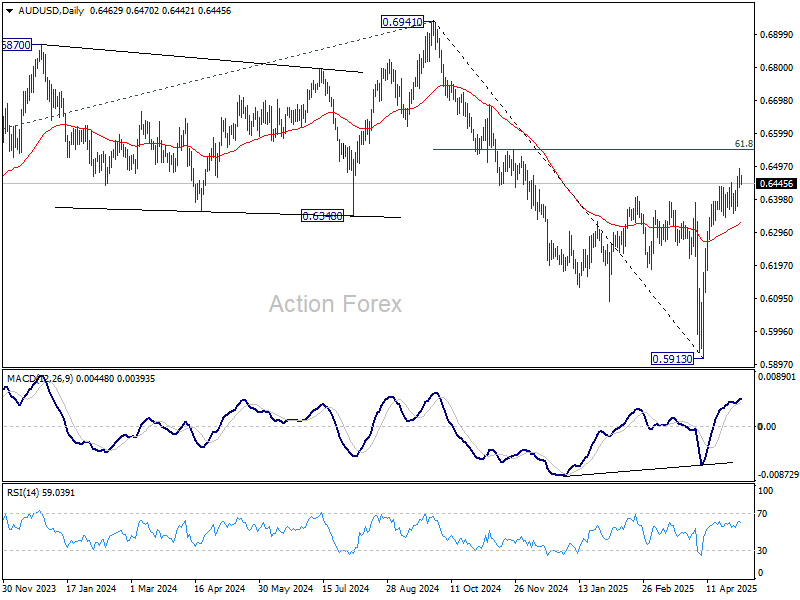
In the bigger picture, as long as 55 W EMA (now at 0.6443) holds, the down trend from 0.8006 (2021 high) should resume later to 61.8% projection of 0.8006 to 0.6169 from 0.6941 at 0.5806. However, sustained trading above 55 W EMA will argue that a medium term bottom was already formed, and set up further rebound to 0.6941 resistance instead.
EUR/USD Daily Outlook
Daily Pivots: (S1) 1.1285; (P) 1.1324; (R1) 1.1354; More...
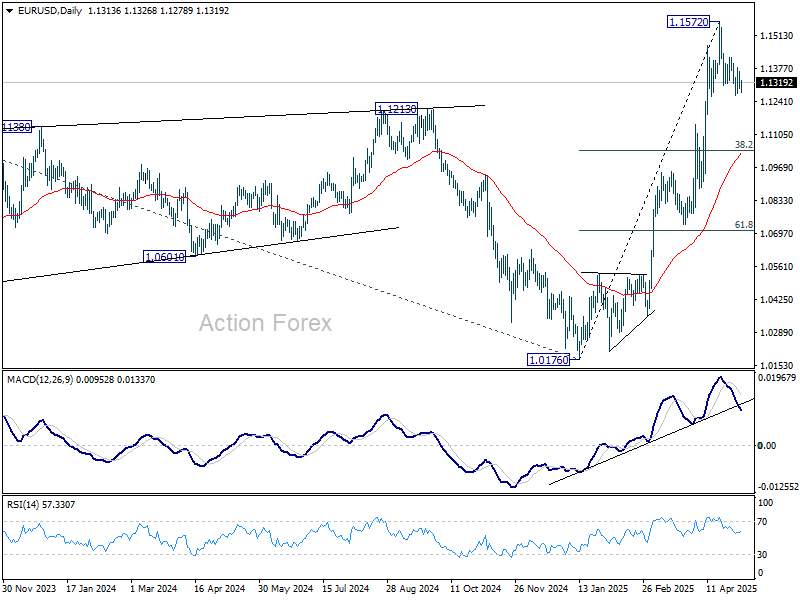
Intraday bias in EUR/USD stays neutral as range trading continues above 1.1265. On the downside, below 1.1265 will resume the corrective fall from 1.1572 short term top. But downside should be contained by 38.2% retracement of 1.0176 to 1.1572 at 1.1039. On the upside, break of 1.1424 will suggest that the correction has completed and bring retest of 1.1572 high.
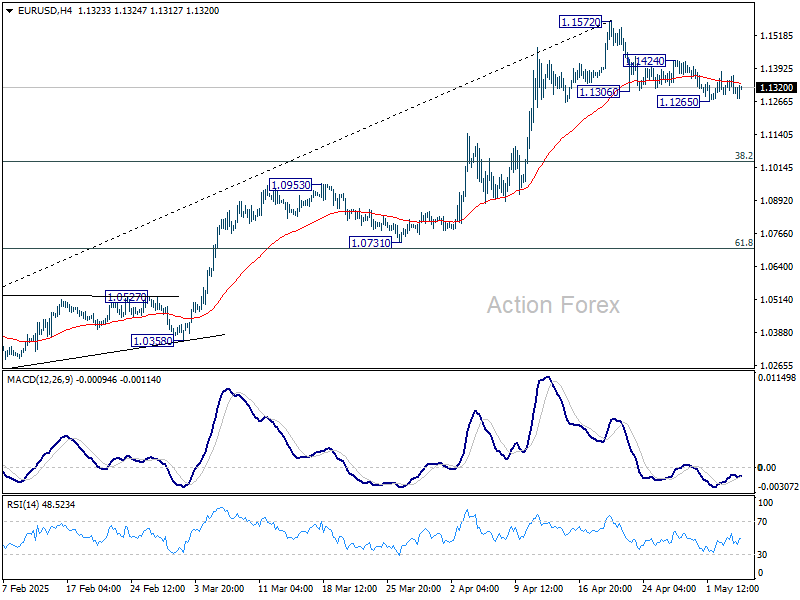
In the bigger picture, rise from 0.9534 long term bottom could be correcting the multi-decade downtrend or the start of a long term up trend. In either case, further rise should be seen to 100% projection of 0.9534 to 1.1274 from 1.0176 at 1.1916. This will now remain the favored case as long as 55 W EMA (now at 1.0808) holds.
GBP/USD Daily Outlook
Daily Pivots: (S1) 1.3258; (P) 1.3298; (R1) 1.3335; More...
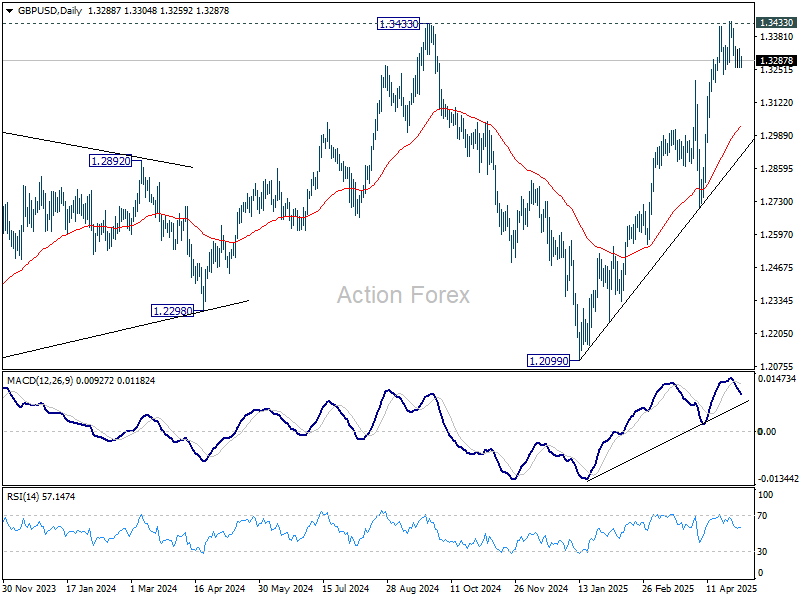
GBP/USD is still bounded in range below 1.3442 and intraday bias stays neutral. On the downside, firm break of 1.3232 support will indicate short term topping and rejection by 1.3433 key resistance. Intraday bias will be back on the downside for deeper pullback to 55 D EMA (now at 1.3030) and possibly below. On the upside, firm break of 1.3433 key resistance confirm larger up trend resumption.
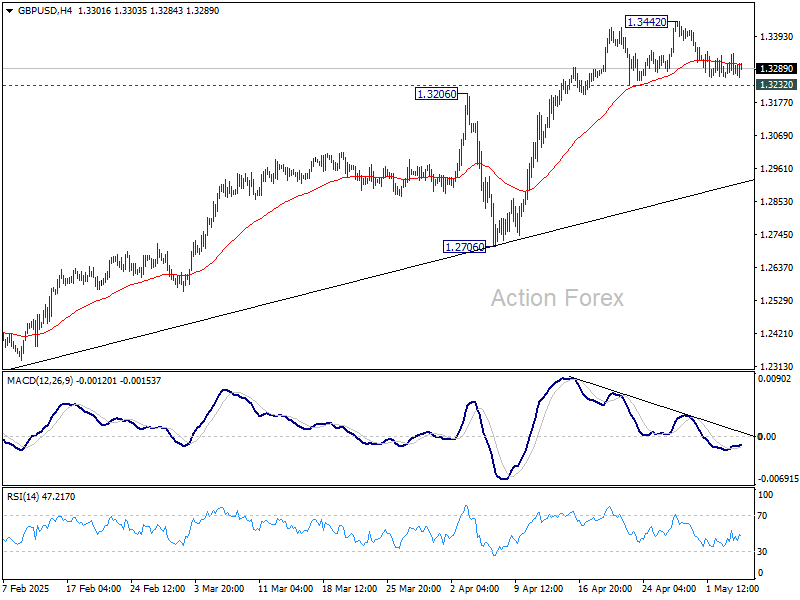
In the bigger picture, price actions from 1.3433 are seen as a corrective pattern to the up trend from 1.3051 (2022 low). Rise from 1.2099 could either be resuming the up trend, or the second leg of a consolidation pattern. Overall, GBP/USD should target 1.4248 key resistance (2021 high) on decisive break of 1.3433 at a later stage.
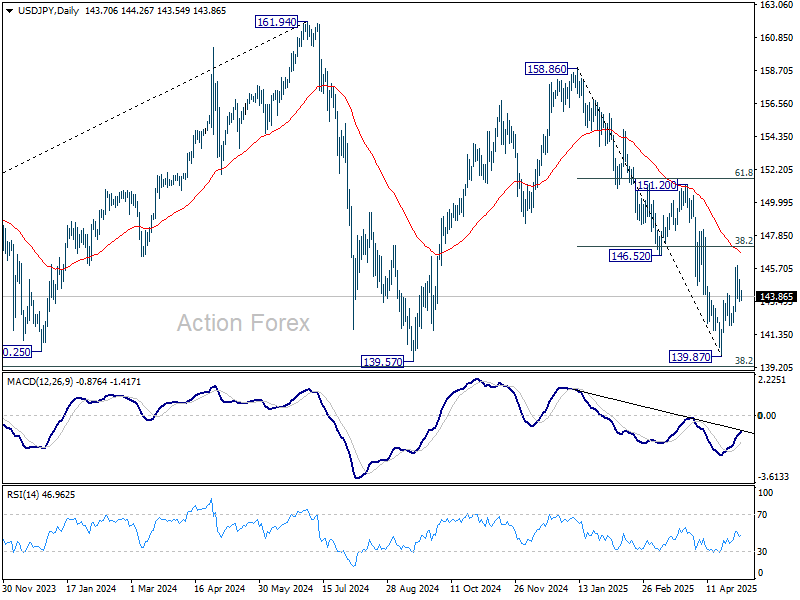
USD/JPY Daily Outlook
Daily Pivots: (S1) 143.16; (P) 144.08; (R1) 144.61; More...
Range trading continues in USD/JPY and intraday bias remains neutral. While rebound from 139.87 could extend higher, near term outlook will stay bearish as long as 38.2% retracement of 158.86 to 139.87 at 147.12 holds. Break of 141.96 support will argue that the rebound has completed as a corrective move. Retest of 139.87 should then be seen next in this case.
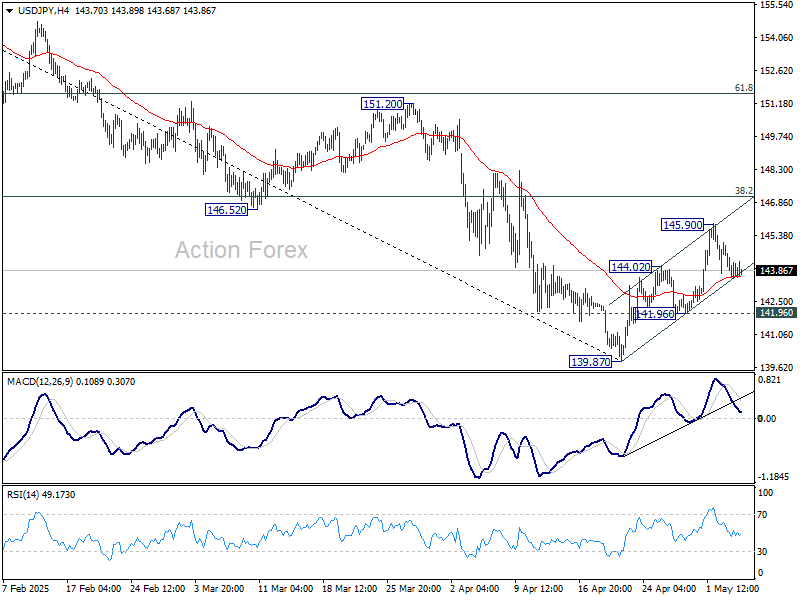
In the bigger picture, price actions from 161.94 are seen as a corrective pattern to rise from 102.58 (2021 low), with fall from 158.86 as the third leg. Strong support should be seen from 38.2% retracement of 102.58 to 161.94 at 139.26 to bring rebound. However, sustained break of 139.26 would open up deeper medium term decline to 61.8% retracement at 125.25.