

Sample Category Title
CFTC Commitments of Traders – Rising Output Might Cap Oil’s Rally
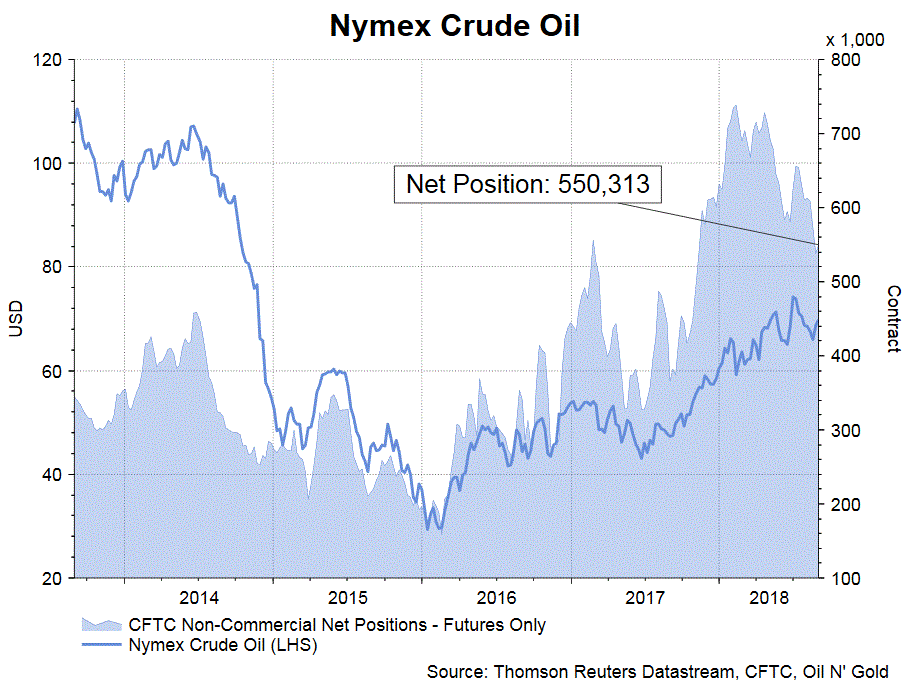
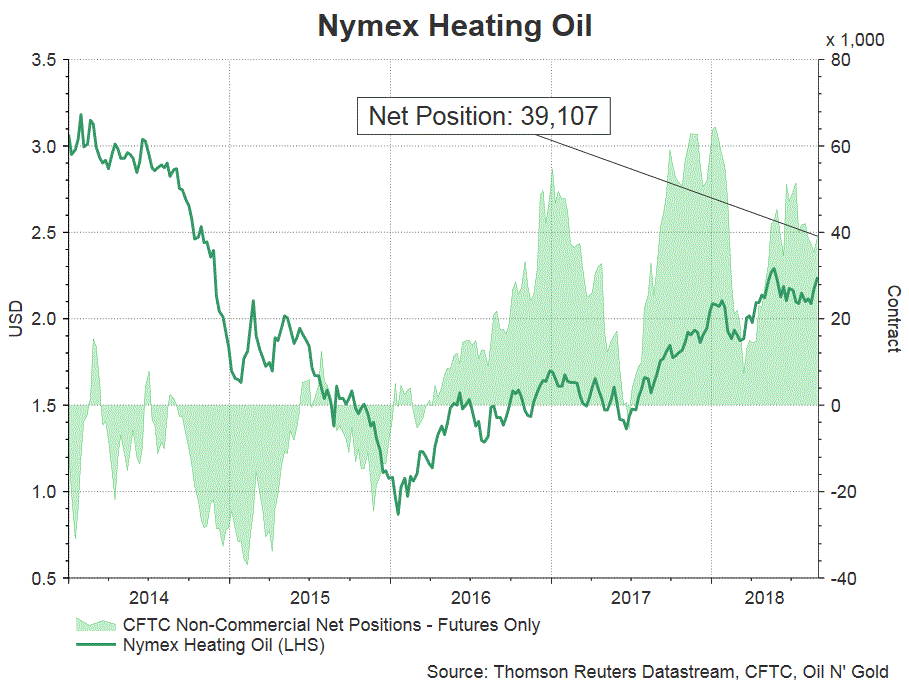
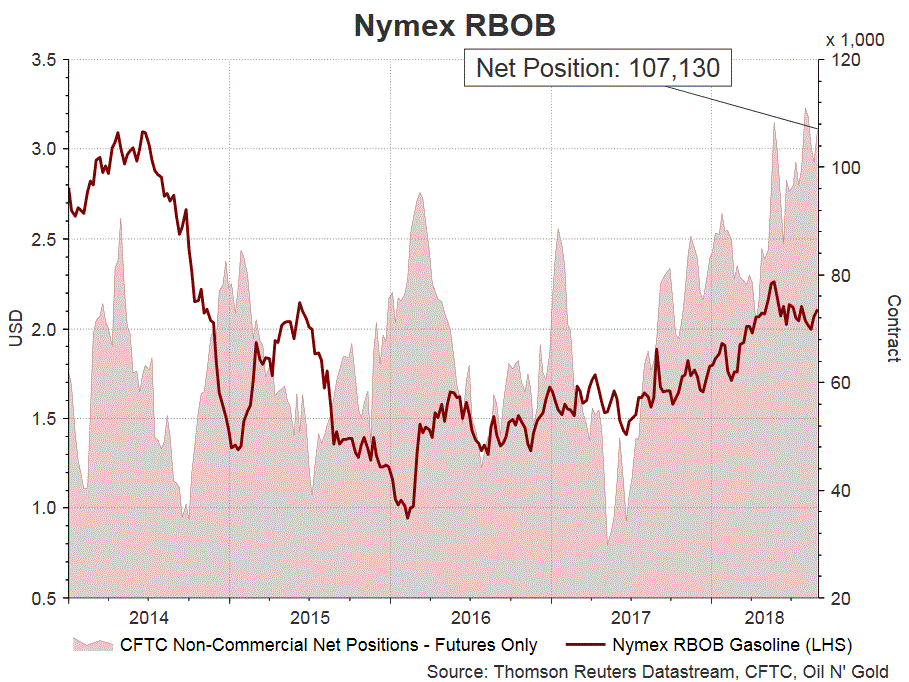
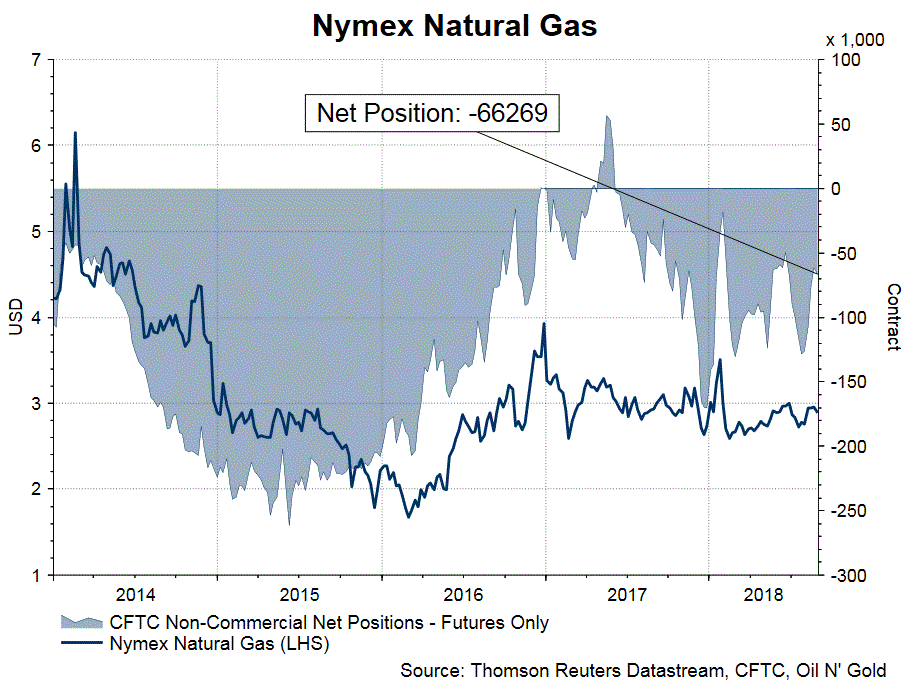
According to the CFTC Commitments of Traders report for the week ended August 28, NET LENGTH for crude oil, heating oil and gasoline futures rose, in tandem with higher prices. Speculative long positions of crude oil futures gained +12 322 contracts, while shorts climbed +794 contracts higher, resulting in an increase in NET LENGTH, by +11 528 contracts, to 550 313 contracts. For refined oil products, Net LENGTH for heating oil futures added +3 797 contracts to 39 107, while that for gasoline gained +3 171 contracts to 107 130. Net SHORT for natural gas climbed higher, by +4 604 contracts, to 66 269 contracts for the week. Oil price's outlook in the coming week is mixed. While US inventory declined more than expected, the number of oil rigs gained for the first time in three weeks. Meanwhile, it's reported that OPEC raised its output, by +0.22M bpd, between July and August, to a 2018-high of 32.79M bpd.
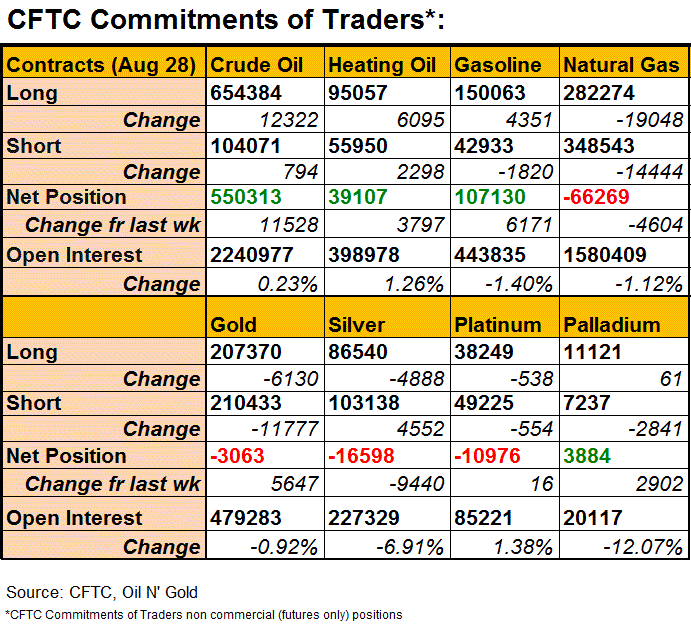
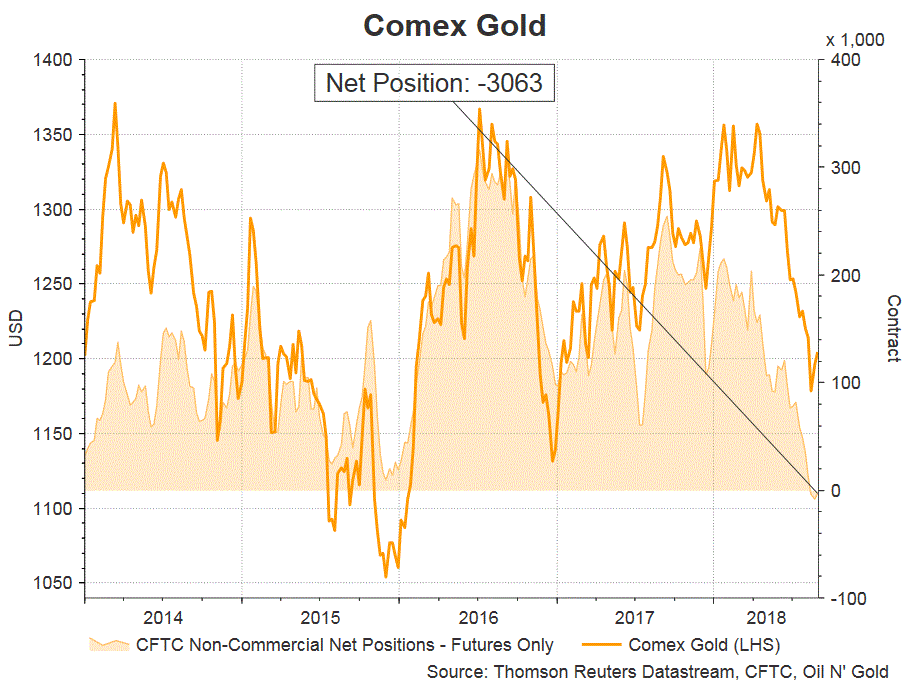
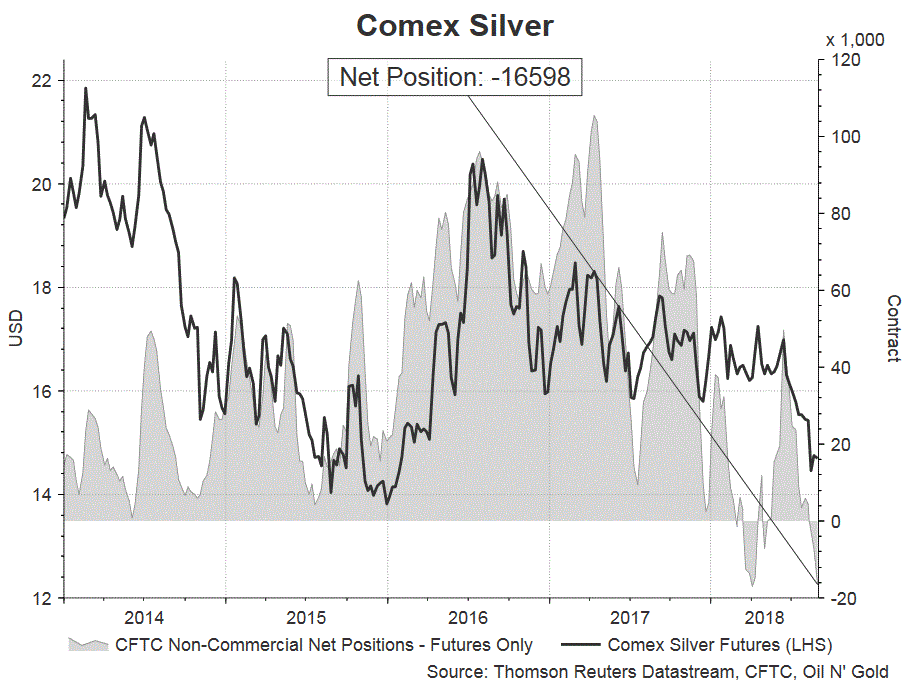
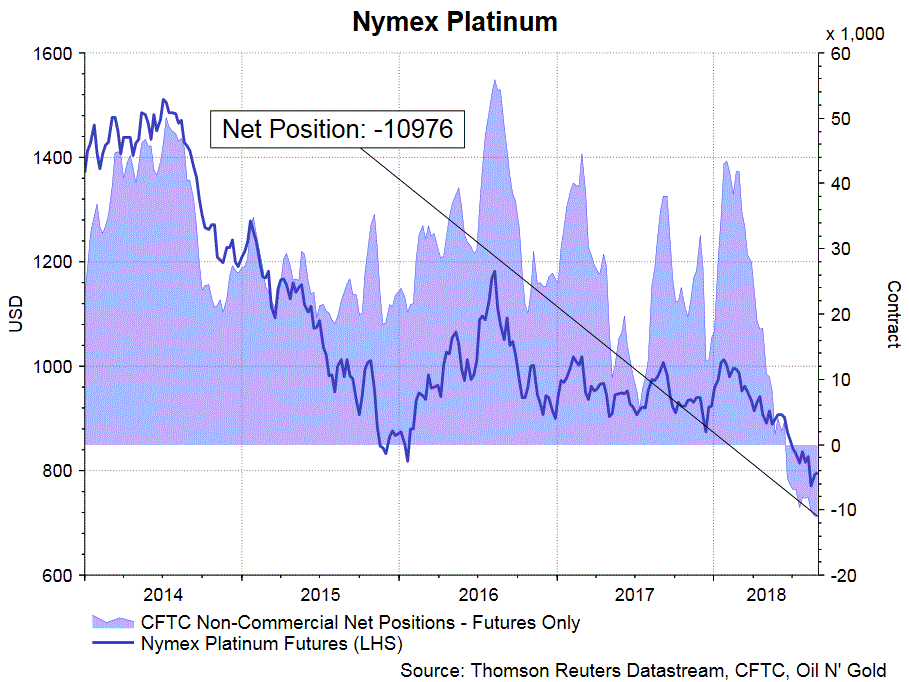
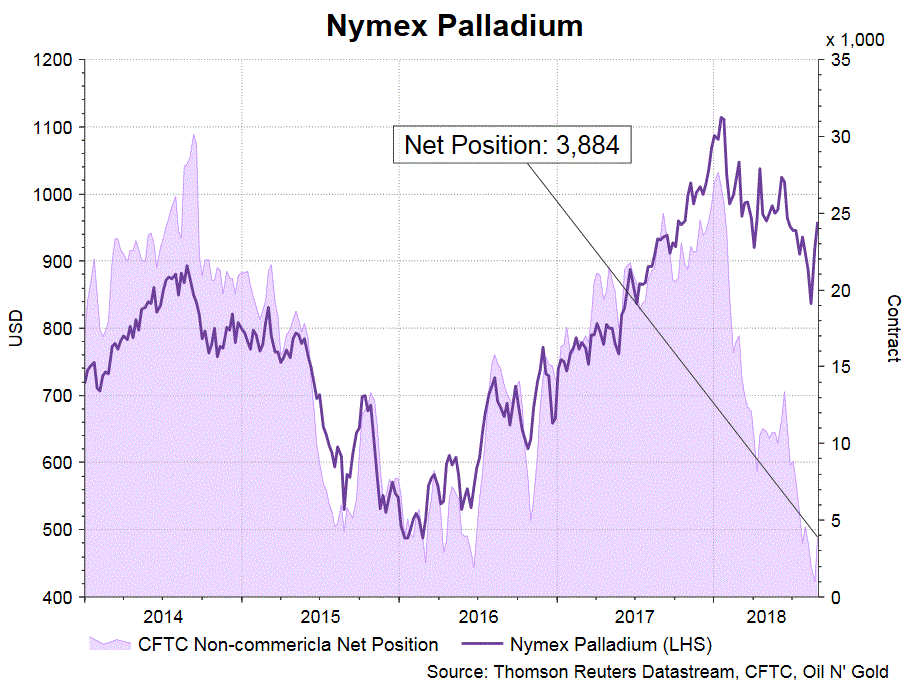
 On the precious metal complex, gold and silver futures stayed in NET SHORTS for a third consecutive week. NET SHORT for for the former dropped -5 647 contracts to 3 063, while that for the latter jumped, by +9 440 contracts, to 16 598. For PGMs, NET SHORT of platinum slid -16 contracts to 10 976 while NET LENGTH for palladium soared +2 902 contracts to 3 884.
Market Morning Briefing: Dollar Index Rose Back From Support Near 94.5-94.7
STOCKS
Equities are mixed. While Dow, Dax and Shanghai looks bearish for the near term, Nikkei and Nifty could possibly see some sideways consolidation if not an immediate fall. We wait for confirmation on Nikkei and Nifty to turn bearish.
Dow (25964.82, -0.085%) is holding well within the channel uptrend on the daily candles. While the trend holds, Dow could come off towards 25500 on the downside before resuming its rise again. Medium term looks bullish and the current correction is expected to be short lived within the overall uptrend.
Dax (12364.06, -1.04%) has fallen sharply. The fall could extend towards immediate daily support at 12200 before trying to move up again. Weekly suggests trade in the 12200-12900 region for the next couple of weeks at least.
Shanghai (2704.28, -0.77%) has come down a bit as expected and could well test 2650 or even lower in the near term. View is bearish while below weekly resistance at 2800.
Nikkei (22772.41, -0.41%) has come off from important resistance levels around 23000 and while that holds, the next 2-3 weeks could well be spent below 23000 with a downside target of 22200. Only a break above 23000, if seen, would trigger bullishness for the near to medium term but such a break on the upside is unexpected and difficult just now. That said, while Nikkei comes off in the near term, our earlier mentioned bullish Shoulder-Head-Shoulder pattern could be negated.
Nifty (11680.50, +0.032%) is in a near term uptrend, 11600 being an immediate support. A break below 11600 if seen could drag it down towards 11400; else a rise from 11600 could take it again to 11800 in the near term.
COMMODITIES
Commodities look bearish for the near term. Crude prices are facing immediate resistances while the precious metals could be sideways to bearish.
Brent (77.35) daily candles show resistance at just above 78 and while that holds, a fall towards 76-75 is possible. Near term looks bearish.
WTI (69.60) has near term resistance at 70-71 levels and if that holds, WTI could see a short corrective fall in the near term towards 68. Else a break above 71, would indicate medium term bullishness towards 74. With Brent looking bearish for the coming sessions, it could possibly drag WTI prices also to lower levels.
Gold (1204.80) is likely to trade in the 1230-1200 region in the near term with a possible extension to 1190 on the downside. At least the next 1-2 weeks looks sideways ranged.
Silver (14.51) has been ranged for the last 10-12 sessions now and could possibly be at the end of this ranged phase. A fall towards 14.25-14.00 looks likely just now which could act as a decent support for the medium term.
Copper (2.6655) came off from 2.75 resistance last week and could continue to move down towards 2.55. We do not see a rise above 2.75 in the near term.
FOREX
Dollar should strengthen against the Euro in this week, while it might stay stable to weak against Yen and Pound. Dollar Rupee could still see levels near 71.20-30. Dips to 70.70 could be bought.
Euro (1.1598): Euro came off from resistance on weekly candles near 1.173 last week and now has immediate support near 1.16 on 3 day line chart. Preference is for 1.16 to be broken and support near 1.155 to be tested in the next couple of sessions, followed by a test of 1.15 later in the week.
Dollar Index (95.19) : Dollar Index rose back from support near 94.5-94.7 on daily candles last week. A breach of 95.5 in the next 1-2 sessions should confirm bullishness towards 96-97 in the next couple of weeks.
Dollar Yen (110.92): Dollar Yen has crucial support near 110.5-110.25 and lower down, near 110.0-109.5, which it could test in this week. Only on a break below 109.5 will we abandon the view of bullishness towards 113 in the next couple of weeks.
Euro Yen (128.65): Euro Yen has broken below support on daily candles and looks bearish towards lower support near 127.5-127.0 in this week. A test of levels near 1.155 by Euro-Dollar and 110 by Dollar Yen in the next 2-3 sessions implies a target near 127 for Euro Yen.
Pound (1.2926): While above 1.29, Pound could test a high near 1.31 this week (resistance on daily candles). Preference is for 1.31 to then produce a dip.
Dollar Rupee (70.995):
Cannot rule out 71.20-30 yet, while above 70.50. Dips to 70.70, if seen, might be worth considering as a "Buy". Break below 70.50, if seen, changes the picture dramatically and suggests a top is in place.
INTEREST RATES
USA and Canada couldnt reach a trade deal by the Friday deadline thereby dampening sentiments slightly. Moreover, there are murmurs that the US could impose trade sanctions worth $200 bn on China sometime this week itself. If that happens, it could be an extremely significant event -the impact on yields should most certainly be bearish, due to an enhancement of the 'risk off' sentiment.
We have been saying that chances of a Dec '18 rate hike have slightly reduced over the past couple of weeks - this could imply that the May high of 3.125% for the US 10 year yield was the year's top.
US 10 Year Yield (2.86%) : A breach above 2.9% would be required to negate the possibility of a downmove below 2.82% in this move. Current preference remains bearish for the near term.
German 10 Year Bond Yield (0.33%) has dipped from resistance near 0.4% and could move further lower towards 0.3%.
Japan 10 year bond yield (0.12%) has important resistance near 0.13%-0.14% which if breached, would be a very important event and could lead to further bullishness in Japanese yields.
Can Trump Strike A Deal With Canada?
- US could be pulling out of the WTO and NAFTA's trade
- European markets to remain flat
Donald Trump, president of the United States of America, reminded the world again with his new threat that there is no need for North American Free Trade Agreement NAFTA. Last week, Trump failed to form any kind of deal with Canada. Just for record, investors were very optimistic that Trump is going to get things done his way after a trade deal with Mexico. He named it is as American- Mexico trade agreement. However, Wall Street still closed relatively strong enough. The most intriguing aspect is that despite these serious and grave concerns about the trade agreement (which can trigger a global recession without any doubt), for some reason investors still hold fairly handsome appetite for risk.
To put things in perspective, the month of August has been full with headlines about trade war, but if you look at the performance of the US market, the equity markets celebrated the best August going back all the way to 2014. As for the NASDAQ index, who ever said that FANG stocks have valuation problems, they need to see the performance of the index, the best monthly gain since 2000- a headline worth paying attention to.
We are living in a new era, the president of the United States is making comments/tweets like a spoil child in a candy shop. His recent remarks about Canada was "it's going to be so insulting they're not going to be able to make a deal".
Your text book trade is not working, US could be pulling out of the WTO and NAFTA's trade agreement has limited days and the US equity markets are roaring. It seems like that there is only one way for the equity market- upside and more upside- at least for now. Greed is written all over this and it may lead us to the bubble of all time. The consequence of this could be so devastating that for years people will talk about it.
We are expecting the European markets to remain flat as traders may not show the same kind of enthusiasm as we have seen over on Wall Street on Friday. Investors are likely to keep their fingers on the news as the US and Canada will start their trade talks on Wednesday. This particular event would be the biggest event for this and even to some extent, this event could even influence the US-NFP report.
EUR/USD Could Correct Lower Towards 1.1550
Key Highlights
- The Euro traded above the 1.1700 level before facing resistance near 1.1730 against the US Dollar.
- There was a break below a connecting bullish trend line with support at 1.1645 on the 4-hour chart of EUR/USD.
- The Euro Area CPI in August 2018 (Prelim) increased 2% (YoY), less than the 2.1% forecast.
- The Euro Zone Manufacturing PMI for August 2018 will be released today, which is forecasted to remain at 54.6.
EURUSD Technical Analysis
The Euro made a nice upward move this past week and traded above the 1.1640 and 1.1700 resistances against the US Dollar. The EUR/USD pair traded as high as 1.1733 and later started a downside correction.
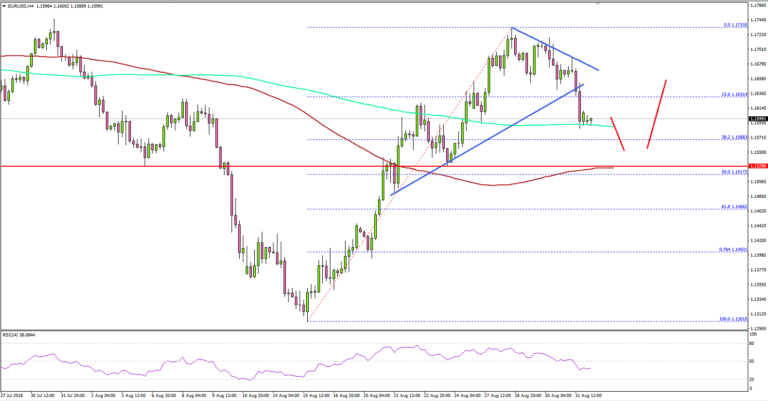
Looking at the 4-hours chart, the pair declined below the 1.1700 support level to move into a short-term bearish zone. It even broke the 23.6% Fib retracement level of the last move from the 1.1301 low to 1.1733 high.
More importantly, there was a break below a connecting bullish trend line with support at 1.1645 on the same chart. The next support on the downside is near the 1.1550 level.
However, it seems like the pair could test the 1.1517 level, which is the 50% Fib retracement level of the last move from the 1.1301 low to 1.1733 high. The 100 simple moving average (red, 4-hours) is also positioned near the 1.1520 level.
Therefore, if the pair continues to move down, it could find support near 1.1515-1.1520. On the upside, the pair may struggle to break the 1.1650 and 1.1680 levels (the previous supports).
Fundamentally, the Euro Area CPI report for August 2018 (Prelim) was released by the Eurostat. The market was looking for a rise of 2.1% in the CPI in August 2018 compared with the same month a year ago.
The actual result below the market forecast as the CPI posted 2.0%. Moreover, the Core CPI increased 1.0%, whereas the market was looking for a 1.1% rise.
The report added that:
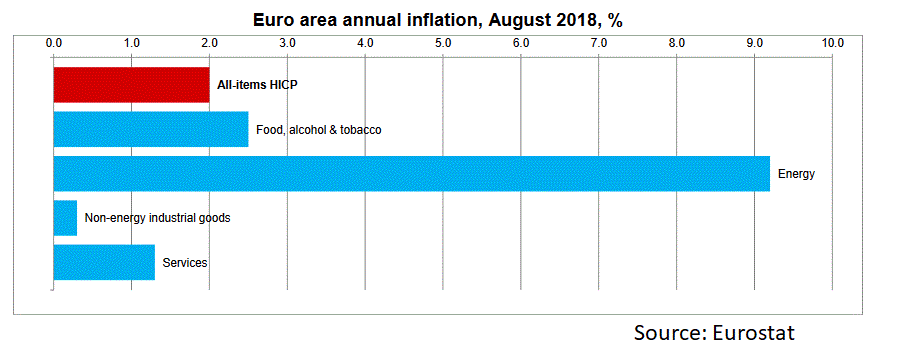
Looking at the main components of euro area inflation, energy is expected to have the highest annual rate in August (9.2%, compared with 9.5% in July), followed by food, alcohol & tobacco (2.5%, stable compared with July), services (1.3%, compared with 1.4% in July) and non-energy industrial goods (0.3%, compared with 0.5% in July).
Overall, the Euro may continue to move down in the short term towards the 1.1550 or 1.1520 support level.
Economic Releases to Watch Today
- Germany’s Manufacturing PMI for August 2018 – Forecast 56.1, versus 56.1 previous.
- Spanish Manufacturing PMI for August 2018 – Forecast 52.5, versus 52.9 previous.
- Euro Zone Manufacturing PMI August 2018 – Forecast 54.6, versus 54.6 previous.
- UK Manufacturing PMI for August 2018 – Forecast 53.8, versus 54.0 previous.
GOLD – Remains Vulnerable On Further Bear Pressure
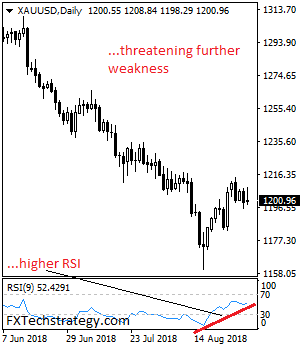
GOLD - The commodity looks to weaken further in the new week despite its price hesitation on Friday. On the downside, support comes in at the 1,190.00 level where a break will turn attention to the 1,180.00 level. Further down, a cut through here will open the door for a move lower towards the 1,170.00 level. Below here if seen could trigger further downside pressure targeting the 1,160.00 level. Conversely, resistance resides at the 1,210.00 level where a break will aim at the 1,220.00 level. A turn above there will expose the 1,230.00 level. Further out, resistance stands at the 1,240.00 level. All in all, GOLD looks to weaken further lower in the new week
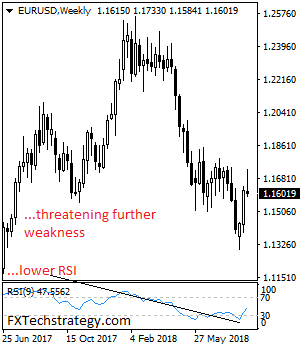
EURUSD – Loses Upside Momentum, Faces Pullback Risk With Eyes On 1.1534 Zone
EURUSD - The pair looks to pullback in the new week after turning lower the past week. On the upside, resistance comes in at 1.1650 level with a break through there opening the door for more upside towards the 1.1700 level. Further up, resistance lies at the 1.1750 level where a break will expose the 1.1800 level. Conversely, support lies at the 1.1550 level where a violation will aim at the 1.1500 level. A break of here will aim at the 1.1450 level. Below here will open the door for more weakness towards the 1.1400. All in all, EURUSD faces further downside pressure
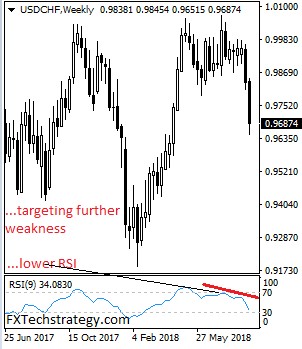
USDCHF – Risk Continues To Point Lower, Eyes 1.9600 Region
USDCHF - The With the pair selling off the past week, more weakness is envisaged in the new week. On the downside, support lies at the 0.9650 level. A turn below here will open the door for more weakness towards the 0.9600 level and then the 0.9550 level. On the upside, resistance resides at the 0.9700 level where a break will clear the way for more strength to occur towards the 0.9750 level. Further out, resistance comes in at the 0.9800 level. Above here if seen will turn attention to 0.9850. All in all, USDCHF faces further downside threats on bear pressure
Eco Data 9/3/18
[php_everywhere instance="1"]
Finding Great Entries With Fibonacci Analysis
Ancient Maths For Modern Markets
Fibonacci analysis is a classic staple among chart technicians and is used by traders of all levels from all over the world; from successful independent traders right through to automated systems traders. This form of analysis often used by investment banks in their technical research notes and is among the simplest and most effective forms of analysis that traders can master.
Fibonacci analysis is essentially based on using the ratios which underpin the famous Fibonacci number sequence to identify key price levels in the markets. The most widely used forms of analysis are Fibonacci retracement and Fibonacci extensions.
Fibonacci Retracement
The Fibonacci retracement is an extremely well-used tool for helping traders identify levels of support and resistance. The tool comes as standard on the MT4 platform and helps traders measure a swing in price and identify key levels within that price swing which might serve as turning points if retested.
The key Fibonacci levels are:
23.6%, 38.2%, 50%, 61.8%, 78.6% and the 100%.
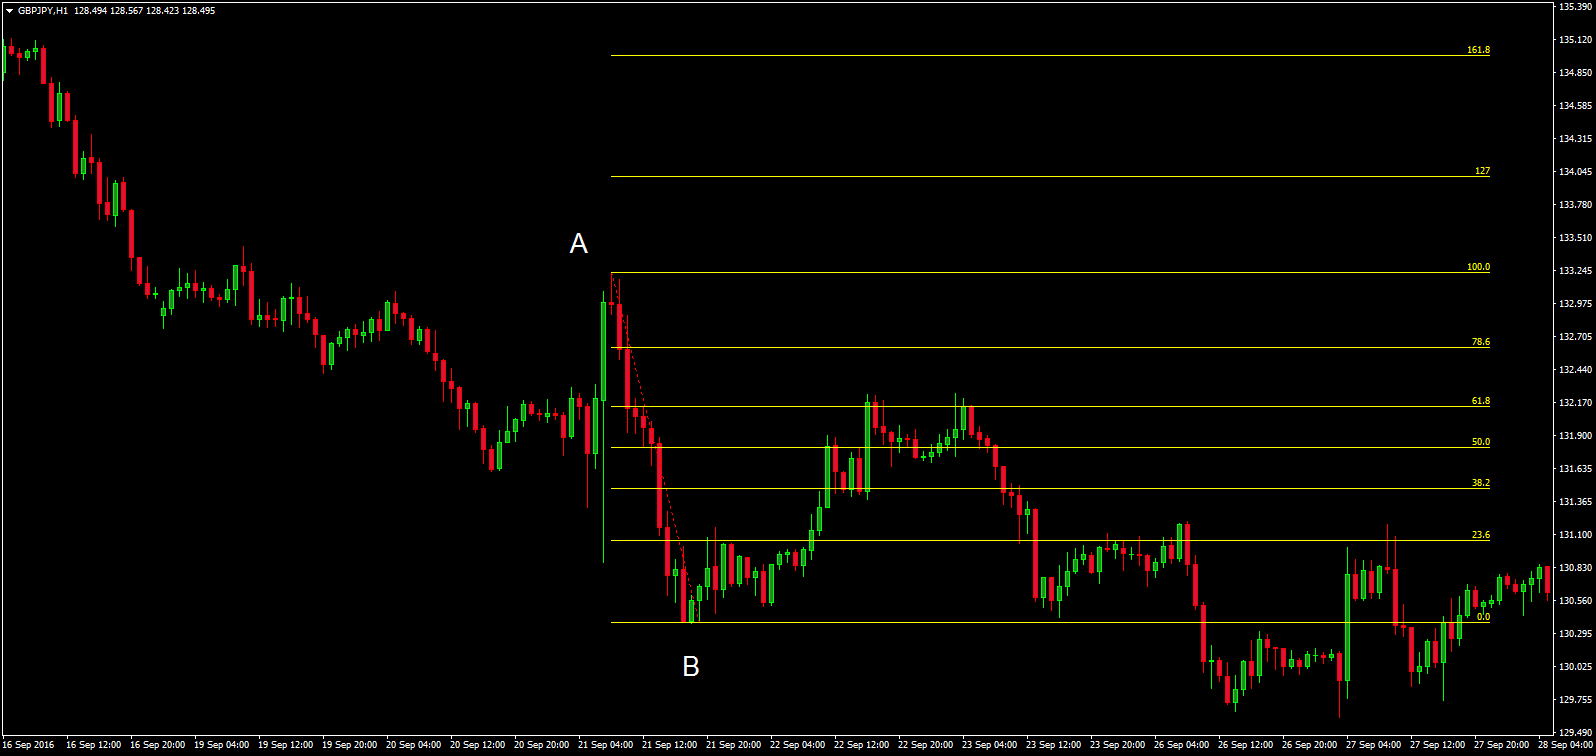
In the image above you can see that we have applied our Fibonacci retracement tool to a bearish price swing. Price sold off from point A to point B. Once price started to bounce from point B, we would apply our Fibonacci retracement tool measuring from the top of the swing to the bottom (and vice versa for a bullish move). The tool then plots on our key Fibonacci levels to monitor. As you can see price initially reversed from the 50% before travelling higher to test the 61.8% level which ultimately sends price lower.
This is a clear example of the basic way we can look to use Fibonacci retracement to identify trading opportunities. This can be particularly helpful in trending market helping us to enter as the market corrects, allowing us to get in as the trend then resumes.
Quick Tip:
The Fibonacci retracement tool highlights the key levels for us to monitor but we don’t know which, if any, will work. Traders should look to identify confluence between key Fibonacci levels and other technical elements such as price action signals, support & resistance, trend lines or indicator readings to build a proper trade idea.
Establishing Confluence
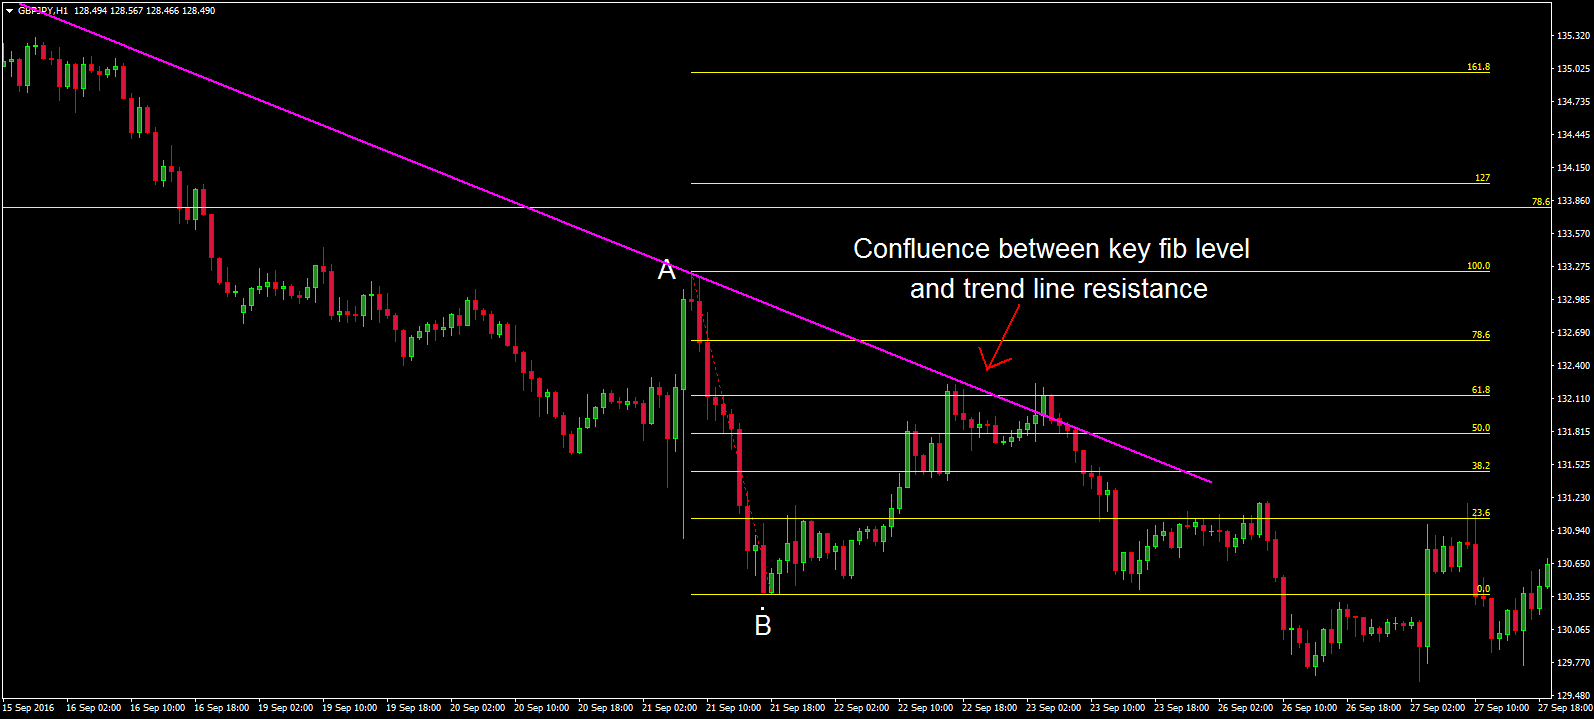
Looking at the example again you can see that we actually have confluence at the 61.8% Fibonacci level with trend line resistance coming in at that level also. This suggests that this would be the strongest level to look to trade.
The Fibonacci Extension
The Fibonacci extension is another classic analysis tool. This time, we measure the price swing but instead of looking for levels within the move which may serve as turning points if retested, we are looking at projected levels which are yet to be tested but could serve as turning points if they are.
The key Fibonacci extension levels are
127%, 161.8% 200%
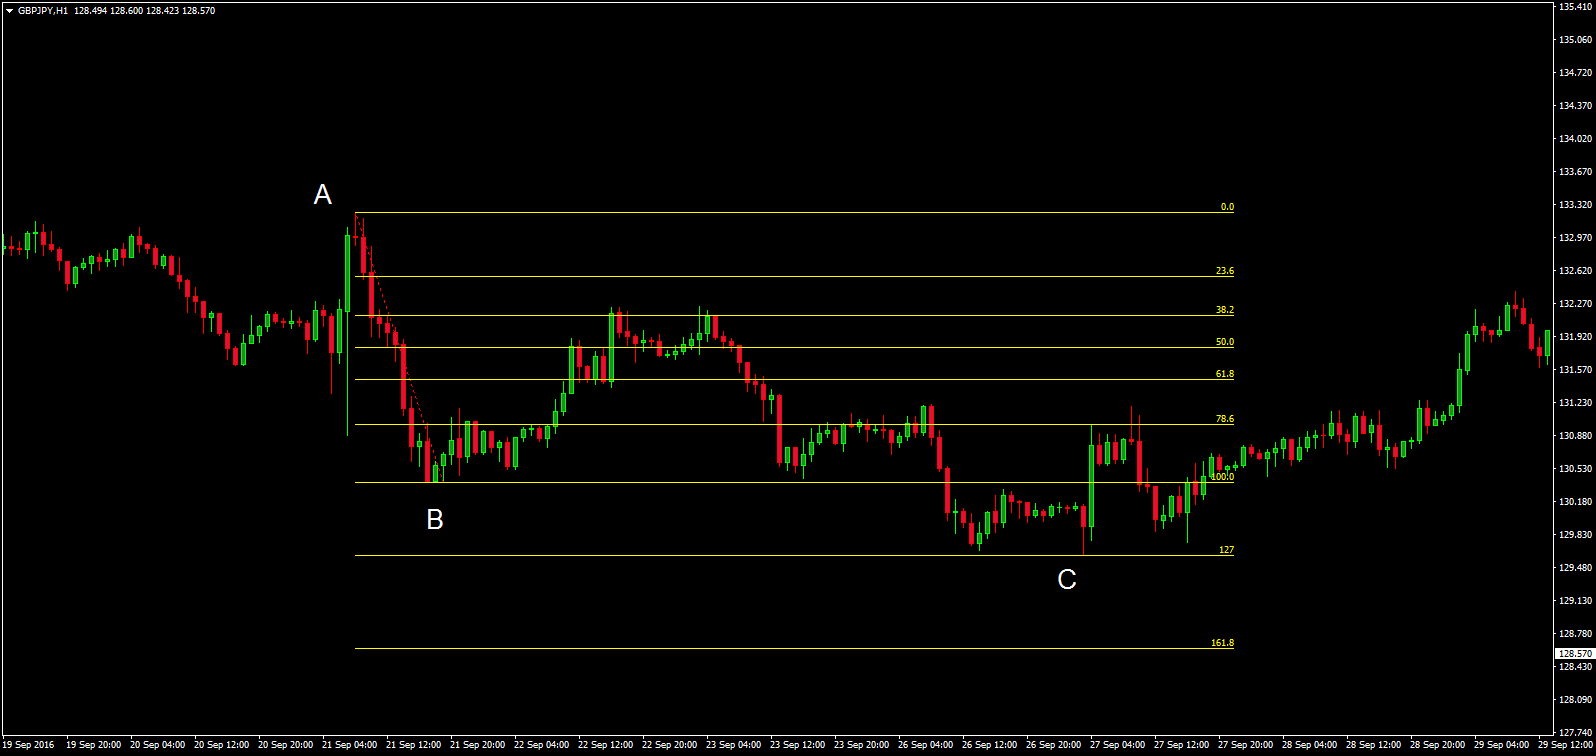
In the example, above you can see that we measure our bearish price swing from top to bottom (vice versa for bullish move) and this time the tool plots levels below the low of the swing point. At point C you can see what happens when price meets the 127% extension, it reverses and trades higher.
Again as with the retracement tool, we can look to identify confluence at key Fibonacci levels to help us identify the stronger levels to look to trade. Whereas we might look to use the Fibonacci retracement tool to help us identify points of correction in a trending market, the extension tool can be useful for identifying potential trend reversal zones and can also be used as a tool for setting profit targets whereby traders look to Bank any open trades as they test the key extension levels.
Summary
As you can see, Fibonacci levels can offer us powerful entry points to key moves. The tools are simple to use and once you are confident in tracking the right price swings you should be able to identify good reversals. The beauty of this method of technical analysis is that it really compliments other forms such as support & resistance, indicator trading, price action trading and is a versatile way to approach the markets.
Using a Multi-Timeframe Approach
'It pays to know where you are in the bigger picture'.
We’re not entirely sure where this statement originated from, but it is certainly one that should be memorized.
What is a multi-timeframe approach?
It’s no secret that adopting a multi-timeframe approach can enhance your trading. The problem, however, is that some traders find it difficult to determine which timeframes to select, as well as how to go about using the method to its fullest. Hopefully, the following article will help clear this up.
Explaining what a multi-timeframe approach is may be best done using an analogy. Imagine driving down a poorly lit road in the evening with faulty headlights. Odds are that you’re likely to experience a bump, or worse, an accident, as it’s impossible to see what’s ahead! Well, this is exactly what you’re doing should you focus your attention on just one timeframe. Not knowing if you’re buying into a higher-timeframe resistance or trading against the overall trend, makes tackling the markets all that more difficult. As such, a multi-timeframe approach provides a way of observing the entire market you’re trading using additional timeframes.
What timeframes should you track?
Here’s where a lot of traders struggle to find their feet.
What timeframes one follows will depend on what the trading approach is. For example, are you an investor with long-term convictions, a swing trader that holds trades for a few days/weeks, or do you favour the intraday charts?
For the sake of this article, let’s say that you’re a trader that does not have much time to be at the computer and has adopted a swing trading method. You chose the H4 chart as your base timeframe. A base timeframe is simply one that you will enter trades from. Think of this timeframe as your go-to chart.
Once you have this in place, the next step is to select your partner timeframes. We usually appoint two additional higher timeframes to complement the base. Therefore, a good fit for a H4 base might be the daily timeframe and the weekly, or even monthly, timeframe.
It is said that a top-down approach is an objective way to analyse the markets, as you’re starting with a broader view and working your way down. While we agree with this statement, we don’t see much difference between beginning from the base and working up or starting from the top and working down. You end up with the same picture, regardless.
To conclude this section, here is a guide we follow when using a multi-timeframe approach. Granted, it may be simple, but it has held us in good stead thus far:
Long-term:
- Base timeframe: Daily chart.
- Initial timeframe: Weekly chart.
- Final timeframe: Monthly or the quarterly chart.
Swing trade:
- Base timeframe: H4 chart.
- Initial timeframe: Daily chart.
- Final timeframe: Weekly or monthly chart.
Intraday:
- Base timeframe: M15 chart.
- Initial timeframe: H1 chart.
- Final timeframe: H4 chart.
Setting up a trade
We are currently watching a trade that demonstrates why utilizing a multi-timeframe approach is so advantageous.
A lot of traders use the additional timeframes to gauge trend direction. Though this is certainly something we look at, there is much more one can harvest from this approach.
Comprised of a H4, daily and weekly timeframe, here is a quick snapshot of the AUD/USD chart:
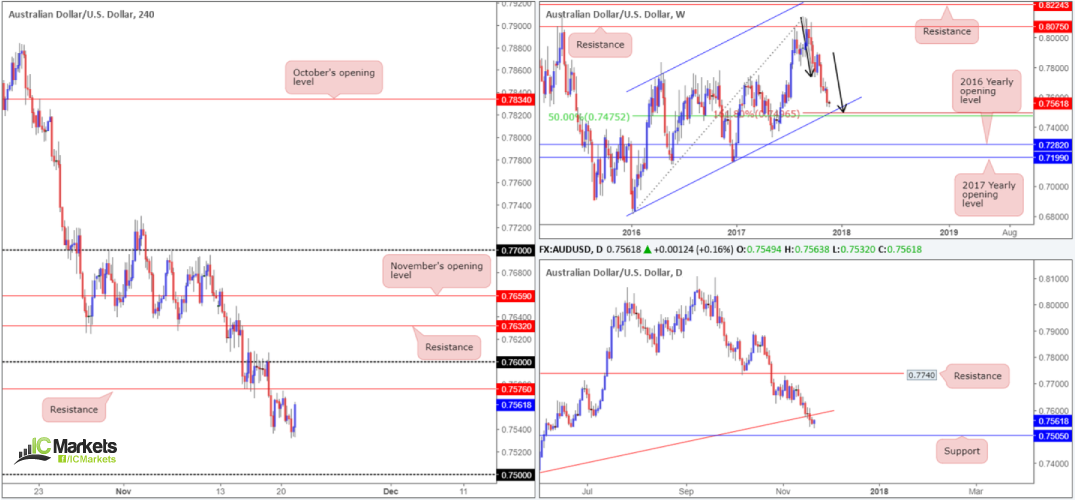
Let’s start from the top and work our way down. On the weekly timeframe, we can see that there is an AB=CD 161.8% Fib ext. at 0.7496 that aligns with a 50.0% value at 0.7475 (taken from the high 0.8125). By and of itself, this is an attractive structure! In conjunction with weekly price, however, daily price shows little active demand to the left of current price, suggesting that a move down to support at 0.7505 may be on the cards. So, at this point, not only do you have strong weekly structure around the 0.75 neighbourhood; you also have a daily support as well. Things are looking good so far! Moving across to the H4 timeframe, the unit is seen trading beneath resistance at 0.7576. Also notable is the 0.75 handle seen below.
From this analysis, it should be clear that 0.75 represents a solid base to buy from. Yet, without bringing in the additional timeframes, 0.75 would have likely been just another psychological base to keep an eyeball on. With a multi-timeframe approach we’re able to see the true value 0.75 offers.
Given the recent move higher on the H4 scale, one could also surmise that the aforementioned H4 resistance is a worthy sell zone. We say this because both the weekly and daily timeframes show room for the market to move as low as 0.75. Nevertheless, the H4 resistance, at least for us, would require additional confirmation before pulling the trigger, whereas the 0.75 handle, depending on the time of day, would be good enough for a pending order.
What about an exit plan? Well, we personally try to keep it as simple as possible. We follow our base timeframe for partial exits and look to liquidate the full position at an opposing higher-timeframe zone. This typically allows one to maximise gains.
In closing
Adopting a multi-timeframe approach is, by far, a crucial aspect in our trading methodology. The thought of not being able to see where we’re trading from or what we’re trading into is not a position we would ever want to put ourselves in, so why should you?