Sample Category Title
EUR/GBP Weekly Outlook
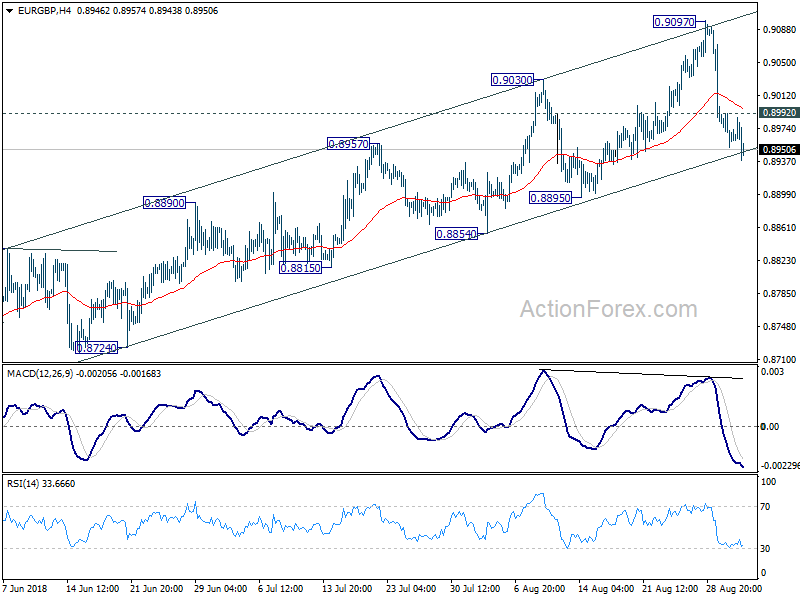
EUR/GBP edged higher to 0.9097 last week but reversed and dropped sharply since then. For now, the cross is still held in near term rising channel and thus there is no indication of reversal yet. On the upside, above 0.8992 minor resistance will turn bias back to the upside for retesting 0.9097 first. However, sustained break of channel support, followed by break of 0.8895, will argue that whole rise from 0.8620 has completed. And consider that it's not clearly impulsive in structure, break of 0.8895 will also suggest reversal and turn outlook bearish.
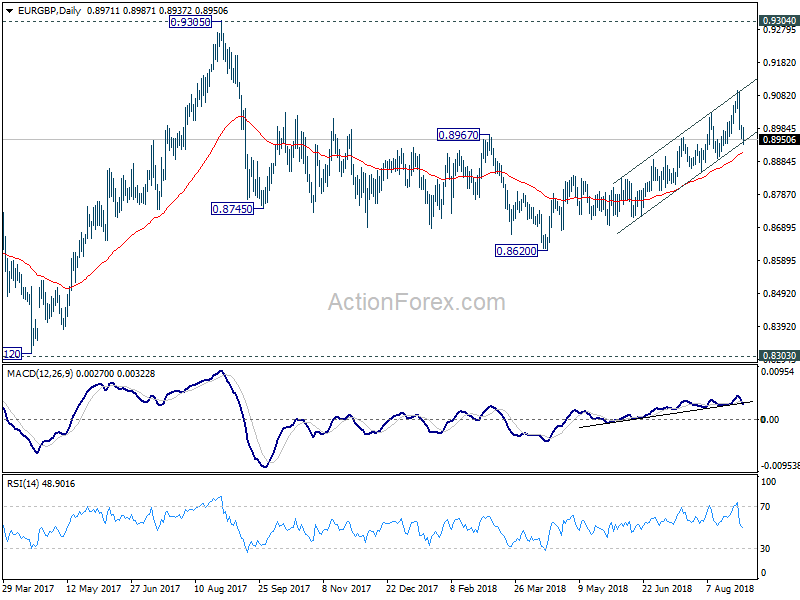
In the bigger picture, EUR/GBP is staying in long term range pattern from 0.9304 (2016 high). The corrective structure of the fall from 0.9305 to 0.8620 is raising the chance that rise from 0.8312 to 0.9305 is an impulsive move. But we're not too confident on it yet. In any case, we'd stay cautious on strong resistance from 0.9304/5 to limit upside in case of further rally. Meanwhile, if there is another medium term decline, strong support will likely be seen from 0.8303 to contain downside.
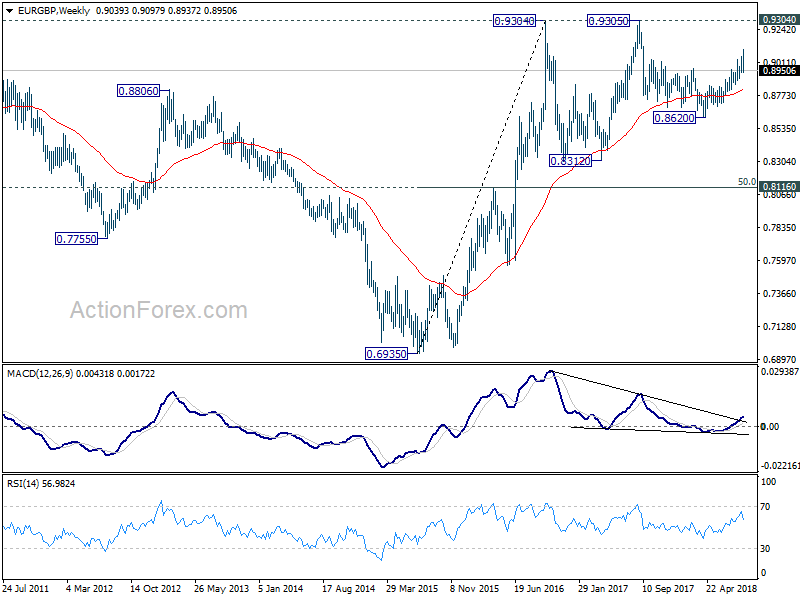
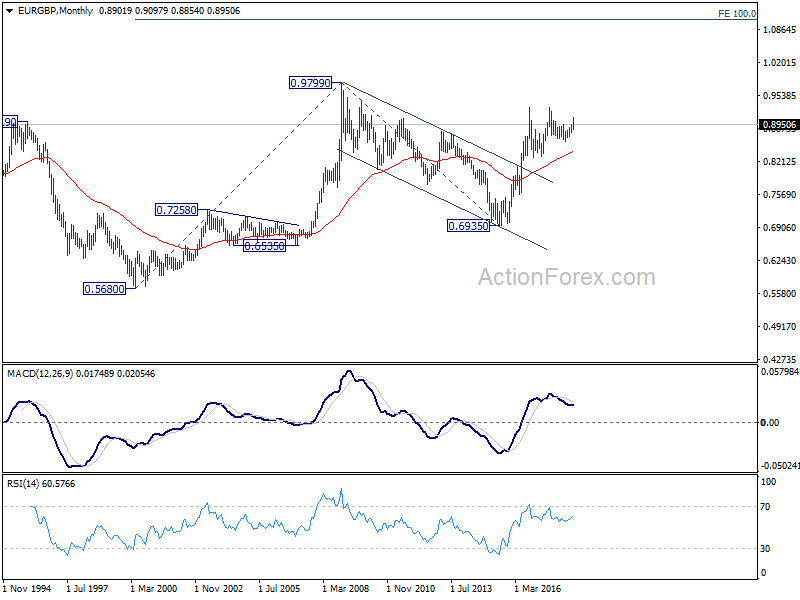
In the long term picture, we're holding on to the view that rise from 0.6935 (2015 low) is resuming the up trend from 0.5680 (2000 low). Hence, after the consolidation from 0.9304 completes, we'd expect another medium term up trend through 0.9799 to 100% projection of 0.5680 to 0.9799 from 0.6935 at 1.1054.
EUR/AUD Weekly Outlook
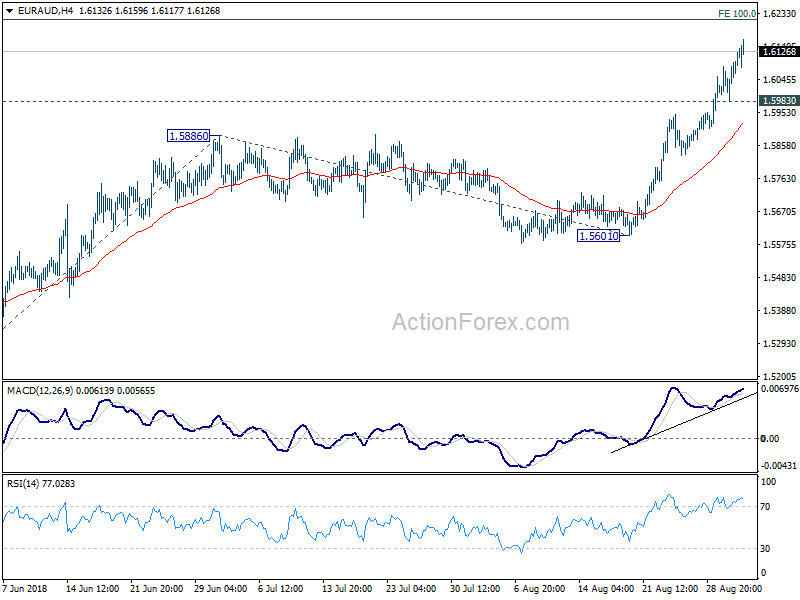
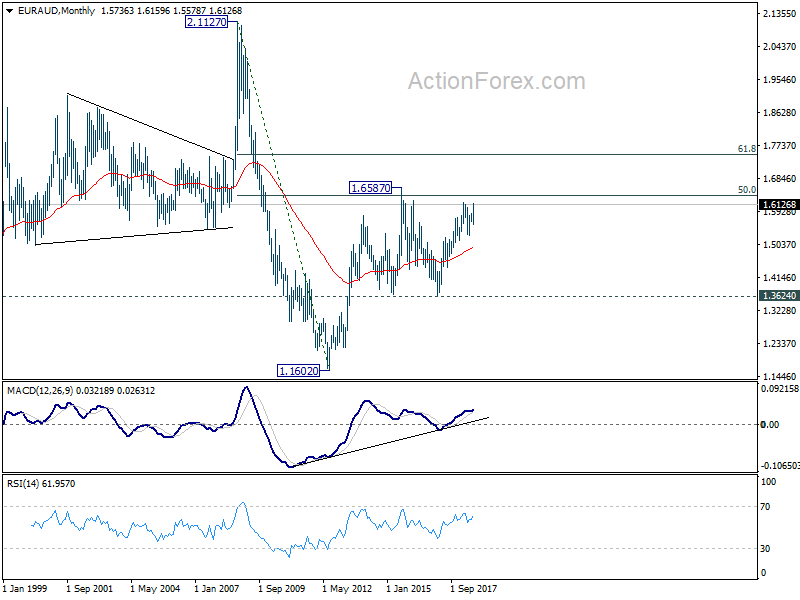
EUR/AUD's rally extended last week and reached as high as 1.6159. Initial bias remains on the upside this week for 100% projection of 1.5271 to 1.5886 from 1.5601 at 1.6216, which is close to 1.6189 high. Upside could be limited there on initial attempt to bring consolidation. But break of 1.5983 support is needed to indicate short term topping. Otherwise, further rise will remain in favor in case of retreat. Meanwhile, firm break of 1.6216 will pave the way to 161.8% projection at 1.6596, which is close to another key resistance level at 1.6587.
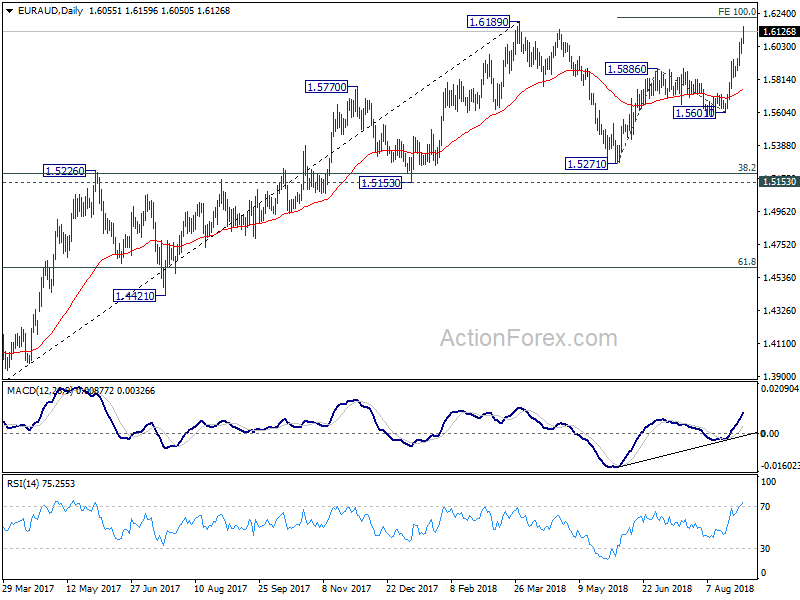
In the bigger picture, EUR/AUD drew strong support from 55 week EMA and rebounded. And the development argues that medium term rally from 1.3624 (2017 low) is still in progress. Firm break of 1.6189 will target a test on 1.6587 (2015 high). On the downside, break of 1.5601 support will now be the first sign of medium term reversal, and will bring a test on 1.5271 key support for confirmation.
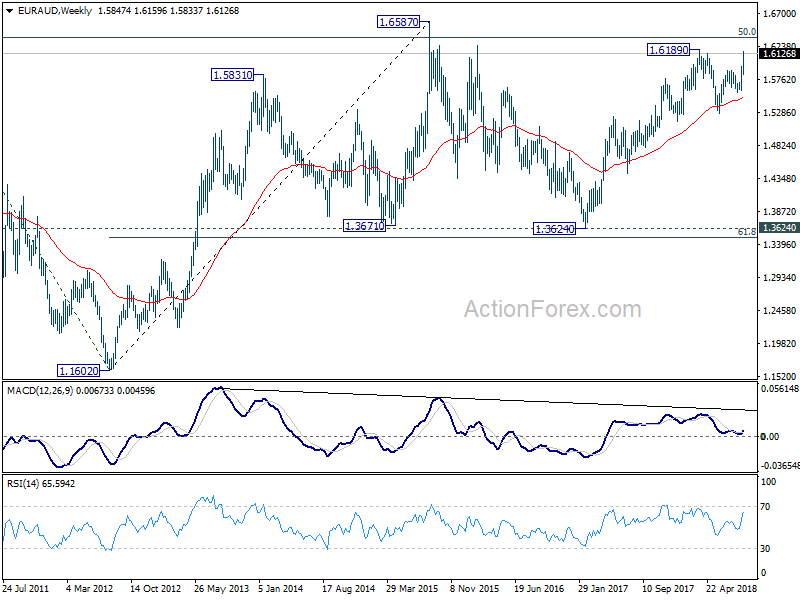
In the longer term picture, the rise from 1.1602 long term bottom (2012 low) isn't over yet. We'll keep monitoring the development but there is prospect of extending the rise to 61.8% retracement of 2.1127 to 1.1602 at 1.7488 and above. However, sustained trading below 1.3624 key support should indicate long term reversal and target 1.1602 long term bottom again.
EUR/CHF Weekly Outlook
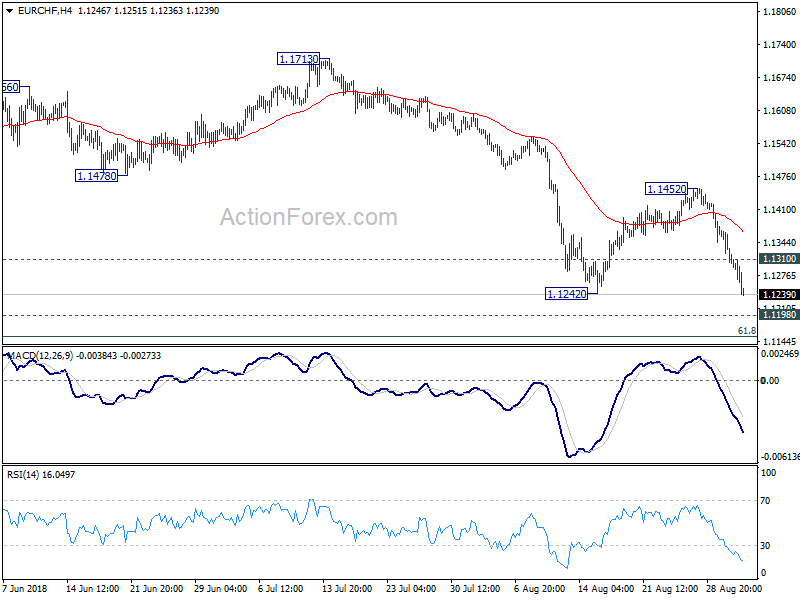
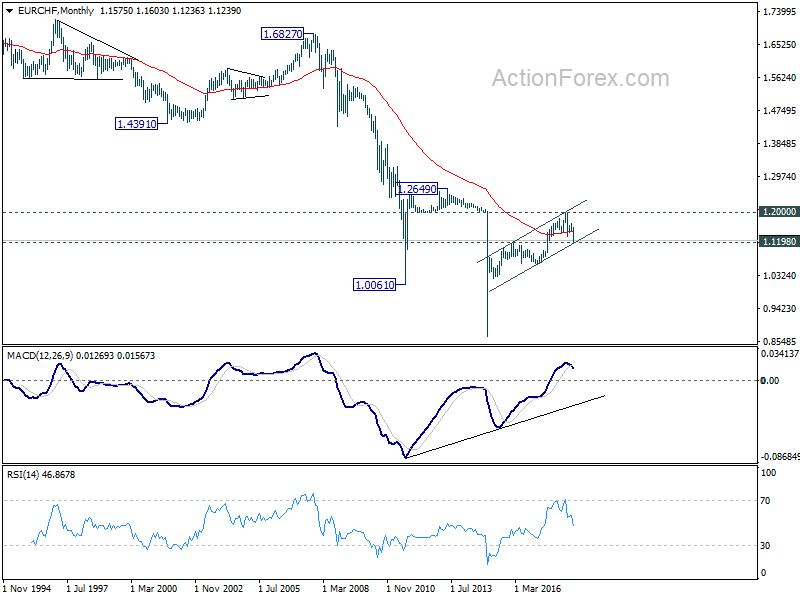
EUR/CHF's sharp decline last week and breach of 1.1242 low indicates resumption of larger down trend from 1.2004. Initial bias stays on the downside this week for key support zone at 1.1154/98. At this point, we'd still expect strong support from there to bring rebound. On the upside, above 1.1310 minor resistance will turn bias back to the upside for 1.1452 resistance. However, sustained break of 1.1154/98 will carry larger bearish implications.
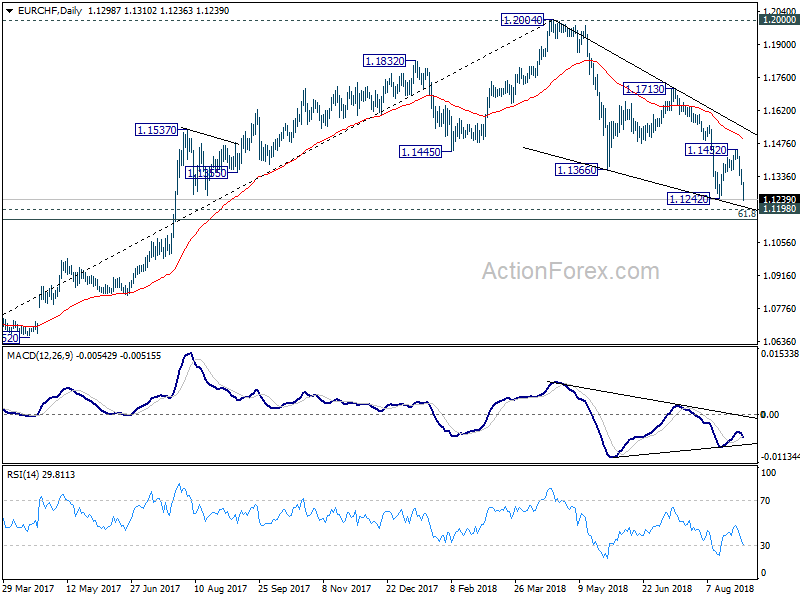
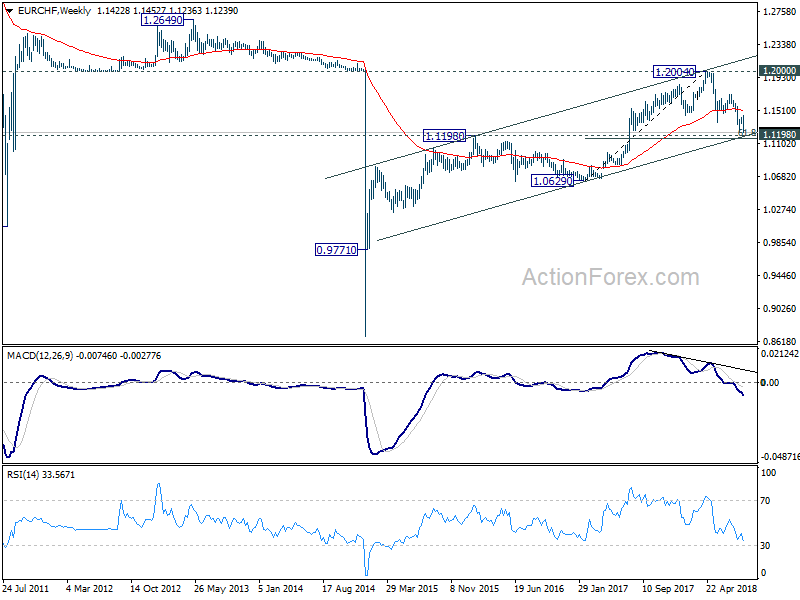
In the bigger picture, for now, the price actions from 1.2004 medium term top is seen as a correction only. Downside should be contained by support zone of 1.1198 (2016 high) and 61.8% retracement of 1.0629 to 1.2004 at 1.1154 to complete it and bring rebound. This cluster level is in proximity to long term channel support (now at 1.1173) too. A break of 1.2 key resistance is still expected in the medium term long term. However, sustained break of the mentioned support zone will mark reversal of the long term trend. In that case, 1.0629 key support will be back into focus.
US Trade War Again Dominated, But Everyone Has Their Own Stories
The last week of August was unusually volatile and eventful. It's a week to remember yet it's hard to remember all the details. Almost every major currency got its own stories. Swiss Franc and Japanese Yen ended as the first and third strongest ones on risk aversions. And apparently, there were more problems in Europe than in Asia. Sterling was the second strongest with the help of friendly comments from EU on post Brexit relationship. On the other hand, commodity currencies were the weakest ones with Australian and New Zealand Dollar that led the way down. Euro was the third weakest, followed by Canadian Dollar. Even though a the most substantial risks of the world economy, trade war, started from the US, Dollar was mixed while US stocks made new record highs.
Trump's trade war with Canada, EU and China
To start with, Dollar has benefited from Trump's hostile trade rhetorics every time this year. Last week, the US and Mexico bypassed Canada and struck a bilateral trade deal. Canadian Foreign Minister Chrystia Freeland cut short her European trip and flew to the US on Tuesday to start a whole week of intensive session. Yet, no result was achieved ahead of Trump's forcefully imposed deadline of Friday, and demanded that any deal would be "totally on our terms".
Later in the week, Trump criticized that EU is "almost as bad as China" on trade, "just smaller". Even though EU offered to drop all tariffs on autos if US does the same, Trump said that's "not good enough". He even went further to criticize EU citizen's own choices and added that "Their consumer habits are to buy their cars, not to buy our cars." That's seen as dishonoring the "ceasefire agreement" with EU that drew strong reactions. European Commission President Jean-Claude Juncker warned that EU won't let others dictate its own trade policies. And, if Trump violates the deal impose auto tariffs, the EU will "also do that". The EU's offer was clearly a step in the right direction in bringing down tariffs of the world and Trump's rejection on it clearly showed his dishonest claims.
Also, it's reported that Trump is ready to start imposing 25% tariffs on USD 200B in Chinese imports, as soon as public hearing ends this week. Chinese's retaliation on USD 60B in US imports will start at roughly the same time, slightly after. What caught the markets surprised was Trumps comment that it's not time for negotiation with China yet. And, he later claim again that China is devaluating its currency. Yet, according to Bloomberg's calculation, PBoC's fixing was 0.1% stronger than the average forecast for 17 days in a row. But Trump never needs facts to back up he words as his supporters believe as always. Overall, the development is not surprising to us. The so called restart of trade talks between two low level officials, which we forgot the name and couldn't care less to find out again, was taken seriously by nobody. It's probably just wishful thinking of isolated trade dove Steven Mnuchin's. The measures and counter-measures announced will be realized gradually, till November. There, we'd probably see what really comes next.
In addition, Trump also threatened to exit from the WTO and played victim again, complaining the organization as being unfair to the US. Roberto Azevedo, the WTO's director general responded and said the organization is working with the members to address some common complaints. But Azevedo warned that "the U.S. is about 11 percent of global trade. So leaving the organization would be a blow to the organization. But it would be a blow to the U.S. as well." Azevedo added that it would leave the US businesses in dangerous position of being commercially discriminated and "that is the worst thing that could happen for an economy as globally connected as the American economy."
US stocks made record high and Dollar index rebounded
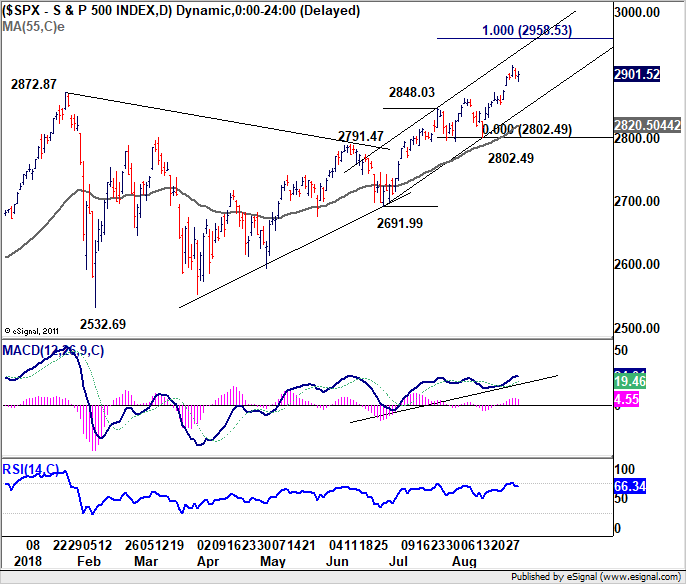
But after all, the US stock markets performed very well last week despite all the trade threats. Both S&P 500 and NASDAQ made record highs. S&P 500 is picking up upside momentum again as seen in daily MACD. The focus will be on whether the index would accelerate further by breaking upper near term channel resistance. But in either case, SPX will likely target 100% projection of 2691.99 to 2848.03 from 2802.49 at 2958.53 next, with prospect of a take on 3000 psychological level.
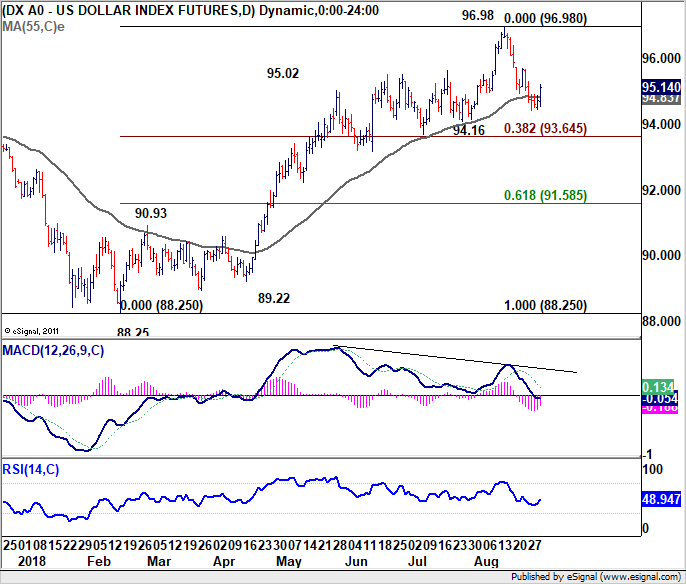
Dollar index also rebounded strongly after dipping to 94.43. Overall outlook is unchanged that DXY is in medium term consolidation. More range trading would be seen in near term below 96.98 high. But even in case of deeper fall, down side should be contained by 38.2% retracement of 88.25 to 96.98 at 93.64. Considering that this fibonacci level is close to 55 week EMA (now at 93.75) to bring rebound.
Euro suffered from trade war, Turkey and Italy problems
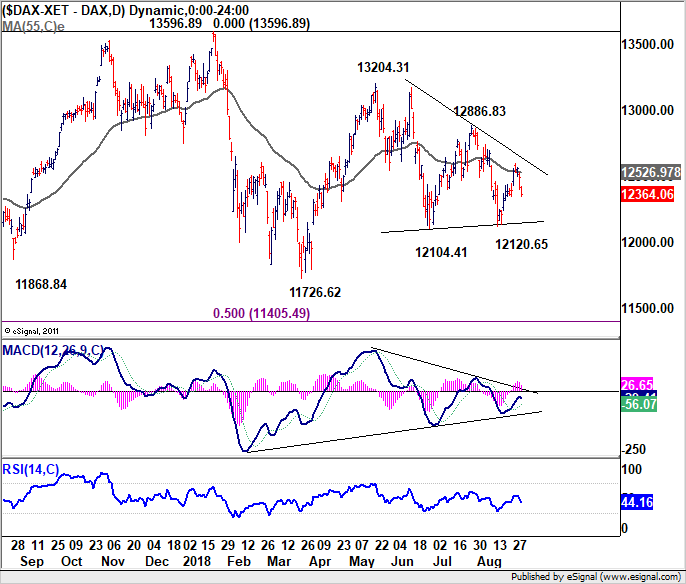
Euro was admirably resilient last week considering the problems the bloc is facing. German DAX dived sharply on Friday in the wake of Trump's trade rhetorics. The development suggests that rebound from 12120.65 has completed after touching 55 day EMA. And even though 12104.41 support was defended earlier in August, the weak rebound and limitation by 55 day EMA carry bearish implications. A downside breakout is expected in DAX through 12104.41 eventually, to 11726.62 and below to extend the correction from 13596.89 high.
In addition to trade war, Turkish Lira was sold off last week on deepening worries on Turkish banks. Fitch warned that "Turkish banks are particularly exposed to refinancing risk, given their reliance on external funding." Moody's also said "there is a heightened risk of a downside funding scenario, where a deterioration in investor sentiment limits access to market funding."
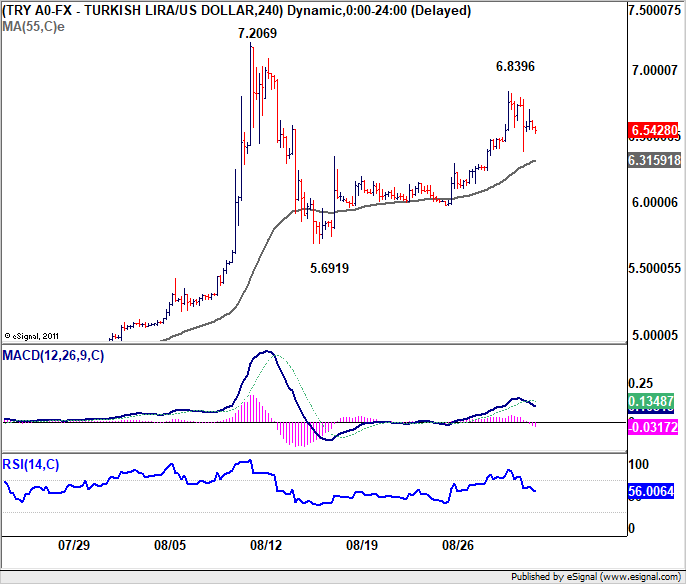
USD/TRY hit as high as 6.8396, comparing to August low at 5.6919 and high at 7.2069. Lira then recovered mildly on the governments measures on taxing deposits. Withholding tax on foreign currency savings of up to six months was increased from current 18% to 20%. On the other hand, withholding tax on Lira savings of more than one year was lowered from 10% to 0%. The selloff in Lira reminded investors that the problem is not solved yet and that's another weighing down the Euro.
Then, the fiscal health of Italy came in to spotlight on Friday. Fitch kept Italy's sovereign debt rating at BBB, but downgraded the outlook from stable to negative. Fitch said it expected the Italian government to push ahead with "fiscal loosening," leaving its "very high level of public debt more exposed to potential shocks." Fitch also warned that risks increased due to "the sizable policy differences between its coalition partners, and inconsistencies" between some electoral promises, as well as the "stated objective to reduce public debt." And, "it is unclear how these policy tensions will be resolved". Moody's will provide Italy's rating review this week.
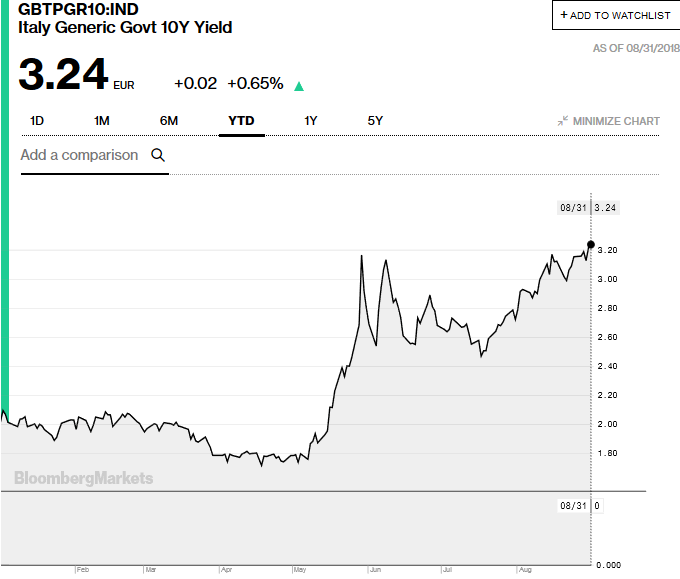
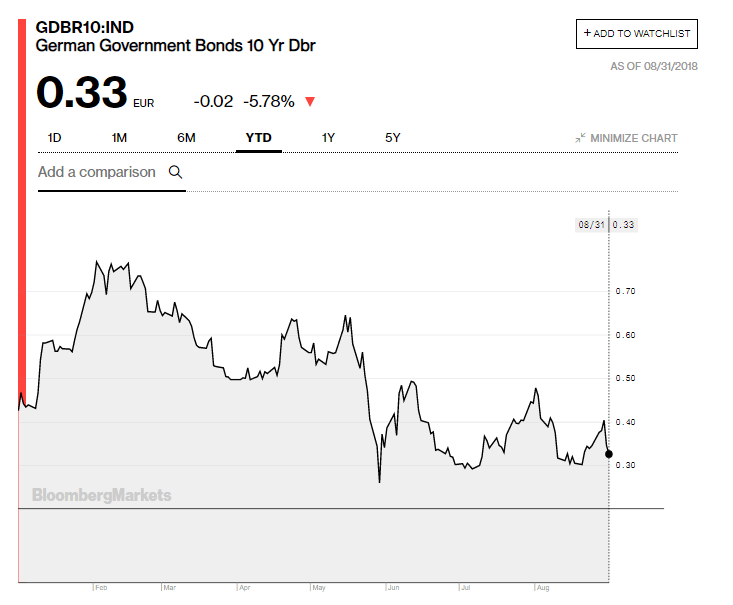
Italian bonds suffered selloff during the week, with 10 year Italian yield closing at 3.24, highest close this year. On the other hand, German 10 year bund yield dropped again after touching 0.4 handle briefly and closed at 0.33. Suddenly, Italian-German spread is very close to 300 again. More importantly, it remains to be seen whether 10 year bund yield can eventually hold above 0.30 handle.
Sterling lifted as no-deal Brexit risk faded
Sterling, on the hand hand, staged a strong rebound on the back of renewed optimism on Brexit negotiation. The risk of "no-deal" Brexit suddenly dropped drastically. The rebound started when EU chief negotiator Michel Barnier said it's prepared to offer the UK a " partnership such as there never has been with any other third country." That's seen as a solid commitment that the EU wants a deal. Later in the week, Barnier added that the issue of Irish border was the "most sensitive point" of the negotiations. But he also noted that it is "possible" to have a solution.
UK Brexit Minister Dominic Raab said that he was "stubbornly optimistic" to reach a deal with the EU. He added that "valuable progress" was made but there is clearly "more work to do. And, he is "confident, if not more confident, now that a Brexit deal can be reached". Both sides also said they're still targeting a conclusion for the October EU summit.
Separately, it's reported that EU officials are considering an unscheduled summit in November to conclude Brexit negotiations. It's actually not news as the October summit is too tight while December one is too late to finalize all the parliamentary approvals. But again, it indicates that EU is working towards a solution with the UK.
Canadian Dollar in deadlock with US on trade talks
Canadian Dollar weakened much due to unsuccessful negotiation with the US. Canada's stance is clear, they don't just want "any deal", but a good one. The so-called Chapter 19 trade dispute resolution mechanism and dairy industries seemed to be the deadlock. Now that the Friday is past, Trump has notified the Congress of his intent to sign a bilateral trade agreement with Mexico, which is called the United States- Mexico Trade Agreement. US-Canada trade negotiations will resume this Wednesday.
There are so much confusions regarding the topic right now. Firstly, is NAFTA still alive? Or it's dead already? Trump indicated he's dropped the name of NAFTA. But Mexican and Canadian officials continued to use the name NAFTA in their communications. Secondly, it's uncertain how Trump could get a bilateral deal with Mexico through the Congress. There seems to be bipartisan consensus that any trade deal must include Canada. And, chief executive of the U.S. Chamber of Commerce, Thomas Donohue also said in a statement that "anything other than a trilateral agreement won't win Congressional approval and would lose business support." So in short, the story hasn't ended yet.
The upcoming BoC meeting on Wednesday will also be a focus. We have been expecting BoC to hike in October meeting. And the speculation of a September hike cooled much last week. Firstly due to trade threats. Secondly, Q2 GDP disappointed a little, thus giving no extra push to hike early.
Australian and New Zealand Dollar were the weakest two
Australian Dollar was the weakest one last week as the lift from new Prime Minster Scott Morrison quickly faded. Economists are starting to expect RBA to stay on hold for longer, possibly even through 2020. Adding to that, base metals came under pressure due to escalation in US-China trade war. Judging from the reactions in the stock markets, the Chinese economy could be hurt severely out of trade war. And when your closest trade partner suffers, Australia will definitely be an unintended casualty. More importantly, the trigger for the selloff is Westpac's mortgage rates hike during the week. It's partly resulted from the transmission from higher interest rates in the US. The rate hike will like drag on consumer spending which could eventually cool inflation and wage growth.
RBA meeting will be an event to watch this week but there is no chance of any change in interest rate. And given that the next MPS and projections will be released in November, we see no reason for RBA to suddenly sound more dovish.
New Zealand Dollar tumbled sharply as ANZ business confidence dropped to a new -50 in August, hitting a fresh 10 year low. RBNZ Governor Adrian Orr was clear in his message that rate is going to stay low, for longer. And the next move could either be a hike or a cut.
Position trading - Sell AUD/JPY on recovery to 80.25
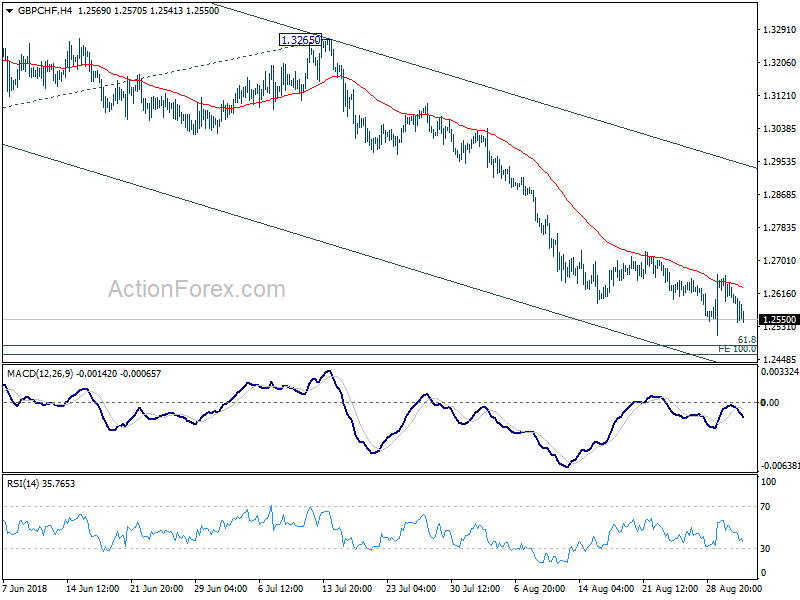
As noted in this update, we've exited our GBP/CHF short sold at 1.2971, closed at 1.2587, with 384 pips profits. Price actions after that was rather volatile as GBP/CHF first dived to 1.2509 and then recovered to 1.2665, and gyrated lower to close at 1.2550. We're mentioned the in the update the reasons for the reasons than expected exit already. EUR/GBP's reversal was an important trigger. If we didn't close the position at that time and hold on to it, our 1.2500 target still couldn't be hit. And by the time GBP/CHF hit 1.2509, we should have tightened our stop to close to 1.2653. That is, we could have stopped out higher. One may argue that we could have exit on the fall to 1.2509. But the dip and rebound happened within one hour. There's no way for us to really get out at that hourly bar. So, while it's not perfect, we've done our best in this trade already.
The EUR/AUD rally was missed as we've put our long entry at 1.5800, slightly below 38.2% retracement of 1.5601 to 1.5945 at 1.5814. But EUR/AUD dipped to 1.5829, slightly above 1.5814 fibonacci level, and start another rally. We were wrong in anticipating the impact of new Prime Minister Scott Morrison, which didn't last too long. The order was cancelled, without chasing, because the rise from 1.5829 to to 1.5953 was not convincing. It's a pity that we couldn't get this one. But just like the above GBP/CHF trade, we're most usually on the safe side in terms of position trading. And, there's a cost that we gracefully accept.
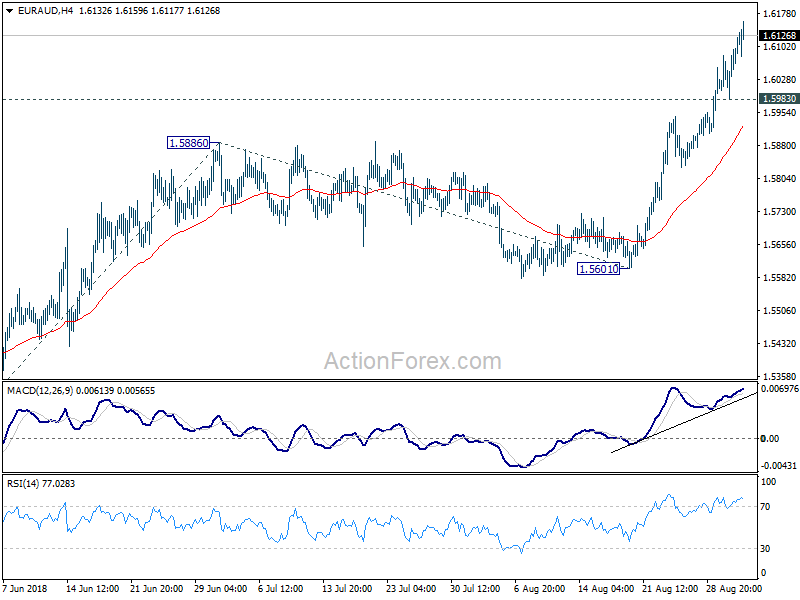
For the week ahead, we'll look at short opportunity in AUD/JPY. Firstly, EUR/AUD took the lead in rally resumption two weeks ago already. AUD/USD followed last week and broke 0.7201 to resume down trend from 0.8135. AUD/CAD also extended the down trend from 1.0241 to as low as 0.9361 last week. AUD/NZD also extended the fall from 1.1174 and should have reversed the up trend from 1.0486. These developments point to more AUD weakness ahead.
Meanwhile, EUR/JPY, GBP/JPY and USD/JPY should have topped out at least temporarily last week. Asian stocks weakened in general with the exception of the resilient Nikkei. 10 year JGB yield dipped to 0.093 last week but managed to closed above 0.100 at 0.109. These factors suggests more upside in JPY, possibly except USD and CHF.
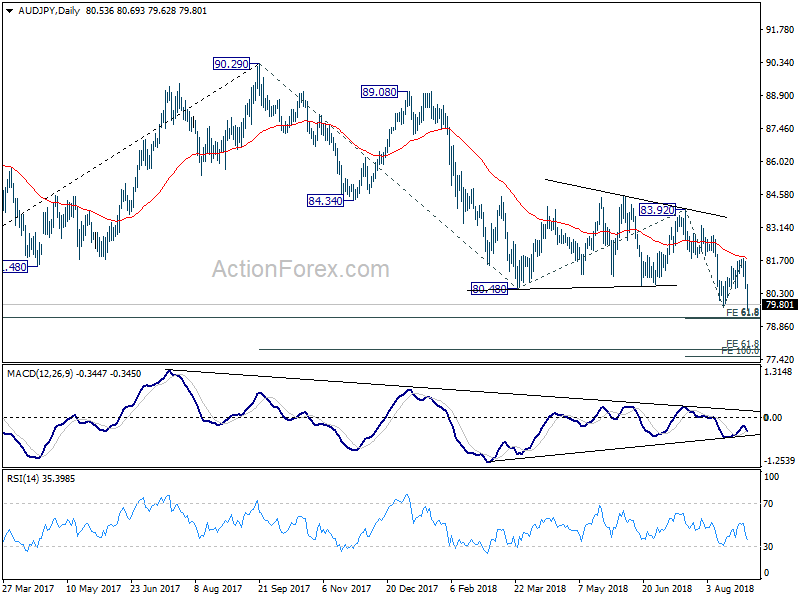
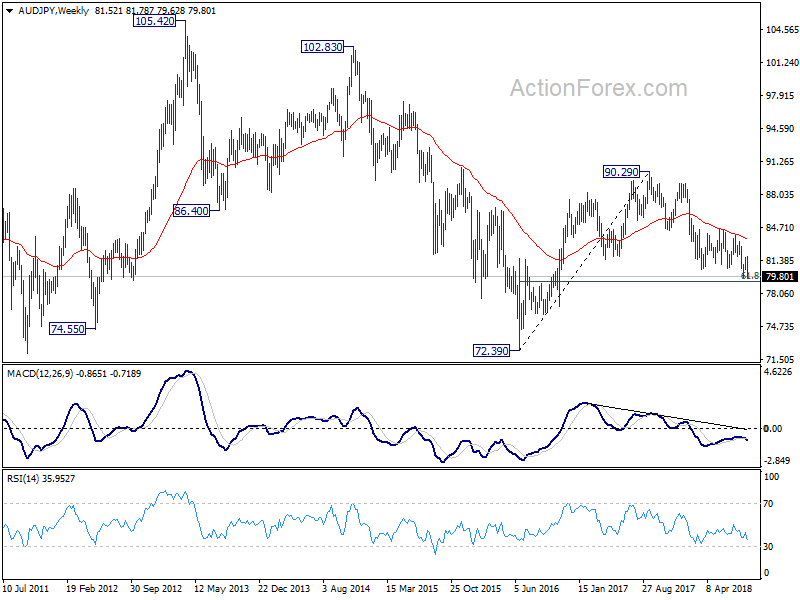
Now, AUD/JPY. The rebound from 79.69 was stronger than we expected here. We were wrong in seeing the rebound as correction to fall from 82.78, but instead it corrected fall from 83.92. Nonetheless, it's still a correction that completed at 81.78 and larger fall from 90.29 is resuming. Next target is 61.8% projection of 83.92 to 79.69 from 81.78 at 79.16. This level is close to 61.8% retracement of 72.39 to 90.29 at 79.22. But based on current downside momentum, AUD/JPY shouldn't have any problem passing through this 79.16/22 level. The real test lies in 77.55/85 (61.8% projection of 90.29 to 80.48 from 83.92 at 77.85, 100% projection of 83.92 to 79.69 from 81.78 at 77.55).
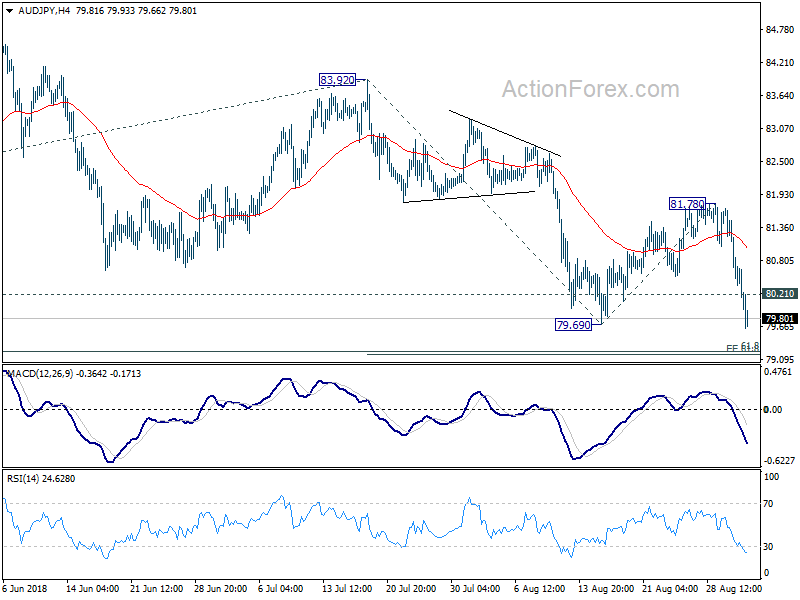
As AUD's selloff was a bit stretched last week, we'll sell AUD/JPY on recovery this week at 80.25, with stop at 81.00 (close to 4 hour 55 EMA now). Initial target is at 78.00, slightly above 77.55/85 zone. This gives risk/reward ratio of 1:3, which is acceptable. However, we won't rigidly get out at 78.00 for now but look at the downside momentum to decide where the exit is. There is prospect of falling deeper.
AUD/USD Weekly Outlook
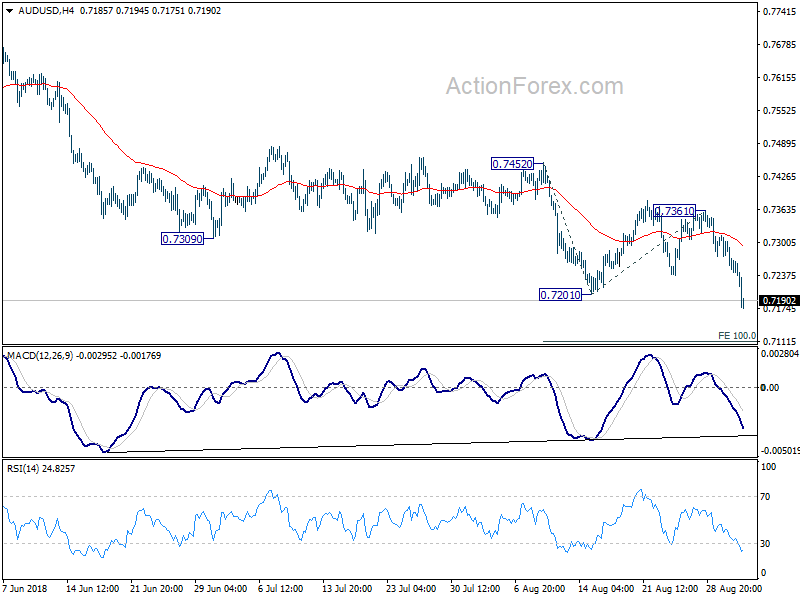
AUD/USD dropped to as low as 0.7175 last week and the break of 0.7201 confirmed resumption of down trend from 0.8135. Initial bias is on the downside this week for 100% projection of 0.7452 to 0.7201 from 0.7361 at 0.7110. Break will target 161.8% projection at 0.6955. On the upside, break of 0.7361 résistance is needed to indicate short term bottoming. Otherwise, outlook will remain bearish in case of recovery.
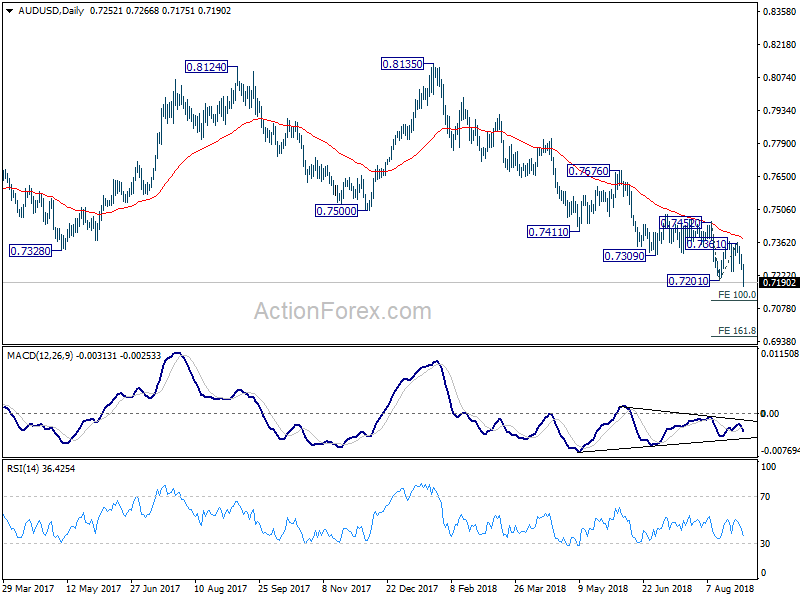
In the bigger picture, rebound from 0.6826 (2016 low) is seen as a corrective move that should be completed at 0.8135. Fall from there would extend to have a test on 0.6826. There is prospect of resuming long term down trend from 1.1079 (2011 high). But we'll look at downside momentum to assess at a later stage. On the upside, break of 0.7452 resistance, however, will indicate medium term bottoming, on bullish convergence condition in daily MACD. In that case, a medium term correction should be seen first before down trend resumption.
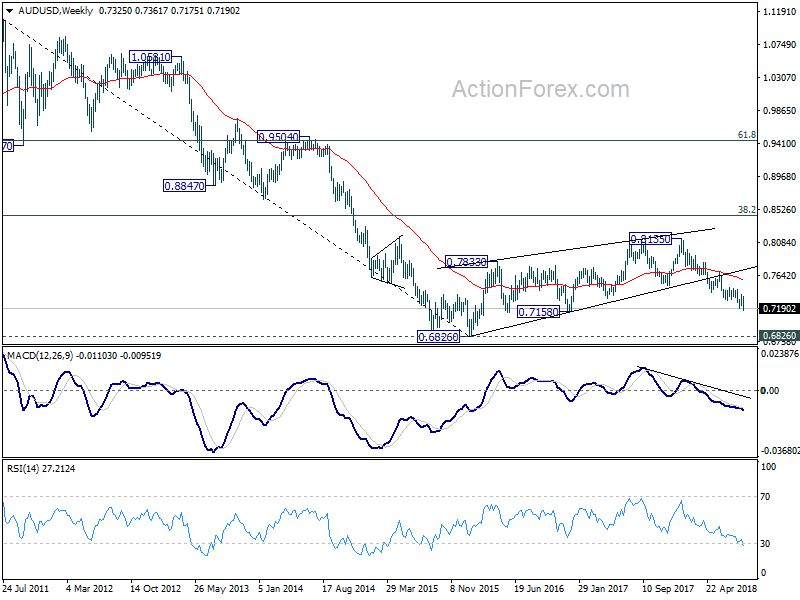
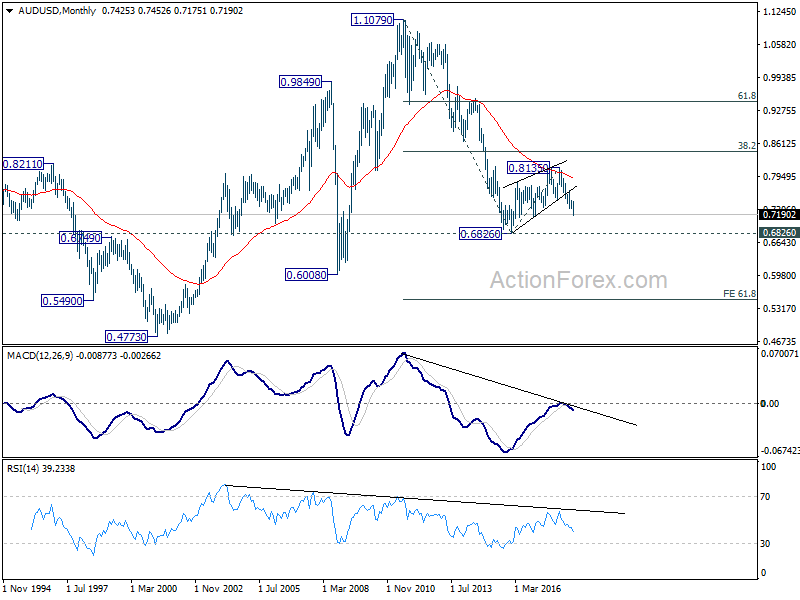
In the longer term picture, rebound from 0.682 (2016 low) should have completed at 0.8135 already. Failure to reach 38.2% retracement of 1.1079 (2011 high) to 0.6826 at 0.8451 carries bearish implications. This is also supported by the corrective structure from 0.6826 to 0.8135, as well as the rejection by 55 month EMA. The down trend from 1.1079 is in favor to extend. On break of 0.6826, next target will be 61.8% projection of 1.1079 to 0.6826 from 0.8135 at 0.5507.
Summary 9/3 – 9/7
Monday, Sep 3, 2018
[php_everywhere instance="1"]
Tuesday, Sep 4, 2018
[php_everywhere instance="2"]
Wednesday, Sep 5 2018
[php_everywhere instance="3"]
Thursday, Sep 6, 2018
[php_everywhere instance="4"]
Friday, Sep 7, 2018
[php_everywhere instance="5"]
Weekly Economic and Financial Commentary: Trade Tensions Show Some Signs of Easing, For Now
U.S. Review
Objects in Rearview Mirror Are Bigger than They Appear
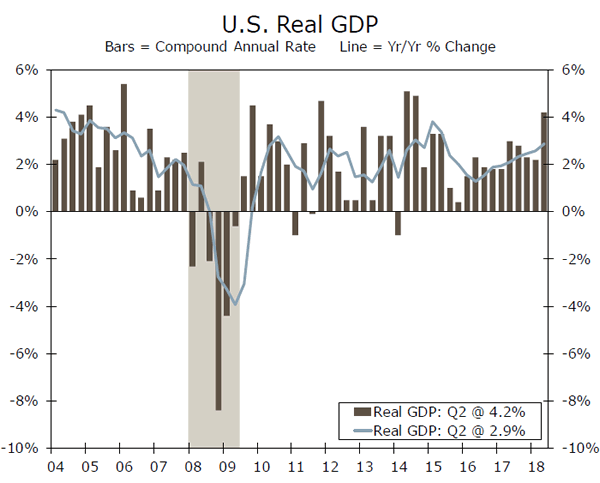
- Revisions to second quarter GDP released this week lifted the growth rate to 4.2 percent in Q2, while revealing a faster rate of business spending and a record high for corporate profits.
- The pace of consumer spending, while still strong, was revised a bit lower. That said, this week's economic indicators show that the momentum in consumer spending in the prior quarter carried into the current one. The Conference Board's Consumer Confidence index continued to rise and, reflecting a tight labor market, income gains helped sustain consumer spending growth in July.
Details of GDP Revision Broadly Positive
The second estimate for GDP revealed a faster pace of economic growth than first estimated, with the annualized growth rate quickening slightly to 4.2 percent in Q2. The details also offered additional color on the state of the economy at this late stage of the cycle and, with some exception, those details were broadly positive.
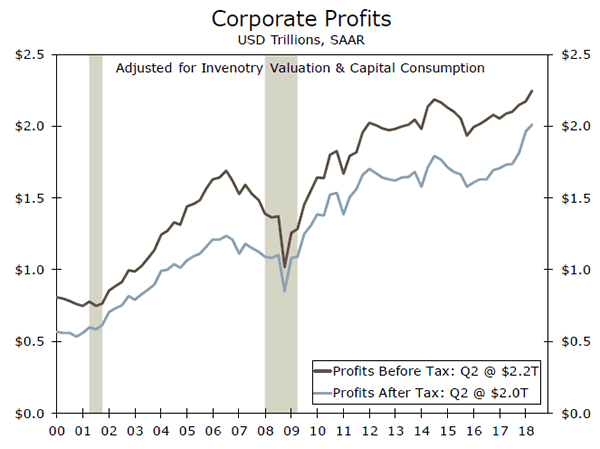
In terms of "new" details, the second GDP release offers the first look at corporate profits. While we already had some positive inklings from the individual company earnings reports, the official figures here for the aggregate economy were solid. Pre-tax profits grew $72.4 billion over the quarter, nudging the overall pre-tax profit level to $2.2 trillion, a record high for the series (top chart).
There is some evidence that the sugar high from the tax cuts is wearing off, however. After-tax profits rose only $47.3 billion, compared to the near $150 billion surge in the first quarter. This more modest increase was partially due to a rise of nearly one percentage point in the effective corporate tax rate. The deceleration in after-tax profits corroborates our forecast that the effect of the 2017 Tax Cuts and Jobs Act will only act as a temporary boost to corporate profit growth.
Businesses are still spending. We also learned in the revisions that business fixed investment was better than first reported, with a 6.2 percent growth rate in the second quarter, up from 5.4 percent previously. Upward revisions to equipment and intellectual property spending accounted for most of the improvement.
Consumer Strength Continued into Current Quarter
Consumer spending was still stellar in the second quarter, growing at a 3.8 percent annualized clip, but admittedly, that is one category that was revised down; the first estimate had a 4-handle. The slight downward revision here does not shake our conviction that consumer spending will continue to support growth in the second half of the year.
The Conference Board's measure of consumer confidence rose 5.5 points in August, with gains in both present and future expectations. Current optimism continues to be a reflection of the tightening labor market, as the share of consumers stating jobs as plentiful was little changed, and those who see jobs as hard to get fell 2.1 points. Not all measurements of confidence improved in August, for example the August University of Michigan's measure of sentiment slipped to its lowest level since January. Consumers feel better about their current financial situation than their expected situation, as inflation appears to be a growing concern.
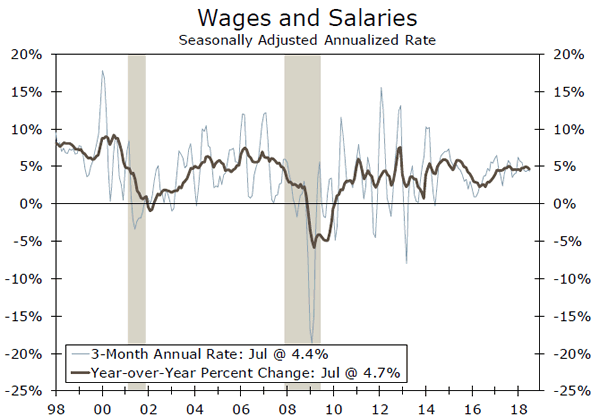
Despite rising inflation concerns, real disposable income was up 2.9 percent over the past year in July. The tight labor market conditions showed up in the personal income and spending report for July, where we saw sustained strength in wages and salaries, which were up 0.4 percent for the second consecutive month. July spending increased 0.4 percent, which offers some affirmation (middle chart) that steady consumer spending carried into the current quarter, though the pace of spending may slow somewhat in the second half of the year.
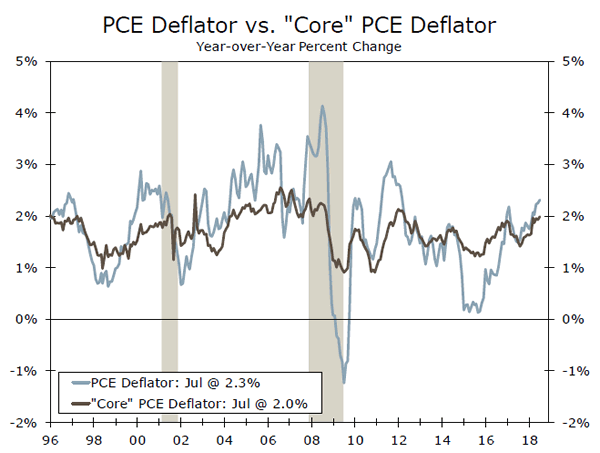
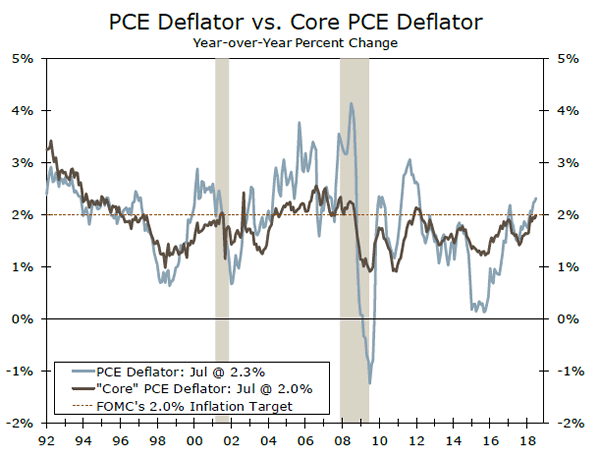
The year-over-year rate of PCE inflation rose to 2.3 percent, the fastest pace in six years and in line with the Fed's target (bottom chart). Provided we get a decent August jobs number next week, the Fed is on track for another hike at its September 26 meeting.
U.S. Outlook
ISM Manufacturing Index • Tuesday
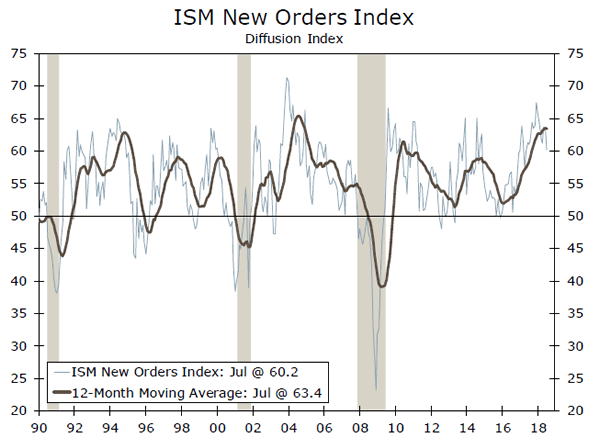
The ISM manufacturing index cooled slightly in July, falling 2.1 points to 58.1. While the index still sits at a high level, signaling that manufacturing activity remains strong, the changing trade environment looks to be affecting activity, as some manufacturers cited slowing in new export orders. The new orders index dropped over three points to 60.2, its lowest reading in more than a year. However, hiring remained a bright spot in July, with the employment index recovering 0.5 points to 56.5. Manufacturing payroll growth has displayed a similar trend, with industry adding 156,000 jobs in H1, more than double the number added over the same period last year. While changing trade policy has clearly affected the sector, regional purchasing managers' indices show that capital spending plans remain elevated. For now, the slight pullback in the ISM readings should not materially affect the overall economic outlook, and we look for the ISM index to remain solid in August.
Previous: 58.1 Wells Fargo: 57.5 Consensus: 57.7
Trade Balance • Wednesday
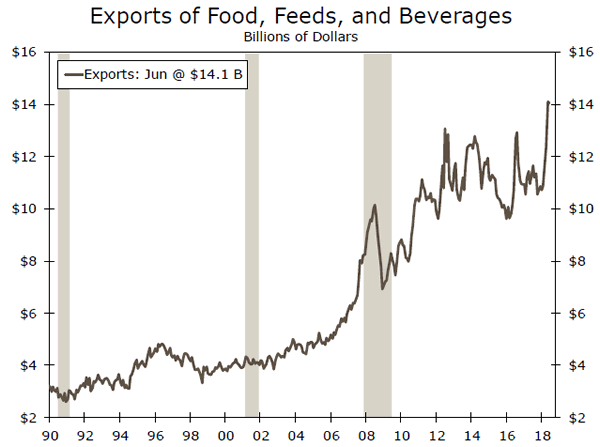
The trade deficit widened to $46.3B in June, largely due to a drop in typically volatile aircraft exports, compounded by a $1.4 billion decline in consumer goods exports. However, soybean exports have surged in recent months, up $4.4 billion year-to-date in June, as farmers have moved to get soybean shipments out of the country ahead of retaliatory tariffs. That said, we look for soybean exports to come back down to earth, which could prove a drag on the more rapid pace of export growth seen over the past few months.
The trade balance likely widened further in July, as a 1.7 percent drop in goods exports reported in the advance release drove the deficit much higher than expected. While real net exports provided a 1.2 percentage point boost to Q2 GDP growth, that contribution looks poised to reverse, and we look for net exports to be a drag on GDP growth in Q3. Solid domestic demand should support growth in imports, while trade-related export distortions will likely fade.
Previous: -$46.3B Wells Fargo: -$50.8B Consensus: -$49.6B
Employment • Friday
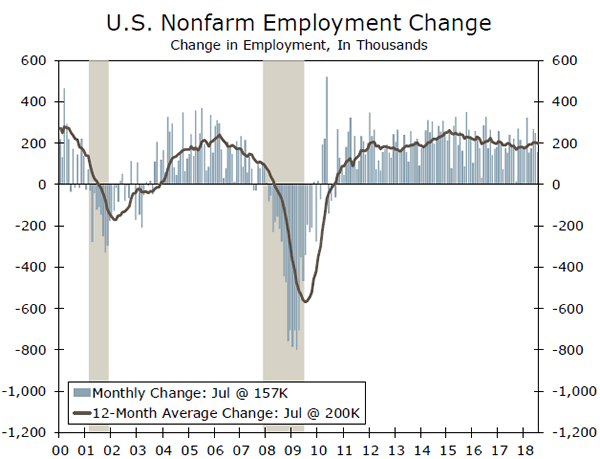
Nonfarm payrolls rose 157,000 in July, with the monthly change coming in a bit lower than the pace seen over the past few months. However, payroll growth has still averaged 215,000 jobs per month since the beginning of the year, up from 184,000 over the same period in 2017. The manufacturing sector has shown particular strength, adding 37,000 jobs in July for the largest monthly increase so far this year. Although July's employment growth came in slightly weaker than expected, average hourly earnings continued their steady rise, up 0.3 percent over the month. Solid wage growth along with the unemployment rate ticking back down to 3.9 percent confirms that the labor market remains tight. We look for employment growth to regain its upward momentum, and forecast nonfarm payrolls to rise 200,000 in August. These trends should support the Fed's assessment of a strengthening labor market, and reinforces our call for two more rate hikes before the end of the year.
Previous: 157,000 Wells Fargo: 200,000 Consensus: 187,000
Global Review
Trade Tensions Simmer
- Trade developments this week were mostly benign with a bilateral deal reached between Mexico and the U.S., while progress is seemingly being made with Canada to join a broader deal. However, next week could see an escalation in global trade tensions should the U.S. move ahead with plans to impose another round of tariffs on China.
- Key global data released in the past week were mixed. Canada's Q2 GDP growth firmed and Eurozone August CPI inflation softened a touch, while Chinese August PMIs edged higher. Argentina's efforts to support the peso provided little relief.
Trade Tensions Show Some Signs of Easing, For Now
Trade developments this past week were mostly constructive, starting with an announcement on Monday that the United States and Mexico reached a bilateral trade agreement. Among key elements of that deal, the two countries agreed that 75 percent of an automobile's value be manufactured in the United States or Mexico, up from 62.5 percent in North America under NAFTA, while 40 to 45 percent of a car must be made by workers earning at least $16 an hour for the car to not be subject to tariffs. As the week progressed, key Canadian and U.S. officials met in Washington to make progress on a more comprehensive trade deal that could include all three of the NAFTA countries. As of this writing, those talks are still ongoing. Separately, the U.S. administration said it will maintain tariffs of 25 percent on steel imports and 10 percent on aluminum imports, but announced targeted relief on steel from South Korea and Brazil, and aluminum and steel from Argentina. While trade developments this week were benign, markets will be keenly focused on whether the U.S. moves ahead with further tariffs on $200 billion of Chinese imports after a period of public-comment concludes next week.
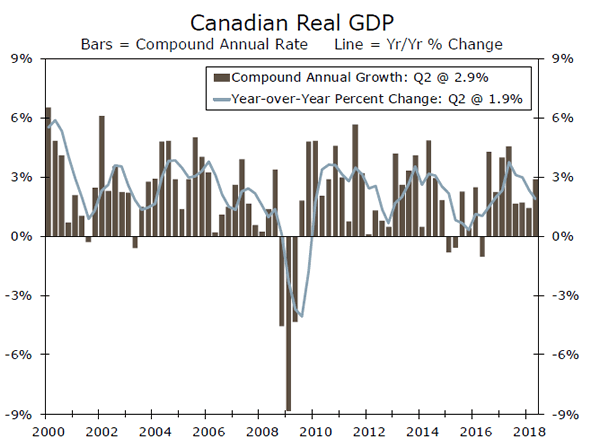
While Canadian officials have been busy negotiating trade, Canada's Q2 GDP data were released and showed that growth firmed to 2.9 percent on a quarterly annualized basis from 1.4 percent in Q1 (top chart). Energy exports and household spending contributed to the pick-up in Q2 growth, while slowing business investment was the primary factor behind the slightly softer-than-expected overall GDP growth rate. These data along with still lingering trade uncertainty supports the case for further gradual interest rate hikes by the Bank of Canada, discussed on the following page.
Eurozone CPI Inflation
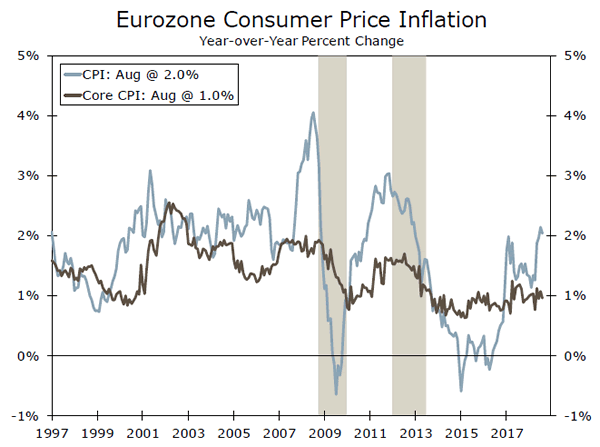
Eurozone August CPI inflation edged down to two percent yearover- year as expected (middle chart). While the overall rate of inflation matched multi-year highs, core CPI inflation was more subdued and eased to one percent year-over-year. Recent inflation trends support the European Central Bank's current plan to gradually dial back the degree of monetary accommodation, including the end to asset purchases at the end of this year and initiating interest rate hikes from the second half of next year.
Argentine Peso Takes Another Plunge
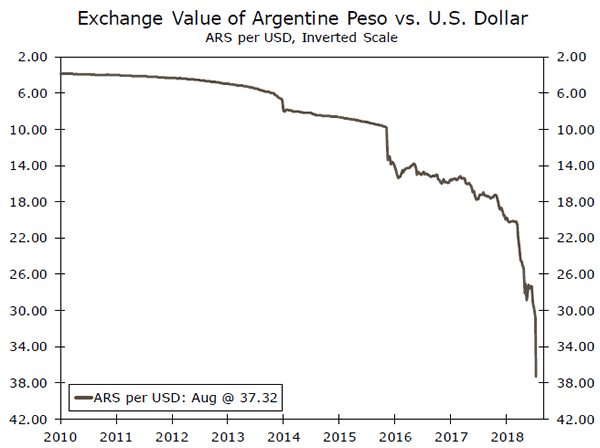
The Argentine peso fell substantially over the past week after previous large declines. The drop in the currency occurred surrounding Argentina's request of the International Monetary Fund (IMF) to accelerate payments from a $50 billion credit line, which contributed to jitters about the country's economic fragility. The currency decline prompted yet another central bank interest rate hike, with a 15 percentage point increase in Argentina's policy interest rate to 60 percent. That move makes Argentina's interest rates among the highest in the world and has so far done little to stem the peso's plunge, which weakened to a new record low (bottom chart).
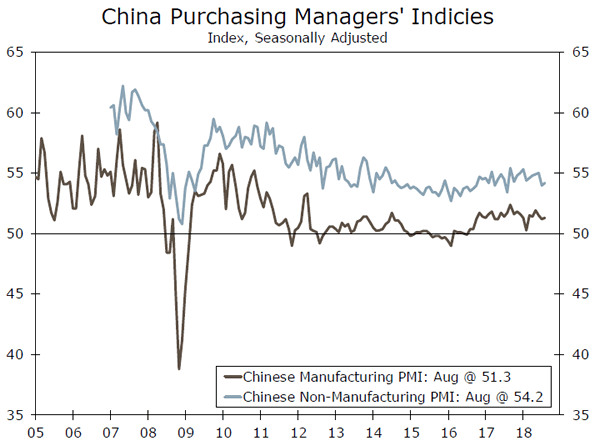
Elsewhere in emerging markets, China's manufacturing PMI edged up to 51.3 and the non-manufacturing PMI rose to 54.2 (see chart on front page). That data suggest steady overall economic activity as the Chinese economy remains on a path of gradually slowing growth over time.
Global Outlook
U.K. Manufacturing PMI • Monday
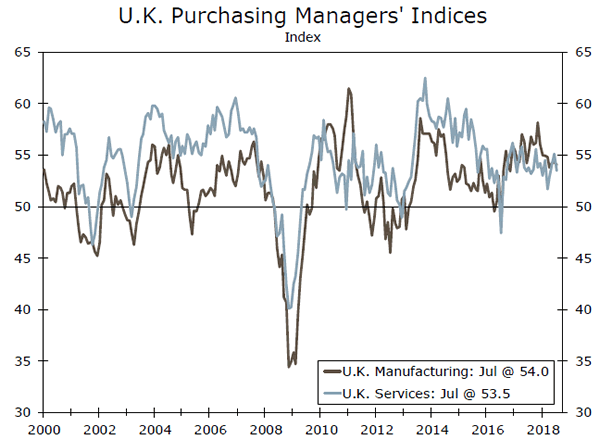
The U.K. manufacturing PMI fell by more than expected in July to 54.0 from 54.3 the month before, and down from a high of 58.2 late last year. The new orders component fell to 54.2, the lowest in over a year, suggesting that the soft start to U.K. manufacturing in Q3 may continue. Moreover, sentiment remained subdued last month amid ongoing Brexit uncertainty, hinting at potential for next week's release of the August manufacturing PMI to remain somewhat contained.
Later in the week, the services PMI is also due. That release may shed more insight than the manufacturing survey into the U.K.'s overall economic outlook given its more dominant service sector. The July services index declined to 53.5 from a 2018 high of 55.1 in June, as respondents said that Brexit uncertainty contributed to a "wait-andsee" approach to investment. Given Brexit concerns showed little-tono improvement in August, sentiment likely remained subdued.
Previous: 54.0 Consensus: 53.9
Reserve Bank of Australia • Tuesday
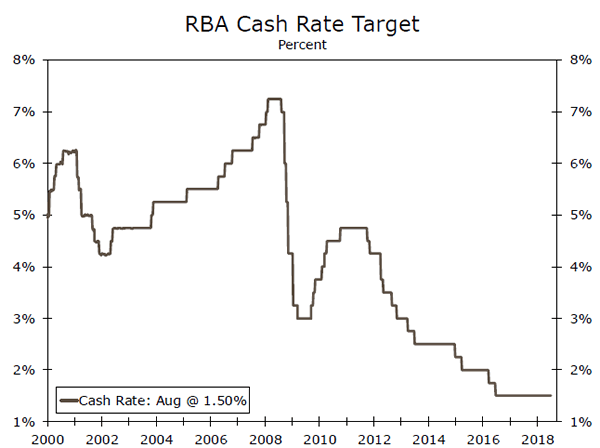
The Reserve Bank of Australia (RBA) has held its Cash Rate at 1.50 percent for the past two years and is expected to keep holding its rate steady for the time being. Growth and inflation firmed modestly in Q2 with CPI inflation moving into the lower end of the RBA's target range of two to three percent, while wage costs remain subdued. Given the overall gradual progress on inflation, minutes from the last monetary policy meeting noted that there was "no strong case for a near-term adjustment" in rates, while also indicating that the next rate move would more likely be an increase than a decrease. Hence, we look for the RBA to keep rates unchanged next week.
Australian Q2 current account figures are also due on Tuesday, while Q2 GDP data are scheduled for release on Wednesday. The current account deficit is expected to widen slightly, to about 2.4 percent of GDP, while some moderation in Q2 GDP growth is expected, to a 2.8 percent year-over-year rate, down from 3.1 percent in Q1.
Previous: 1.50% Wells Fargo: 1.50% Consensus: 1.50%
Bank of Canada • Wednesday
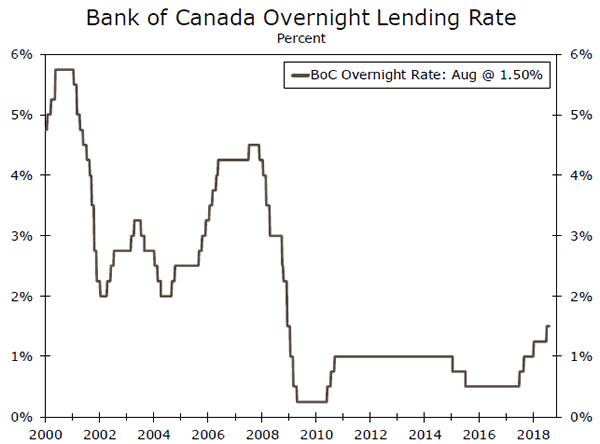
The Bank of Canada (BoC) raised its overnight lending rate 25 bps to 1.50 percent at its latest meeting in July. Growth momentum picked up after a relatively soft start to the year, with Q2 GDP growth firming to a 2.9 percent annualized rate from 1.4 percent in Q1. Meanwhile, July CPI inflation quickened to 3 percent, which is the fastest pace since 2011 and the top of the BoC's inflation target range. Speaking at the Jackson Hole symposium, Gov. Poloz said recent high inflation is transitory, and reiterated a gradual, data-dependent approach to further rate hikes. Thus, while further rate increases are on the horizon, we expect the BoC to remain on hold next week and instead wait until later this year to deliver another rate hike.
Canada's August employment report is due on Friday and is expected to show a slower pace of job gains than the prior month, while the jobless rate may tick up. Average hourly earnings will also be closely monitored to see if the recent softening in wages continues.
Previous: 1.50% Wells Fargo: 1.50% Consensus: 1.50%
Point of View
Interest Rate Watch
Jackson Hole: Taking the Long View
Last Friday, FOMC Chairman Jerome Powell spoke at the annual Jackson Hole symposium. In terms of the immediate monetary policy consequences of the speech, there were few. Powell broadly reaffirmed the FOMC's commitment to gradually increasing interest rates. However, rather than dive into the various "risk factors" that could alter the policy outlook, Powell chose to take a more structural view on monetary policymaking.
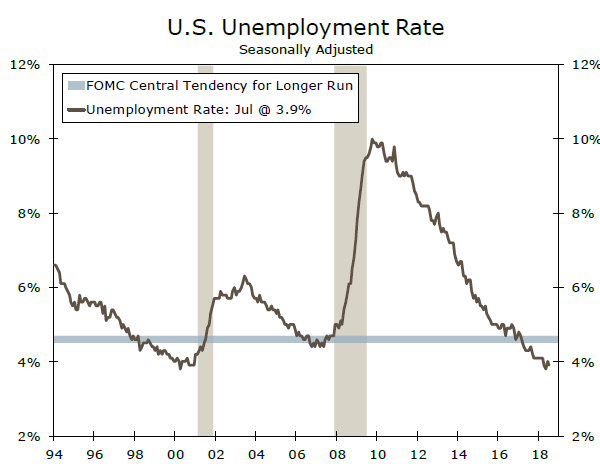
Chairman Powell thematically walked through the different historical periods of monetary policymaking, with a particular focus on the late 1990s. During this period, a tight labor market was met by declining levels of core inflation, a puzzling real-time problem for Chairman Greenspan and other FOMC policymakers at the time (top and middle charts).
Powell noted that, with the benefit of hindsight, we now know that potential growth had shifted up, allowing the economy to operate at historically high growth rates without overheating. By remaining data dependent "the FOMC thus avoided the mistake of overemphasizing imprecise estimates of the stars [the neutral rates of interest and unemployment]."
In some ways, today's parallels with the late 1990s are striking. U.S. equity valuations are historically high, the labor market is booming, economic growth is at a cycle-high but inflation remains in check. Without the benefit of hindsight, it is difficult to pin down exactly why this is. But, perhaps Chairman Powell is implicitly stressing that data dependency is critical when there are significant uncertainties about key structural economic variables, such as the neutral interest rate, the natural rate of unemployment or the extent to which inflation responds to resource utilization.
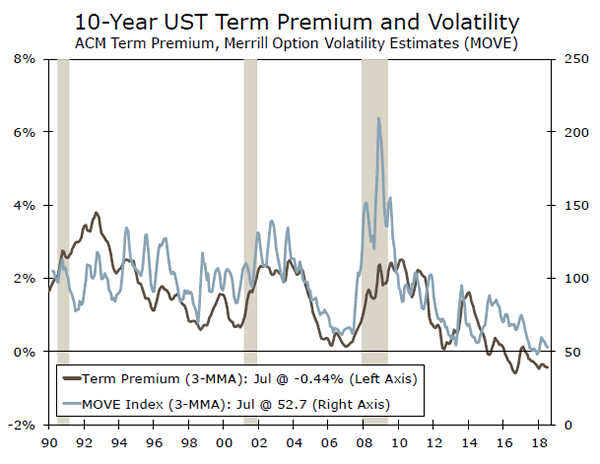
With the term premium still generally considered negative in the United States and interest rate volatility historically on the low side (bottom chart), markets seem to see a below-average level of uncertainty on the horizon for interest rates. Only time will tell if this is consistent with a data-dependent Fed that sees a high level of uncertainty in the stars.
Credit Market Insights
Mortgage Rates and Normalization
Recently there has been a marked deterioration in the Fannie Mae Home Purchase Sentiment Index and the Michigan Consumer Sentiment Survey's "good time to buy a house" response. A major driver of this worsening outlook of would-be homebuyers has been rising mortgage rates. Indeed, in the past year the conventional 30-year rate has risen to 4.51 percent, from 3.43 percent.
While mortgages rates generally track the ten-year Treasury rate, mortgages— packaged into mortgage-backed securities (MBS)—also carry prepayment risk. Investors therefore demand a higher yield to compensate them for this risk, hence the spread of MBS over Treasuries. The Fed removed much of this risk from the market after the financial crisis as its balance sheet ballooned and its MBS holdings increased from $0 to $1.7 trillion, thereby driving rates down across the economy and aiding the troubled housing sector specifically.
Currently, the Fed is removing this support and allowing up to $16 billion of MBS to roll off its balance sheet each month. How high mortgage rates will go in response remains to be seen, and our forthcoming Part II report on the return to "normal" will explore the effect of the composition of Fed holdings on interest rates moving forward. Of particular interest, noted in Part I, is the possibility of higher rates reducing refinancing activity, thereby slowing MBS redemptions and interfering with the Fed's carefully choreographed balance sheet reduction and normalization plan.
Topic of the Week
Labor Day Special
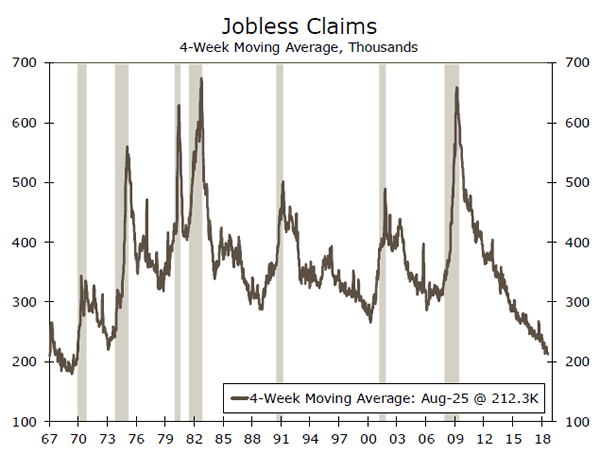
Heading into Labor Day, the four-week average of initial jobless claims fell to 212,250 this week, the lowest level recorded since 1969 (top chart). To put the comparison into perspective, the size of the labor force has more than doubled over this 49-year period. The unemployment rate tells a similar story of an extraordinarily tight labor market; at 3.9 percent, it is near a 20-year low. From the perspective of unemployment, American workers are clearly in an advantageous position this Labor Day. However, the broader picture, incorporating wage and salary growth, offers a more nuanced view.
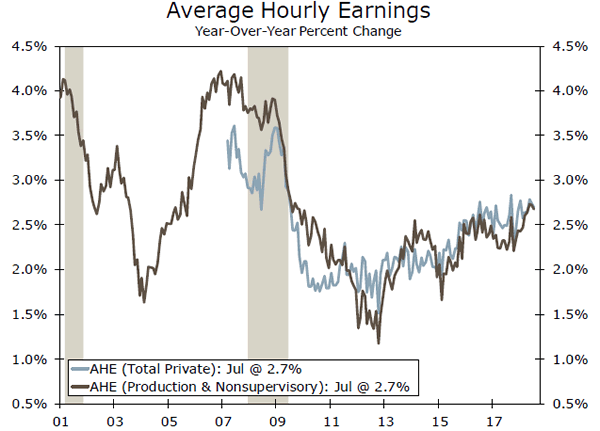
Despite business surveys indicating that employers are facing difficulty filling open positions, they are not rushing to raise wages. Average hourly earnings growth has picked up since the early days of the expansion, but has yet to breach 3 percent (bottom chart). In addition, higher consumer price inflation—which is currently running at 2.9 percent year-over-year—is increasingly eroding nominal wage gains. On a real basis, wages have actually declined for the past three months. As we have written previously, non-wage compensation is showing a more convincing upward trend, with benefits growth outpacing wages. However, total compensation growth remains weaker than in previous cycles.
The puzzle of low wage growth in a tight labor market was addressed this month at the annual Economic Policy Symposium in Jackson Hole, Wyoming, which brings together central bankers from around the world. At the luncheon address, Alan Krueger of Princeton expanded on one possible explanation: declining competition and worker bargaining power. Lower union membership means that workers have less ability to negotiate higher wages, while the increase in employer concentration in the United States facilitates possible collusion on wages. The falling real value of the minimum wage also makes it easier for employers to hold down pay.
We expect wage growth to trend up ahead, but changes in the structure of the economy suggest that we may not see a full return to the conventional relationship between wage growth and labor availability.
The Weekly Bottom Line: Let’s Make a Deal
The Weekly Bottom Line
U.S. Highlights
- Markets reacted positively to developments that the U.S. and Mexico had reached a trade deal. Details still need to be finalized, including Canada's position. A revised, trilateral agreement looks unlikely to be achieved today.
- Data was broadly positive this week. Second quarter GDP was revised up slightly, and after-tax corp. profits rose to the highest y/y pace since 2012. A 0.2% July rise in real spending marks a good start to third quarter consumption.
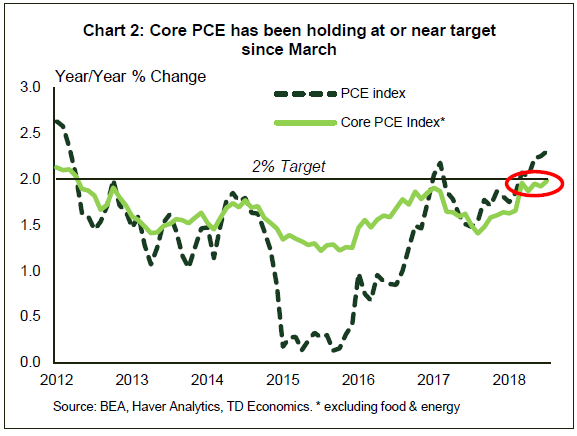
- Core PCE rose 2% y/y in July. Steady inflation, holding at or near target since March, gives the Fed scope to continue on with its gradual reduction in stimulus. The next Fed hike is expected to come in September.
Canadian Highlights
- The U.S. and Mexico reached a new trade agreement, calling for Canada to join the deal by week's end. The U.S.-Mexico pact includes both pluses and minuses for Canada.
- The Federal Court of Appeal ruled against approval of the Trans Mountain pipeline - a negative outcome for oil producers. However, there may yet be a path forward for the project, as the federal government remains committed to seeing it through.
- Second quarter GDP was nearly bang on Bank of Canada expectations, though muted activity in June points to a deceleration in growth for the third quarter.
U.S. - Inflation is Just Where the Fed Wants it to Be
The U.S.-Mexico trade agreement was welcomed by markets this week. Coupled with positive data flow, U.S. equities made further gains midweek. The agreement included augmented rules of origin for autos, strengthened intellectual property protections, and enhanced protections for labor and the environment. Details still need to be finalized, including Canada's position. Today's deadline for a tri-party agreement looks unachievable. An updated NAFTA agreement would allow the U.S. to shift focus back to resolving its trade dispute with China. News reports anticipate that President Trump will impose tariffs on an additional $200 bn of Chinese imports next week, helping pare back equity gains by week's end.
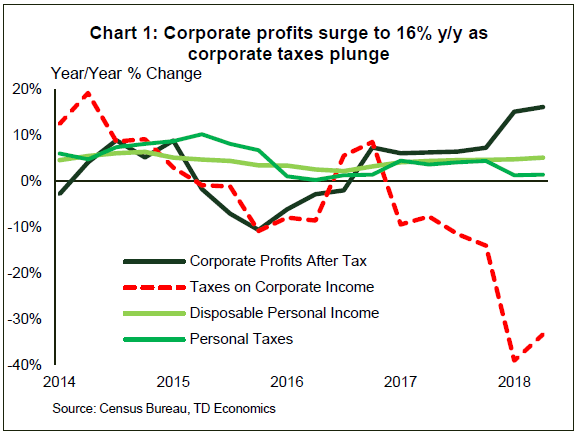
Looking past shifting trade headlines, there was plenty to digest on the data front. Aside from pending home sales, which retreated for the 7th straight month in July and underscored the fact that housing remains a sore spot, data were broadly positive. Second quarter GDP was revised up slightly to 4.2%, beating expectations for a slight downgrade. Corporate profit data, released on the same day, added to the upbeat tone. Corporate taxes fell 33% from a year earlier, boosting after-tax profits 16% in Q2 – marking the best y/y gain since 2012. Tax cuts have indeed been bearing fruit, and they have been far more beneficial to businesses than households (Chart 1).
Personal income and spending data for July also proved positive. Nominal income (+0.3% m/m) and spending (+0.4%) recorded solid gains that were in line with prior months. On an inflation-adjusted basis, spending rose 0.2% m/m, extending the streak in real gains to five months and marking a good start to the third quarter. Last quarter's 3.8% rebound in consumption will be hard to repeat. Nevertheless, upbeat consumer confidence, which is sitting at an 18-year high, along with continued employment gains and rising incomes all point to healthy consumer spending growth in the 2½ to 3% range for the rest of the year.
On prices, it was encouraging to see the Fed's preferred measure of inflation holding at target. Core PCE rose 2% y/y in July, and has been in the 1.9% to 2% range since March (Chart 2). Inflation is not too hot, not too cold – it's just right. This should allow the Fed to continue its gradual reduction in stimulus. As such, an almost certain September hike will likely be followed by another one in December.
Although the U.S. economy is experiencing a goldilocks moment, the same cannot be said for many of its international counterparts. Financial troubles in Turkey and Argentina have policymakers there battling plunging currencies and surging inflation. Argentina's central bank hiked its policy rate to 60% this week – the highest in the world. All told, although the impact of trade policy uncertainty and turmoil in some emerging markets has been limited thus far, they remain clear downside risks to the domestic, and global, economic outlook.
Canada - Let's Make a Deal
Trade talk and a setback for the Trans Mountain pipeline project dominated headlines this week. On Monday, the U.S. and Mexico came to an understanding on a new trade agreement. Canadian markets reacted favourably, with the loonie rising and the TSX rallying, viewing it as a positive step toward a NAFTA resolution. With the agreement came pressure on Canada to join the deal by week's end. Doing so would allow out-going Mexican President Nieto to sign it before leaving office on December 1st. As of writing, no new deal has been reached, though the possibility of an agreement being achieved in short order remains.
The accord reached by the U.S. and Mexico includes some points amenable to Canada. For instance, it raises regional content requirements for automobiles to 75% (from 62.5%). Canadian automakers should be able to clear this hurdle. The U.S. also softened its stance on the sunset clause, in-line with earlier Canadian demands, with the new agreement carrying an effective 16-year term. This offers more certainty for businesses than the 5-year term the U.S. was pushing earlier in the process. One major point yet to be clarified relates to the potential for the U.S. to impose quotas on Canadian auto exports, similar to what they have reportedly negotiated with Mexico. Such an outcome would be negative for Canada's auto industry.
Later in the week, news broke that the Federal Court of Appeal quashed cabinet approval of the Trans Mountain pipeline. This is a negative development for oil producers, as the pipeline offered the chance to diversify export markets and add much-needed pipeline capacity. However, there is a ray of hope, as the federal government remains committed to the project. As such, there may yet be a path to completion, albeit with significant delay.
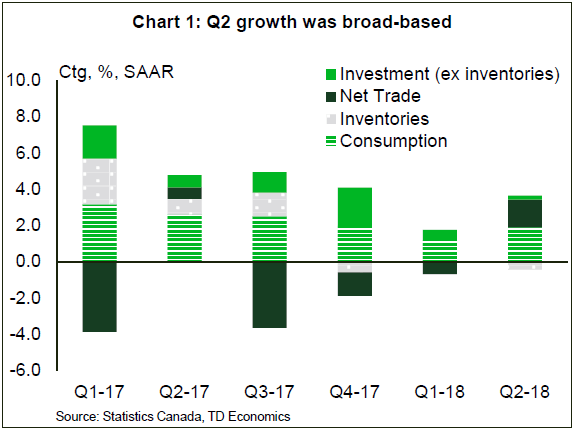
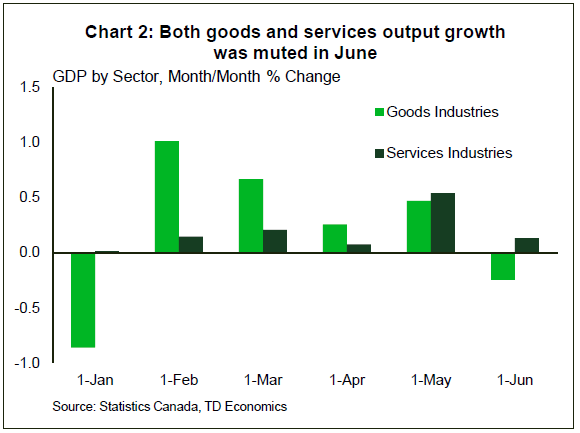
Also in the spotlight was the second quarter GDP report. The economy expanded at an above-trend 2.9% (annualized) pace in the second quarter – almost bang on the Bank of Canada's latest forecast. Growth was broad-based, with several expenditure categories contributing positively to the headline (Chart 1). However, business investment grew at its slowest pace in six quarters, which is certainly eyebrow-raising. The monthly data was also less encouraging, with GDP flat in June, owing to a modest gain in the services sector that was offset by a decline in goods output (Chart 2). This provides a soft handoff to the third quarter, consistent with our forecast calling for firm, but slower growth.
Events this week have likely done little to move the dial for the Bank of Canada, at least in the short-term. While developments on the trade front have so far been encouraging, much is left to be negotiated. Moreover, the Q2 GDP report, while solid, came in as the Bank expected. Our view is that the most likely timing for the next hike remains October. Markets seem to agree, putting the odds at over 80% as of this morning.
U.S.: Upcoming Key Economic Releases
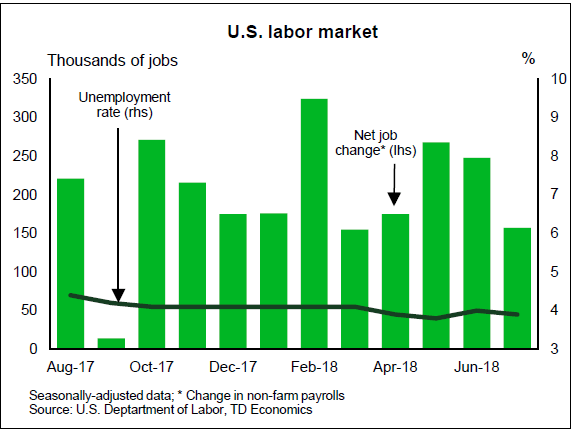
U.S. Employment - August
Release Date: September 7
Previous: 157k, unemployment rate: 3.9%
TD Forecast: 190k, unemployment rate: 3.8%,
Consensus: 194k, unemployment rate: 3.8%
We expect payrolls to bounce back by 190k in August as the prior moderation in services unwinds. Solid growth should continue to be underpinned by strength in goods-producing jobs, in line with ISM jobs indicators. However, August payrolls tends to underperform ADP as well as consensus forecasts, so we lean against a strong +200k print. On the back of the solid trend in payrolls (221k 6m average), we expect the unemployment rate to dip back to previous lows of 3.8%. On wages, we expect average hourly earnings to rise 0.2% m/m, keeping the y/y pace at 2.7%. The reference week (with the 12th of the month landing on a Sunday) implies a weak m/m point though also a wide dispersion (-0.1% to 0.4%). Given that the prior July increase was relatively strong (0.3%), we are biased toward a relatively modest August rise.
Canada: Upcoming Key Economic Releases
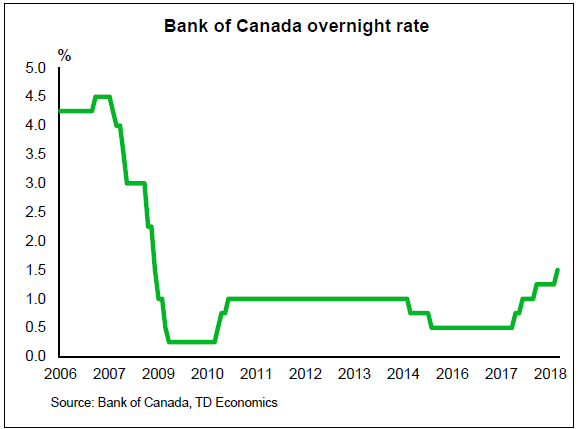
Bank of Canada Rate Decision
Release Date: September 5
Previous: 1.50%
TD Forecast: 1.50%
Consensus: 1.50%
We expect the Bank of Canada to keep policy rates unchanged at its September meeting. Although the Bank will no doubt continue to emphasize a gradual normalization path with a heavy focus on data dependency, we expect the Bank will be encouraged by economic data over the last six weeks. Notably, the housing market has attained a modicum of stability, while Poloz has consistently stated that the Bank will only incorporate tariffs into their forecast when they are implemented. Consequently, we expect to the communique to have a relatively optimistic tone. Residual expectations for a September rate hike almost entirely disappeared after the slightly below consensus reading on Q2 GDP, but markets are still firmly anchored around tightening in October. We expect the September communique to effectively (though not explicitly) affirm market expectations.
International Merchandise Trade – July
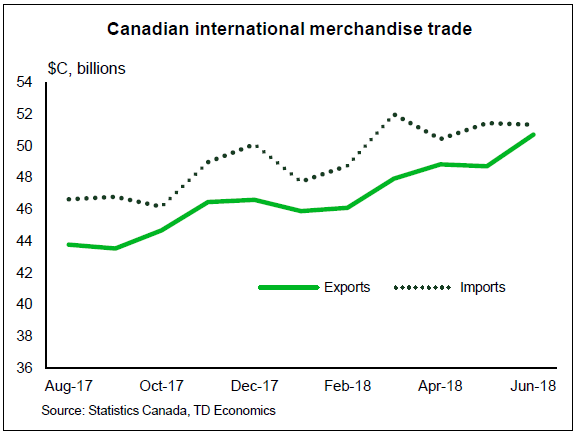
Release Date: September 5
Previous: -$0.63bn
TD Forecast: -$1.0bn
Consensus: -$1.0bn
The international merchandise trade deficit is forecast to widen to $1.0bn in July, giving back some of the previous months' narrowing as imports rebound. Exports should see little change as a pullback in crude oil shipments, caused by shutdowns in the oil sands, offsets stronger non-energy exports. Motor vehicles are the main driver for the non-energy component as presaged by a pickup in US imports. On the other side of the equation, imports will see a drag from retaliatory tariffs on steel, aluminum and a broad range of consumer goods, resulting in only a modest increase for the month.
Canadian Employment - August
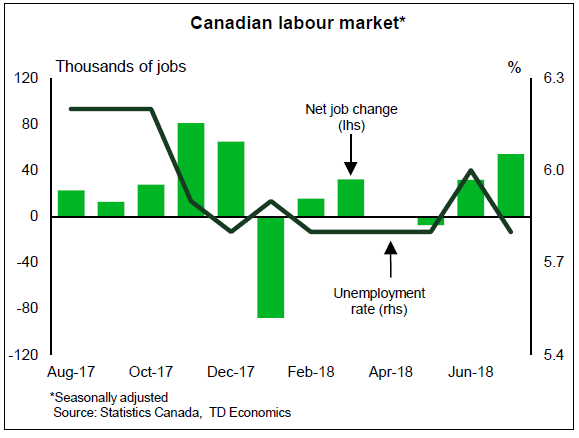
Release Date: September 7
Previous: 54.1k, unemployment rate: 5.8%
TD Forecast: 0k, unemployment rate: 5.9%
Consensus: 0k, unemployment rate: 5.9%
TD looks for employment to remain unchanged in August on a pullback in the public sector. The public sector contributed 50k of a total 54k jobs created last month, and the regional concentration (nearly all were located in Ontario) suggests the presence of a one-off that will unwind. Public sector weakness will likely show up in the industry breakdown via education and health care, which combined to add 67k workers in July for the strongest pace of hiring on record. Private employment should benefit from a rebound in the goods sector after manufacturing and construction shed a combined 30k jobs in July. Our forecast is consistent with the unemployment rate rising to 5.9% while wage growth for permanent workers should edge lower to 2.9% y/y on base-effects.
The Drivers of the Loonie
Highlights
- In spite of a strong Canadian economy and rising domestic interest rates, the Canadian dollar has been trading at a discount relative to its fundamental value largely due to trade risks.
- Our empirical work shows that over the last few years, non-fundamental or idiosyncratic factors are influencing the loonie to a greater degree. We estimate the downside impact of these factors, such as trade risks, to be on the order of about 2-3% currently. That magnitude is down from 5% in June.
- Typical fundamental drivers of CAD are also changing. We show that energy prices are playing a decreased role, whereas yield differentials are increasing in importance.
- While 78 U.S. cents remains our year-end forecast, we would not be surprised to see the loonie temporarily rally towards (or even) above 80 U.S. cents in the near term if trade talks between Canada and the U.S. are successful.
The Canadian dollar has been stuck between two conflicting themes. On one side, the economy has been running ahead of expectations, unemployment is below its natural rate, and inflation has increased to the central bank's target. With this backdrop, the Bank of Canada has kept-up with the Fed in hiking its policy rate 100 bps in a year, providing support to the loonie's nominal value. But, on the other side, Canada has a huge amount to lose when it comes to the U.S. Administration's trade policies. We show that this trade-related uncertainty has been a dominant factor leaving the currency at a significant discount relative to where it would be trading otherwise (Chart 1). Needless to say that there is much at stake at this week's NAFTA talks, where a successful outcome could send the loonie back to its equilibrium value of around 80-82 U.S. cents, at least temporarily.
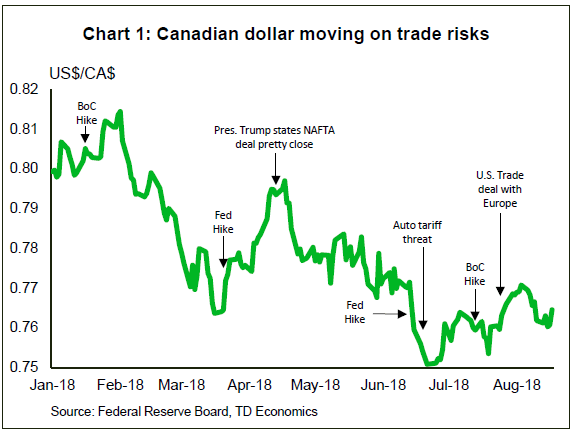
Trade risk holding down the loonie
When looking at trade, the risk to the Canadian economy is greater than that of most major global economies. The U.S. makes up 49.4% of the trade-weighted Canadian dollar index. When Canada is facing a disproportionate economic threat from the U.S., the Canadian dollar adjusts accordingly. It just so happens that the other economies that have been in the tariff purview are also the next most important to Canada with respect to trade - China (13.1% of total), Europe (11.1%), and Mexico (8.5%). Since March 2018, the trade-weighted Canadian dollar has appreciated around 2%, but once you strip out the U.S. dollar from the index, the loonie has appreciated over 6%. We believe that this rally, which attests to Canada's recent economic strength relative to most major economies, has left the Canadian dollar at or above fair-value versus the currencies of major trading partners, with the exception being the greenback.
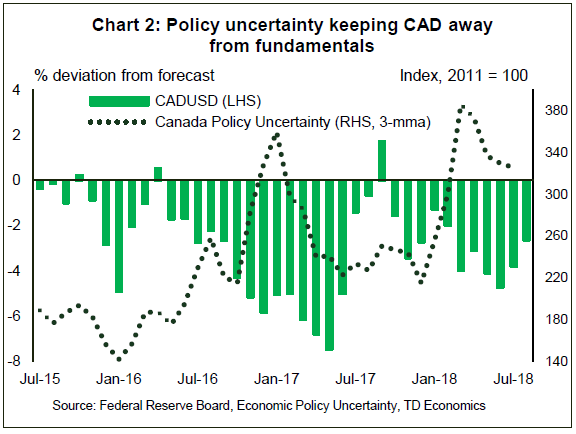
The impact of policy uncertainty on the Canada-US exchange rate can be assessed quantitatively by comparing a standard estimation of fair versus the market value (Chart 2).1 The fundamental equation takes into consideration variables including yield differentials, energy prices, and non-energy commodity prices. From this, we can see that the Canadian dollar is presently about 2 to 3% undervalued, an improvement from undervaluation of 5% back in June 2018 and nearly 8% undervalued in May 2017. In Chart 2, we can see that the largest deviations from fundamentals tend to occur during times of high policy uncertainty.2
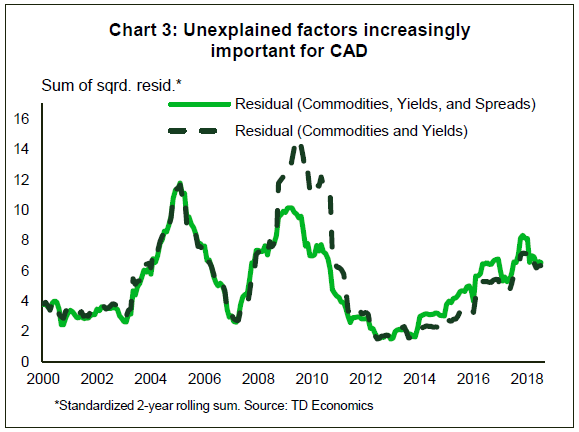
Non-fundamental or temporary factors often influence a currency's value. This is certainly true for the Canadian dollar which has had numerous factors temporarily dominate price movements historically. In Chart 3, we show movements in the Canadian dollar that are not explained by model fundamentals (i.e., the equation residual). This demonstrates that over time, factors other than commodities and yield differentials can come to dictate pricing. Over the last few years, non-fundamental factors have increased in importance. As this is likely largely due to trade risk, if this threat diminishes, the market will focus more on fundamentals dynamics.
The evolving drivers of CAD
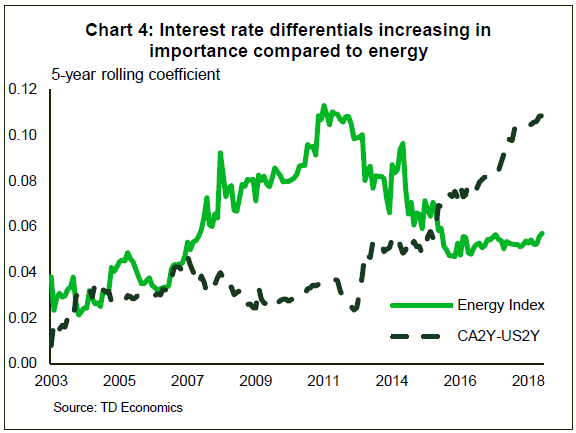
Just as trade and policy uncertainty can increase in importance for the Canadian dollar, even the fundamental drivers can be time variant. In a nutshell, Chart 4 reveals that the impact of energy prices on the Canadian dollar has declined while interest rate differentials have increased.3 This goes along with the Canadian economy's recent transition towards less energy (and commodity) dependence. As this trend is not expected to reverse, it means that even greater focus will have to be given to central bank rate decisions and relative yield differentials. In this regard, the increase in Bank of Canada rate hike odds at its October fixed announcement has been a factor helping pull the loonie off its June lows of around 75 U.S. cents.
Still, the most important influence in the currency's rise back to around 77 U.S. cents has been hopes for a successful trade agreement. If a deal is indeed struck, we would expect significant appreciation in the loonie and even a potential overshoot from the 80-82 U.S. cent equilibrium rate. If not, the trade discount would certainly increase and the loonie could retest the 75 U.S. cent level.
End Notes
The main basis for the equation builds on empirical work conducted at the Bank of Canada over the past two decades that has examined the impact of commodity prices and interest rate differentials on the Canada-US exchange rate (Bank of Canada 1993, 2006, and 2008). Explanatory variables include the Bank of Canada's energy and non-energy indices, Canada/U.S. yield differentials. Our estimation of the original BoC equation is as follows:

Please contact the author for estimation test results.
The Canada policy uncertainty index has statistical significance when added to our Canadian dollar model.
Using the single equations in Endnote 1, we estimate over rolling fixed windows of 2, 3, and 5 years and create a time series (monthly) of the coefficients and t-stats.
References
- Amano, Robert and Simon van Norden (1993), "Terms of Trade and Real Exchange Rates: The Canadian Evidence", Bank of Canada Working Paper No. 93-3.
- Issa, Ramzi, Robert Lafrance, and John Murray (2006), "The Turning Black Tide: Energy Prices and the Canadian Dollar", Bank of Canada Working Paper No. 2006-29.
- Maier, Philipp and Brian DePratto (2008), "The Canadian Dollar and Commodity Prices: Has the Relationship Changed over Time?", Bank of Canada Discussion Paper 2008-15.
With US Stocks Hitting All-Time Highs, Are They Still a Buy?
As US stock indices break fresh highs, the question on everyone’s mind is how much longer the current bull market can continue. The remarkable resilience of US equities to trade tensions and rising interest rates, combined with a robust US economy, suggest the late-cycle party is unlikely to end over the coming months. Looking further ahead into 2019 though, the outlook becomes much more clouded, warranting a more prudent approach.
After an inflation scare spooked equity investors in the early stages of the year, leading to nearly a 12.5% correction lower in both the S&P 500 and the Nasdaq, these major stock indices managed to stage a remarkable comeback – touching fresh record highs in late August. The extraordinary aspect of this recovery was that it occurred despite heightened trade tensions between the world’s largest economies, and in an environment where almost all major central banks are either raising interest rates or have announced plans to withdraw crisis-era monetary stimulus. Higher rates, in turn, push the yields on government bonds higher, rendering bonds increasingly more attractive to hold and curbing some demand for stocks.
To be fair, there are several encouraging factors pulling investors towards US stock markets. First and foremost, the US economy remains robust, easily outperforming all its major counterparts in terms of economic growth. Then, there’s the particularly strong earnings US companies have been reporting in recent quarters, with the latest tax cuts from the Trump administration painting a rosier picture for corporate profitability. Meanwhile, several large firms including the likes of Apple have been using most of the cash the tax overhaul has saved them to increase the amount they allocate to buying back their own shares, thereby propping up their stock prices.
Year-to-date performances
While most major markets rebounded following the late-January tumble, some have recovered much more than others, with US indices and specifically tech stocks being favored by investors. Looking at year-to-date performances, the tech-heavy Nasdaq indices are clearly leading their peers, with the Nasdaq 100 and the Nasdaq Composite being up by 19.5% and 17.2% respectively. For comparison, the S&P 500 has gained 8.5%, while the Dow Jones is higher by 5.1%. Outside of the US, though, major European and Asian benchmarks are struggling. Japan’s Nikkei 225 is up by a fractional 0.4% in the year, Germany’s DAX 30 is down by 3.2%, while the UK’s FTSE 100 is 2.2% lower.
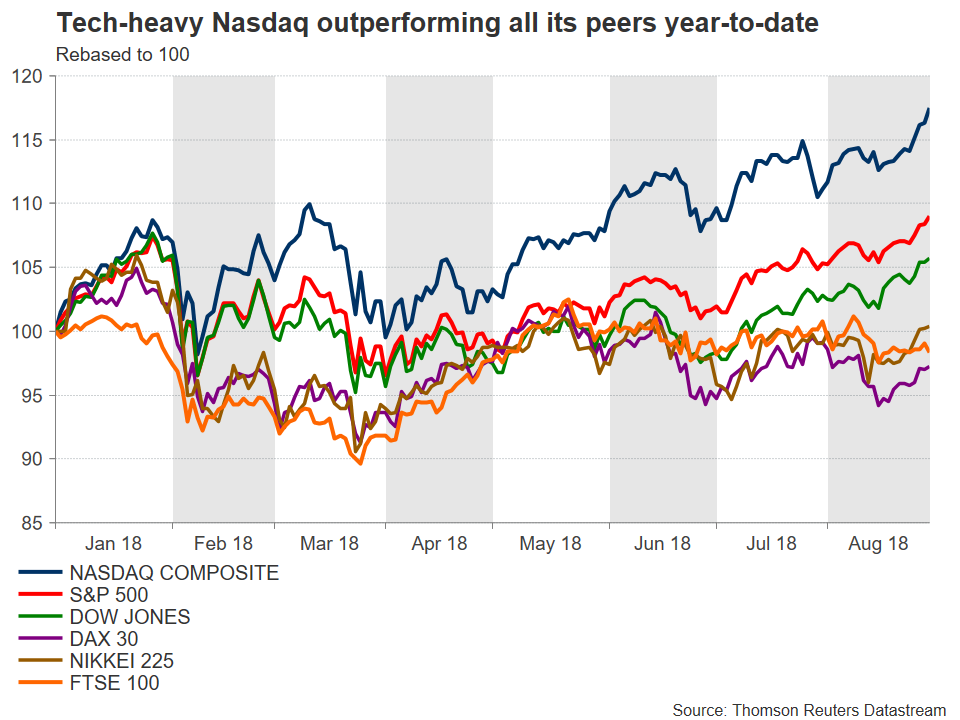
Valuations
Interestingly enough, investors are piling into US markets and tech shares even though these stocks are considered “expensive” by a number of valuation measures. To explain, looking at a simple valuation metric, the one-year forward price to earnings (PE) ratio, the Nasdaq 100 appears to be the most “overvalued” index, with a ratio of 22.5. This ratio denotes the dollar amount someone would need to invest in order to receive back one dollar of earnings. Therefore, the higher it is, the more “expensive” an index or a stock is thought to be. It bears mention though, that a high PE may also be attributed to high growth prospects for a given stock or index.
Next on this list is the Nasdaq Composite, with a forward PE ratio of 21.78. The S&P and the Dow come in at 17.97 and 16.68 correspondingly. For the record, the longer-term average for the S&P 500 rests around the 15.0 mark. Meanwhile, the Nikkei, DAX, and FTSE stand at somewhat more moderate levels of 16.2, 12.9, and 13.3 respectively.
A closer inspection of these measures though, reveals stark differences across sectors, with technology stocks easily outperforming and dragging the broader indices higher. Taking the S&P 500 as an example, while the broader index is up by 8.5% in the year with a forward PE of around 18.0, its sub-index covering IT companies is higher by 19.83% year-to-date with a more elevated PE ratio of 20.8. To answer why the technology sphere is doing so much better than the broader market, it’s fruitful to consider the side-effects a “trade war” could generate. Other things equal, increased trade barriers across economies could hurt companies producing physical goods disproportionally more than those producing digital ones. On top of the extremely high growth and scale potential most tech firms enjoy, this may have been yet another factor drawing investors towards the sector.
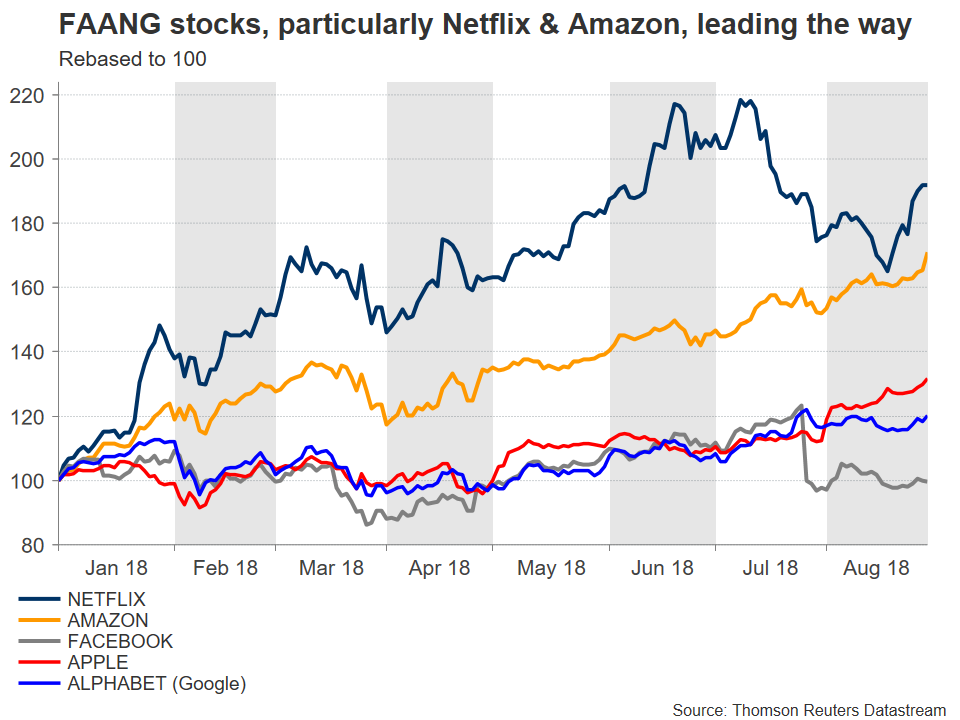
Can the bull run continue, and if not, what could halt it?
Not only are US equity indices like the S&P 500 at all-time highs, the current bull market (dating from March 2009) is now also the longest on record, meaning there has never been a longer period of stock market gains without a 20% downward correction. By itself, this statement doesn’t mean much. Just because a bull market has been running longer than others, does not necessarily imply it has to end soon – it could continue for years still. That said, the combination of all-time highs and the lengthiest bull run has investors questioning whether or not US stocks are still a “buy” from here.
Several factors are likely to determine when, and at what levels, the current rally ends. The obvious risk relates to trade, and the potential for further escalation in tensions. So far though, markets have taken worrisome trade news in their stride, siding with the view that although there may be some turbulence while the US renegotiates its trade relationships, the end-game remains a “grand deal” and not a prolonged trade war. Hence, for US stock indices to materially decline, it may take a much greater escalation in the trade skirmish that impacts the broader US economy, not just the few industries affected so far.
Then, there’s interest rates. As mentioned above, in an environment of central banks raising rates and governments like the US running massive fiscal deficits, bond yields tend to go up – making bonds more attractive as they begin to offer a higher and “safer” return. This typically leads investors to rebalance their equity-to-bonds exposure, thereby curbing demand for stocks. However, this has not transpired either, not yet at least. For all the talk of rising yields by renowned investors like Bill Gross at the beginning of the year, 10-year US Treasury yields remain stubbornly below the 3.0% handle, providing a relatively modest incentive for investors to switch to bonds.
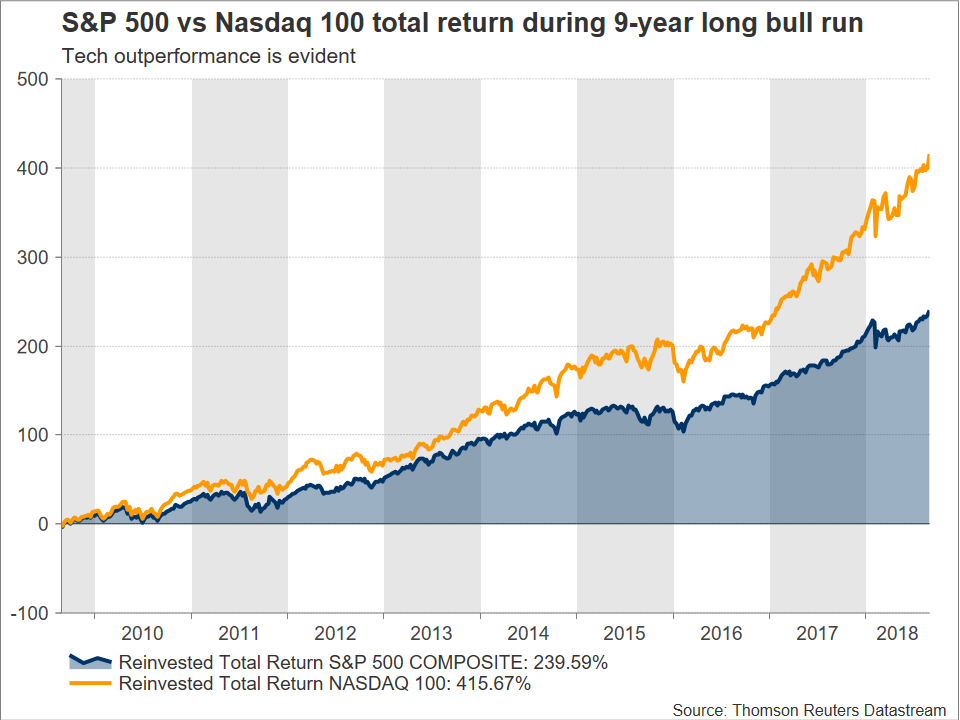
US elections on tap
Another risk event for US stocks are November’s midterm elections for both Houses of Congress. Historically, the party that is outside the White House gains seats in the midterms, and polls so far confirm this trend will likely continue this year. Given that Republicans have traditionally been viewed as market-friendly, Democrats gaining power may weigh on US equity markets, with the magnitude of a potential decline probably depending on how much the Democratic party increases its legislative power.
However, a resulting fall may constitute a knee-jerk reaction, providing opportunities to buy the dip, especially in case of a considerable bearish movement. This, on the expectation that the economy will ultimately not be materially affected. Another scenario that may play out, is that markets overall are not hurt much, with sectoral rotation only taking place. For example, stronger Democrats may be seen by investors as decreasing the odds for deregulation in the banking sector. This, in turn, could result in funds rotating out of financials and into other sectors that are seen as having strong growth potential, for example tech stocks.
Finally, a tail risk for markets – referring to something with a small probability of occurring – is that of a recession or an economic slowdown. Although nothing like that appears imminent, over the next months at least, several pundits are worried that heading into 2019 such risks may grow significantly. The economic cycle is already at a late stage, and combined with increasingly tighter US monetary policy, fading fiscal stimulus, and trade risks, some caution appears warranted.
Bulls remain in charge, but closing of monetary taps generates risks
In the grand scheme of things, the picture for the S&P and the Nasdaq remains bright, for this year at least, with another leg up in the late-cycle rally not to be ruled out. Moving into 2019, however, a more defensive stance may be prudent. The ECB has signaled it will begin raising interest rates late next year, and with the Fed doing the same, that will likely dry up some of the extreme liquidity that has characterized the past years, potentially acting as a drag to further stock market gains and hence creating asymmetric risks for equities.
Technical outlook
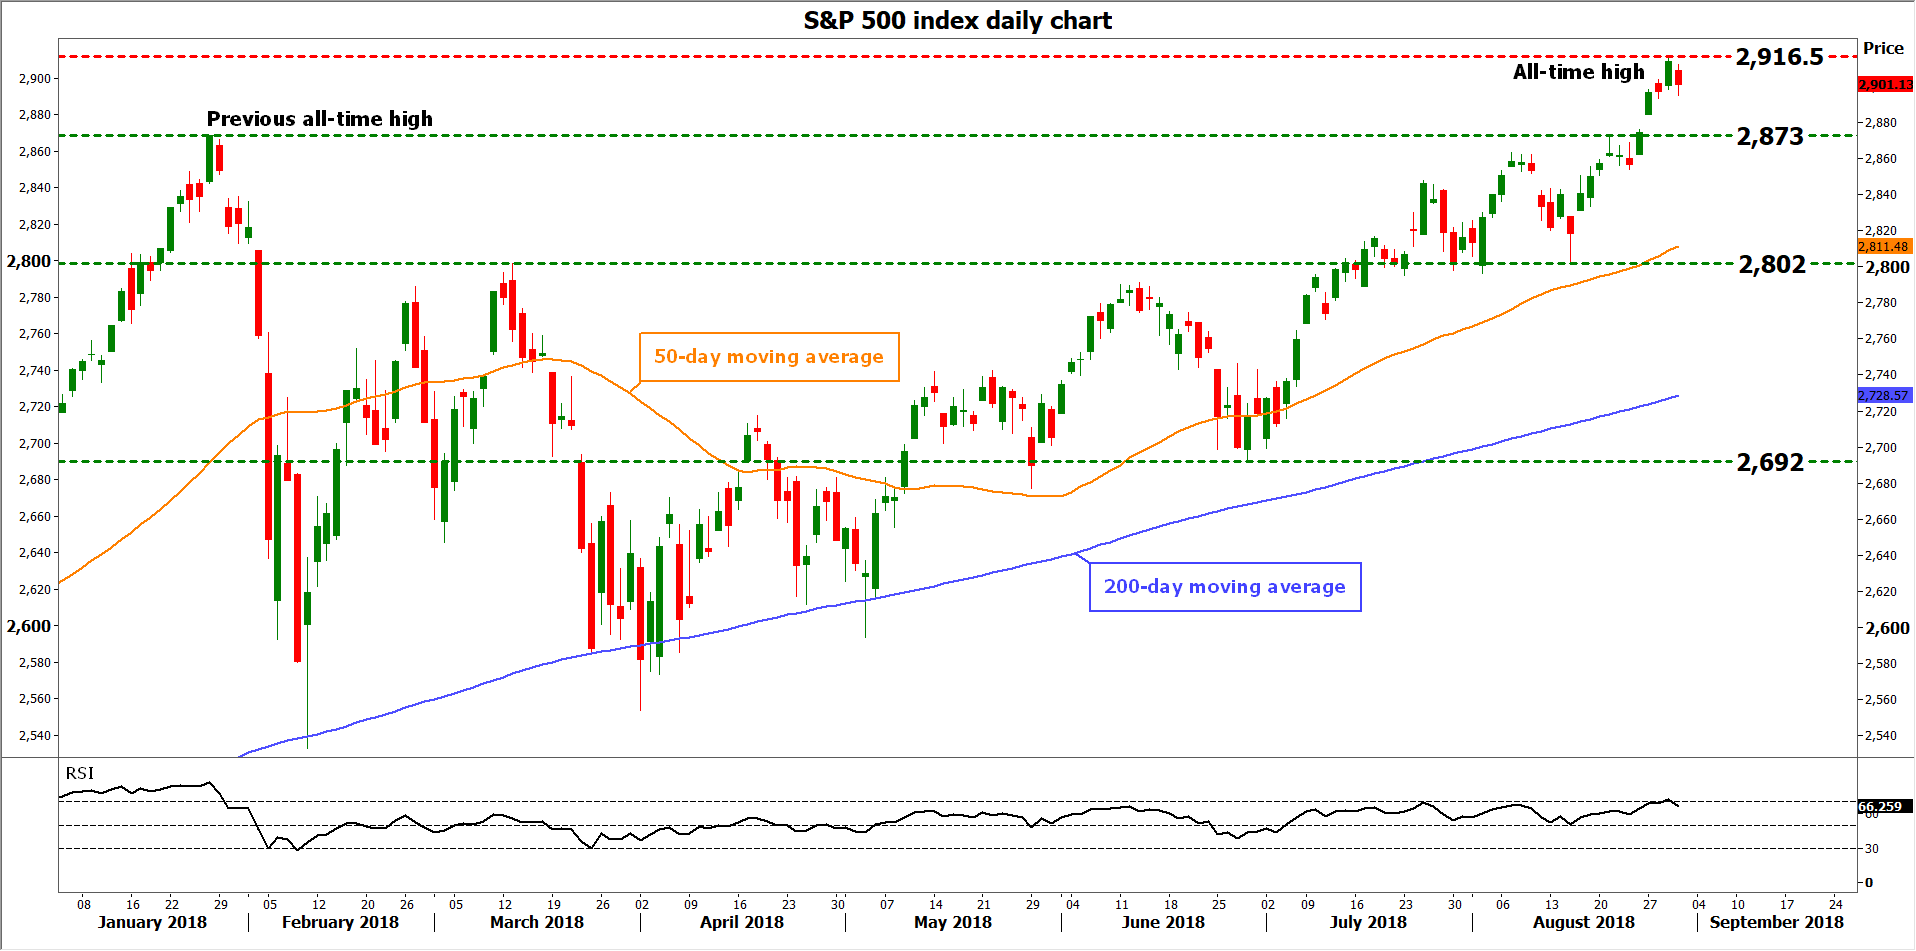
Taking a technical look at the benchmark S&P 500, the index touched a record high of 2,916.5 on August 29, and has since pulled back slightly. The price structure on the daily chart remains higher highs and higher lows above both the 50- and the 200-day moving averages and hence, the broader bullish trend appears intact. That said, short-term oscillators like the RSI suggest positive momentum may be losing steam, generating the risk that the latest retreat may continue in the immediate term.
In case of a correction lower, immediate support to declines may be found near the previous all-time high of 2,873, recorded on January 26. A downside break could open the way for the 2,802 area, marked by the lows of August 15 – with the round figure of 2,800 and the 50-day moving average at 2,811 also being part of this area. Even lower, declines may stall near 2,692, the June 28 trough.
On the upside, a break above the all-time high of 2,916.5 would bring the index into uncharted territory, with the next figure to offer resistance potentially being the psychological number of 3,000. If the bulls pierce it, then the attention would increasingly turn to the 3,084 hurdle, which is the 161.8% Fibonacci extension of the January 29 – February 9 drop, with a high at 2873 and a low at 2532.
Australia & New Zealand Weekly: Overall Activity Conditions Robust, But Wages Remain Weak
Week beginning 3 September 2018
- Q2 GDP, preview: overall activity conditions robust, but wages remain weak.
- RBA: policy decision, Governor Lowe speaks at RBA Board Dinner.
- Australia: Q2 GDP and Q2 partials, current account, trade balance, retail sales, CoreLogic home prices, housing finance.
- NZ: terms of trade, building work.
- China: Caixin PMI's, foreign reserves.
- Europe: GDP 3rd estimate.
- US: nonfarm payrolls, NY Fed President Williams speaks, ISM's, Labor Day.
- Central banks: BoC and BNM policy decisions.
- Key economic & financial forecasts.
Information contained in this report current as at 31 August 2018.
Q2 GDP Preview: Overall Activity Conditions Robust, But Wages Remain Weak
Reserve Bank in focus
The Reserve Bank Board meets this Tuesday and is certain to leave rates on hold at 1.50%. Rates have been unchanged since a 25bps cut in August 2016, with the most recent hike in November 2010.
The decision statement by RBA Governor Lowe is likely to be little changed from that in August. The key line in the closing paragraph will be repeated, namely: "Further progress in reducing unemployment and having inflation return to target is expected, although this progress is likely to be gradual".
As we have highlighted previously, despite this stability in the RBA cash rate, lending conditions in the housing market have tightened. The authorities have actively used macro-prudential measures, largely focused on investors, while short-term rates have moved higher, evidence of increased funding costs. New lending for housing is declining and established property prices are easing, modestly to date, following strong gains - developments which will likely weigh on the economic outlook.
Westpac Economics continues to expect the RBA cash rate to remain on hold throughout 2018 and 2019, as well as in 2020, as set out in the recent update by Chief Economist Bill Evans.
On Tuesday evening, the Governor will speak at the dinner of the Reserve Bank Board. His remarks are likely to be both reflective and broad ranging as they were at corresponding events in other capital cities. Dr Lowe is of the view that: "the next move in the cash rate would more likely be an increase than a decrease", a line he may well repeat. The Governor will reflect on key challenges and uncertainties, notably, around the consumer, weak wages, high household debt and housing.
This is also an opportunity for the Governor to emphasise current positives: economic growth over the past year was above trend, at 3.1%; inflation is in the target band, at 2.1%; and unemployment has declined to a six year low, 5.3%.
The most significant achievement of the Australian economy over recent years is the successful rotation through the growth drivers, from the mining investment boom, to a strong upswing in home building, and now to strength in construction activity across the rest of the economy. We are investing in our cities to meet the needs of a rapidly growing population, particularly in Melbourne and Sydney. Notably, we are investing in: much needed transport infrastructure; energy, with a focus on renewables; and offices (with vacancy rates at a decade low), as well as hotels and student accommodation, in response to strong demand from international visitors and foreign students.
We would emphasise the divergence in output trends from that of incomes. National income growth has generally been sub-par since late 2011, when the terms of trade and commodity prices for some of our exports were at their peak, at the height of the mining boom. Importantly, wages growth is weak, constraining consumers, and is likely to remain so given arguably still considerable slack in the labour market.
Q2 National Accounts
On Wednesday, the National Accounts will provide an estimate of economic activity for the period April to June. For the June quarter, we expect output growth of 0.6%, trimming annual growth to 2.7%, a trend pace.
By way of context, the March quarter was a strong one, with a 1.0% quarter and annual growth of 3.1%. The quarterly result included a sizeable positive contribution from inventories and net exports, with a combined impact of 0.5ppts. A repeat of this appears unlikely, which suggests that overall output growth in Q2 will fall short of the 1% mark. The annual result to March of 3.1% benefited from a hiring burst in 2017. Jobs growth was an unsustainably brisk 3.4% in 2017, in part a catch-up after a hiring pause around the July 2016 Federal election. In 2018, jobs growth has throttled back, to be running at a still robust 1.7% annualised pace for the year to date.
The arithmetic of Q1 GDP was: domestic demand, 0.6%; inventories, +0.2ppts; net exports, +0.3ppts; and statistical discrepancy, -0.1ppt (i.e. the expenditure estimate of GDP was a little stronger than the income and production measures).
For our Q2 GDP forecast of 0.6%, the arithmetic is: domestic demand, 0.6%; inventories, -0.2ppts; and net exports, +0.1ppt. Domestic demand is likely to show gains across the consumer, home building and public demand, but be constrained by flat business investment - as discussed in more detail below.
Labour market developments were mixed in the June quarter, adding to uncertainty around wage incomes and GDP. Hours worked increased by a brisk 1.0%, to be 2.8% above the level of a year ago, while employment (on a mid-month of quarter basis) grew by only 0.2%, to be 2.7% higher over the year.
On the consumer, accounting for 57% of domestic demand, the national accounts provide us with a detailed update on spending, saving and incomes. As noted above, a key ongoing headwind is weakness in wages growth, in part due to compositional shifts in the labour market, at a time of high debt levels. More recently, property prices have eased and jobs growth has moderated, while the household savings rate has declined to relatively low levels. In this environment, consumer spending lifting to an above trend pace appears unlikely.
On national income, the June quarter was a less favourable one, with the terms of trade declining by an estimated 1.3% in the period, albeit still leaving it some 2% above the level of a year ago. For nominal GDP, we expect a Q2 outcome of 0.8%qtr, 4.6%yr, a sub-par annual pace.
The Business Indicators survey, on Monday, will provide some partial information on official estimates of incomes for the quarter, including an update on wage incomes and profits, key inputs into our GDP(I) view. The mixed labour market signals for the quarter add to uncertainty around wage incomes for the period.
Q2 GDP, detail
Household consumption (0.7%qtr, 2.7%yr): Consumer spending remains choppy, with a modest start to 2018, +0.3% in Q1, following a strong end to 2017, +1.0% in Q4. Annual growth is 2.9% currently, which is a little below par. Spending on a per capita basis is less impressive and is arguably lacklustre. For the June quarter, we expect a solid 0.7% increase, centred on a burst of retail spending, +1.2%. Car sales appear to have eased in the quarter and spending on services has been mixed of late.
Dwelling investment (+1.6%qtr): Home building activity added to growth over the first half of 2018, in contrast to the 5% decline for 2017. This profile for activity is consistent with that of dwelling approvals. Going forward, approvals are expected to moderate from current record highs, to bring them more into line with underlying requirements.
New business investment (flat qtr, 2.7%yr): Investment turned the corner in 2017, after four years of decline, with a diminished drag from mining and an uptrend in non-mining investment. Over the first half of 2018, investment consolidated, with a flat Q1 result and a likely flat Q2 result. Mining capex fell as work on the remaining gas projects under construction is now largely complete. Non-residential building rose, so too spending on computer software and systems, while equipment spending dipped.
Public spending (1.0%qtr, 5%yr): Government spending, in the form of public demand, is expanding at a brisk 5% annual pace. Public demand directly added 1.3ppts to activity over the past year, with additional significant positive spill-over effects. This dynamic is key to what are currently relatively robust conditions for the economy as a whole. We expect a further 1% increase in public demand in the June quarter.
Public investment is expected to increase by around 2.5%qtr, 9.4%yr in Q2, with a focus on transport infrastructure, as well as investment across social infrastructure. Public consumption (including spending on health and education) is also increasing at a well above trend pace, with a Q2 forecast of 0.6%qtr, 4.2%yr.
Net exports (+0.1ppt, -0.6ppts yr): Net exports are expected to be a positive, albeit making a smaller contribution than in Q1, at a forecast 0.1ppt. Export volumes advanced by an estimated 0.6%, including gains across services, rural goods and resources, partially offset by a dip in manufactured items. By contrast, exports rebounded in Q1, after a weak end to 2017. Imports were broadly flat in Q2, we estimate, with weaker services (associated with rising prices) offsetting a rise in goods.
Private non-farm inventories (+0.3%, -0.2ppts contribution): For the June quarter, we anticipate a two-fold correction: (1) for wholesale and retail, a draw-down of inventories after the sharp run-up; and (2) across the rest of the economy, a return to a more typical inventory increase in response to growing demand. On balance, we expect inventories to increase by 0.3%, implying a slight drag on growth in the quarter, of around -0.1ppt (potentially rounding to -0.2ppts).
Outlook
Turning the focus to the outlook, in particular to 2019, the RBA and Westpac views diverge.
The RBA is expecting growth of 3.25%, including consumer spending at around 3%, an environment which would likely see the unemployment rate move lower.
Westpac Economics is instead forecasting GDP growth to slip to a below trend pace of 2.5%. Current challenges and uncertainties are likely to persist in our view, notably weak wages growth, with consumer spending expected to slow to 2.5%.
Home building activity, rising over the first half of 2018, is likely to moderate during 2019, down from historic highs. At the same time, house prices are likely to remain under pressure given tighter lending standards. Uncertainty ahead of the upcoming Federal election, due by May 2019, is another risk. In addition, the global backdrop is expected to be less favourable, as world growth moderates and with commodity prices forecast to ease from current elevated levels.
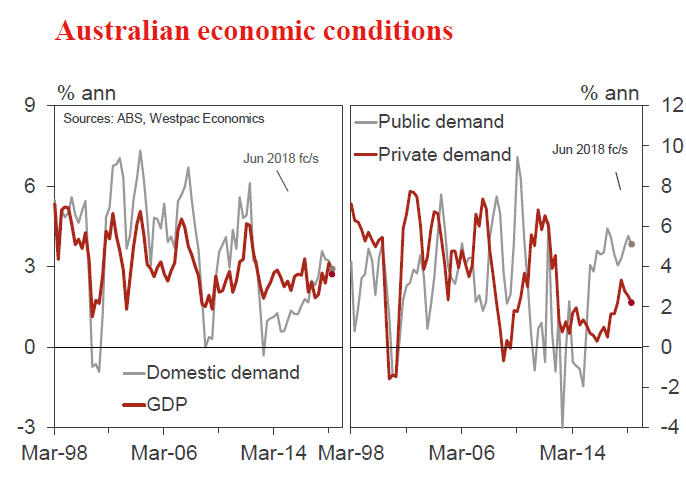
The week that was
This week, investment has been in the spotlight for Australia ahead of next Wednesday's June quarter GDP report.
Following on from last week's construction work done release (which focused on non-residential construction), the release of this week was the CAPEX survey. Importantly, the CAPEX survey not only provides guidance on equipment investment for the current quarter ahead of GDP but also investment intentions for the mining, manufacturing and services industry for the 2018/19 financial year - across both equipment and construction activity.
On the current quarter, this release was disappointing. While a 1.0% rise in equipment spending was expected, a 0.9% fall was instead reported. For June quarter GDP, this result offset upside risks we had seen to our 0.6% GDP forecast for the June quarter (see our Australia & NZ Weekly later today for a full preview). Taking a longer-term view however, it should be emphasised that the disappointing June quarter outcome follows strength over the past 12 months. The trend therefore remains positive. By industry, in the June quarter, total capital expenditure (for equipment and construction) fell 7% for mining; pulled back 0.9% in the service sector - after 18 months of gains; but rose 2.8% in manufacturing.
Looking ahead, estimate 3 for 2018/19 CAPEX expectations was a broadly neutral outcome, being consistent with a 1% decline on the comparable estimate for the 2017/18 financial year. That said, the industry detail was on the soft side, with the allimportant service sector expectation now flat (previously +5%) and the projected gain for manufacturing having halved, from +6% three months ago to +3% currently. Mining was a partial offset however, now -4% versus -6% three months ago. If we are to see above-trend growth in Australia, we must see an improvement in non-mining business investment. The problem is that this is will prove difficult if growth in consumer spending remains subdued.
The other key outcome for Australia this week was dwelling approvals. July was another volatile read, with total approvals down 5% as high-rise approvals plunged 20%. Volatility on this scale is typical of approvals, making short-term assessments of momentum difficult. As such, while the high-rise outcome is in keeping with our expectation of a further move lower in construction activity in this sub-sector, it will take time to confirm the trend. Lending standards have been materially tightened by regulators, and this looks set to remain a material headwind for the sector through this year and next, particularly in Sydney and Melbourne.
Turning then to the US, it has been a quiet week for data, with July personal income and spending the highlight. In that report, we saw no real surprises, as income and spending remained robust in the first month of the September quarter, rising 0.3% and 0.4% respectively. For spending however, it is important to highlight two things: higher interest rates are weighing on durables spending; and secondly, while robust, the pace of spending growth in the second half of 2018 will be materially below that of the June quarter, which benefitted from delayed activity from a weather-affected March quarter.
Taking a longer-term view, we expect tighter financial conditions to progressively weigh on the US economy over the coming year. FOMC Chair Powell highlighted at the Jackson Hole Symposium last weekend that the Committee are intent on at least taking policy back to a neutral setting, albeit while being mindful not to overreact to or pre-empt inflation. If we are correct in our belief that neutral equates to a fed funds rate of around 2.5%, then the three hikes to March 2019 we are forecasting will take policy there (a mid-point of 2.625%), and that of June 2019 beyond that benchmark. Along with the end of fiscal stimulus in September 2019, financial conditions will slow US growth back to trend (1.7%) from nearer 3% to March 2019. Given trade tensions, it will also be important to continue assessing the US' investment pulse as we move into and then through 2019.
On trade tensions, preliminary agreement between the US and Mexico to replace or amend NAFTA (depending on if Canada joins negotiations or not) gave support to financial markets this week. However, overnight there has been reports that President Trump will push ahead with the next wave of tariffs on China as early as next week after the consultation process ends. This round of tariffs (10% to 25% on $200bn of imports from China) would dwarf prior actions, and also see China retaliate with new tariffs on $60bn of imports from the US. We continue to emphasise that the initial trade shock of these tariffs on both nations is unlikely to be material. Our focus is instead on the potential impact on investment from 2019 on. The rise of protectionism has the potential to hold businesses back from investing in new capacity not only in the US and China, but also across the world given we live in the era of globally integrated production.
Chart of the week: capex plans
2018/19 capex plans Estimate 3 printed at $102bn, which is -1% vs Est 3 a year ago. The $102bn figure is a relatively neutral update (in terms of the headline figure), broadly in line with Estimate 2, $88bn.
Using calculations based on average realisation ratios (RRs), we estimated that Est 3 implies capex spending in 2018/19 will be 2.7% lower than in 2017/18. This is in line with the -2.3% implied by Est 2, hence our interpretation of a relatively neutral headline. By industry, we estimate: mining -12% (vs -19% 3 months ago); services +1% (vs +6%) and manufacturing -1% (vs +0.5%).
In terms of key themes, mining investment will move lower in 2018/19, while non-mining investment is in an uptrend.
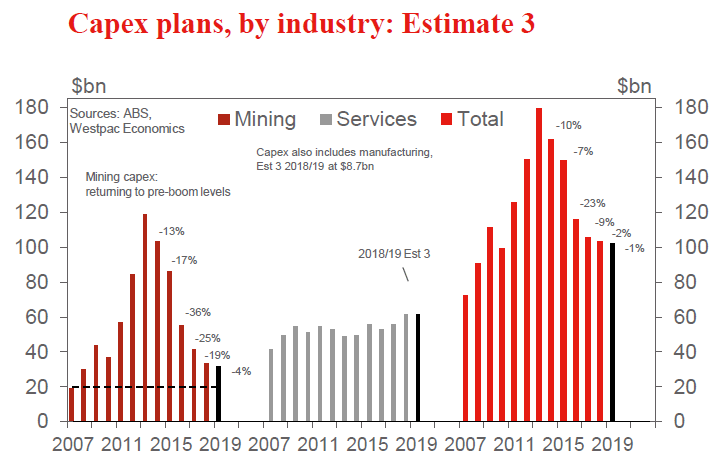
New Zealand: week ahead & data wrap
Elephant in the room
Business confidence has fallen sharply in recent months, despite an economy that appears to be mixed rather than catastrophic. We suspect that some of this reflects firms' concerns about the planned changes to industrial relations policies, and the Government has started to move towards addressing those concerns.
The ANZ Business Outlook survey for August saw general business sentiment fall further to a net -50, setting a fresh tenyear low. Firms' own-activity expectations, which correspond more closely with GDP growth, were unchanged for the month. But they remain at their lowest level since 2009, when the economy was just starting to pull out of the Global Financial Crisis.
There is an open question as to how to interpret business confidence surveys. On the one hand, they can provide timely warnings of a genuine downturn (or an upturn) in the economy. On the other hand, respondents are not obliged to give an unbiased assessment. As we've noted before, the ANZ survey is particular tends to be biased downwards under Labour-led governments, after accounting for economic conditions at the time. However, even if opinion surveys are politically slanted, there is still cause for concern if firms act on those views by cutting back on investment and hiring.
Economic growth has clearly slowed from its 2016 peak, as some of the previous drivers of growth - population growth, earthquake reconstruction, and rising house values - have faded. But the weight of evidence points to a shift to more modest growth rather than the recessionary levels that the business confidence survey implies.
Indeed, the next GDP report is likely to be quite upbeat - we expect a 1% rise for the June quarter. Some of that simply reflects the volatility of quarterly data, but there have been some genuine signs of improvement as well. And looking a bit further ahead, we expect increased government spending and transfers to give the economy a temporary fillip over the coming year. We are forecasting 3.1% growth over 2019, up from 2.9% in 2018.
So what is driving this steep fall in business confidence? We see parallels with mid-2000, dubbed the "winter of discontent". Then, a newly minted Labour-led Government was attempting to pass the Employment Relations Act, which among other things, placed a greater emphasis on collective bargaining between employers and unions. Business confidence was little changed in the first few months of the new Government, but then plunged in May. The legislation was passed in August, and by November confidence had recovered to its previous level.
The current Labour-led Government is also aiming to shift the bargaining power further towards workers (though the changes will not be as substantial as the 2000 legislation, which largely remains in place today). The planned changes include increasing unions' access to workplaces, "fair pay" agreements in some industries, and multi-employer collective agreements. Not surprisingly, these changes are not proving popular with employers or business organisations.
The speech by Prime Minister Ardern this week came closer to acknowledging this issue as a source of the negativity expressed in business confidence surveys. Part of the problem is that the ongoing work to develop these policies has left something of an information vacuum as to how they will work.
In an attempt to soften these concerns, the Prime Minister has committed to no more than one or two industry-level fair pay agreements within the Government's current three-year term. She also reaffirmed that the legislation will not allow for strike action by workers as part of fair-pay negotiations.
That still leaves unresolved the framework for these agreements, including the extent of political involvement. In Australia this is handled by the Fair Work Commission (FWC), an independent tribunal that handles a range of industrial relations functions. The FWC determines industry 'awards', which in most cases are effectively a hierarchy of minimum wage rates by job level. It also sets the national minimum wage each year - a decision that is made by the central government in New Zealand (and has already been more or less decided for the next three years, as part of the Government's coalition agreement).
Despite these lingering uncertainties, it will be interesting to see if the Government's willingness to address concerns about labour relations will lead to an improvement in future confidence surveys. In the meantime, we'll be watching the near-term data closely for any signs that confidence is having a real impact on activity. Recent indicators of retail spending, job advertisements and capital imports have remained positive, and building consents show a rapidly growing pipeline of homebuilding work in Auckland, where a housing shortage has been most apparent.
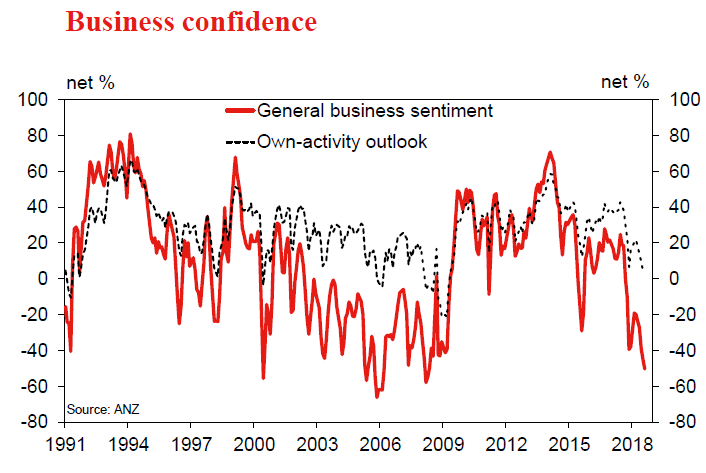
Data Previews
Aus Aug CoreLogic home value index
- Sep 3, Last: -0.6%, WBC f/c: -0.4%
Australia's housing market continues to correct. The CoreLogic home value index, covering the eight major capital cities, fell 0.6% in July to be down 2.4%yr and 2.8% from its peak in September last year.
The correction continues to be concentrated in the previously strong Sydney and Melbourne markets with Perth's longer running period of price declines also continuing. All major capital cities except Brisbane recorded price falls in July with notable weakness in Melbourne (-0.9%mth) and Perth (-0.8%mth).
The daily index suggests slippage continued in August, but at a milder pace, prices nationally down about 0.4% taking the annual pace of decline to -3%yr.
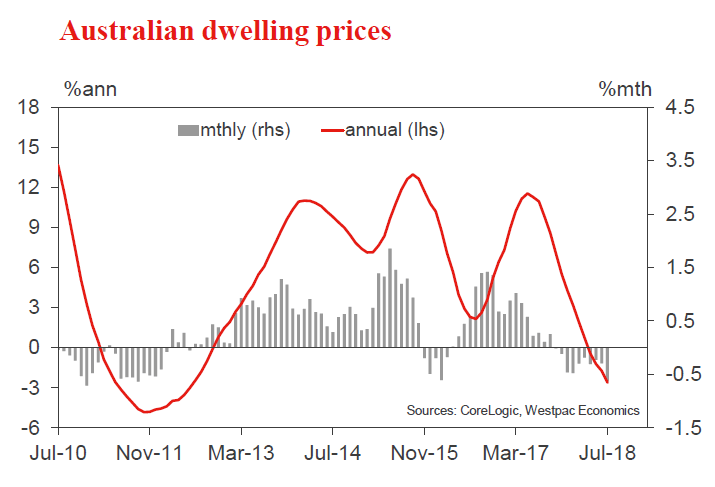
Aus Jul retail trade
- Sep 3, Last: 0.4%, WBC f/c: 0.3%
- Mkt f/c: 0.3%, Range: -0.1% to 0.6%
Retail sales posted a third consecutive 0.4% gain in June, the run of reasonably solid gains following a difficult March quarter that saw nominal sales up just 0.6%qtr. The store-type detail showed reasonably solid gains for most categories in the June month with some give back for department stores more than offset by gains for food; household goods and clothing retail.
Indicators were uneven in July. Consumer sentiment posted a surprise rally to a 5yr high boosted by the government's tax package passing into legislation. Private business surveys were mixed, retail responses to the NAB survey suggesting conditions dipped back into negative in the month but the AIG PSI suggesting some improvement. On balance, we expect July to show a 0.3% gain. Note that price discounting pressures look to have eased a touch and may ease further with GST changes on July 1 that mean low value imported goods will now be taxed.
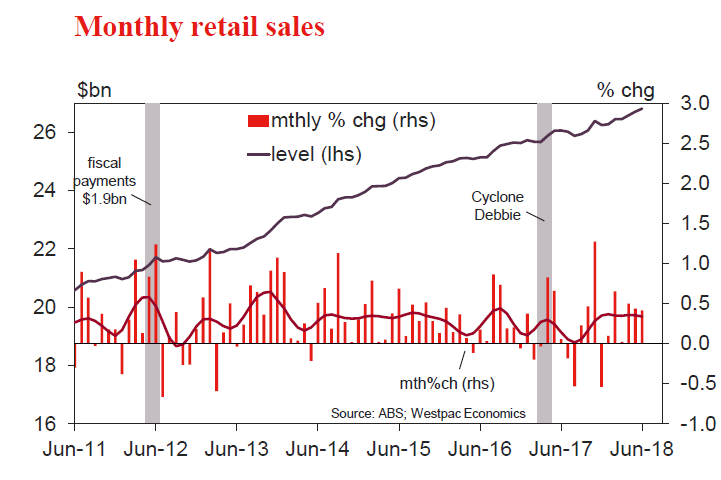
Aus Q2 company profits
- Sep 3, Last: 3.4%, WBC f/c: 1.0%
- Mkt f/c: 1.3%, Range: -1.0% to 3.0%
Companies have been enjoying rising profits as the Australian economy expands at an above trend pace, thereby encouraging firms to boost investment.
In the March quarter, profits jumped by 5.9% to be 48% above the level of two years earlier. Mining profits surged 122% over the two years, on higher commodity prices, and non-mining profits climbed by 25%, the strongest two year performance since the GFC.
The uptrend in profits likely extended into the June quarter, increasing by a forecast 1%, including a 0.5% rise in mining profits and a 1.2% gain in non-mining profits. That would see total profits 10% above the level of a year ago.
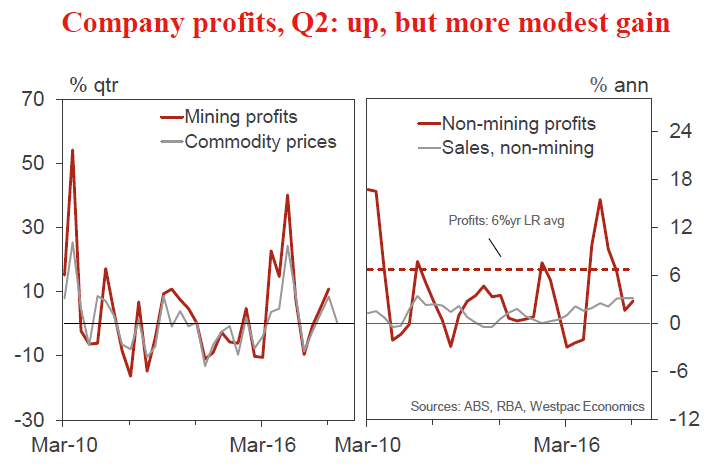
Aus Q2 inventories
- Sep 3, Last: 0.7%, WBC f/c: 0.3% (-0.1ppt)
- Mkt f/c: 0.2%, Range: -0.2% to 0.9%
Over the past year, inventories increased by a relatively modest 0.6% with a choppy quarterly profile.
The March quarter outcome was an oversized 0.7% increase in total inventories, inflated by a near $1.4bn run-up in inventories for wholesale and retail. Across other sectors, inventories had a soft result, down 0.3% to still be 2.6% above the level of a year ago.
For the June quarter, we anticipate a two-fold correction: (1) for wholesale and retail, a draw-down of inventories after the sharp run-up; and (2) across the rest of the economy, a return to a more typical inventory increase in response to growing demand.
On balance, we expect inventories to increase by 0.3%, implying a slight drag on growth in the quarter, of around -0.1ppt (potentially rounding to -0.2ppts).
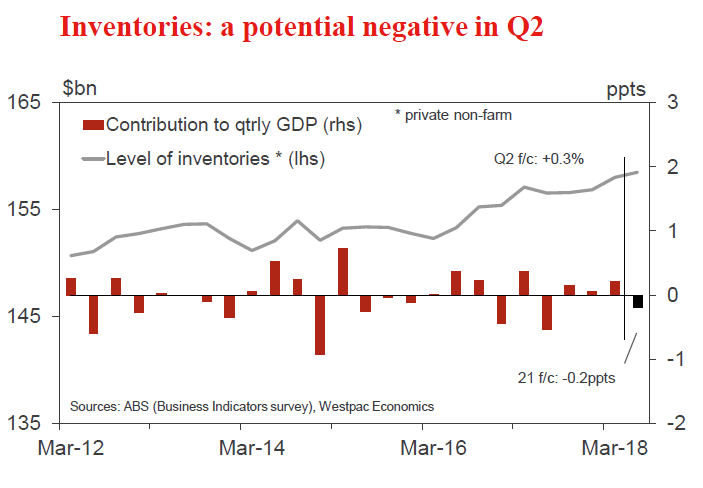
Aus Q2 current account, AUDbn
- Sep 4, Last: -10.5, WBC f/c: -11.5
- Mkt f/c: -11.0, Range: -13.0 to -9.0
Australia's current account deficit fluctuated over the past year, buffeted by the impact of commodity price volatility on export earnings. The quarterly deficit widened from $11.7bn last September to $14.7bn in December, reversing to $10.5bn in March.
For the June quarter, the deficit is expected to be $11.5bn.
A $2.9bn trade surplus was recorded in Q2, down from $4.1bn in Q1 (subsequently revised lower to $3.35bn). Export earnings rose by 2%, eclipsed by a 2½% increase in the import bill, boosted by higher energy prices. Notably, the terms of trade declined by an estimated 1¼%.
The net income deficit is expected to consolidate at $14.4bn, after widening by $1bn to $14.6bn in Q1. Over the past couple of years, the income deficit has increased on rising returns to foreign investors in the mining sector.
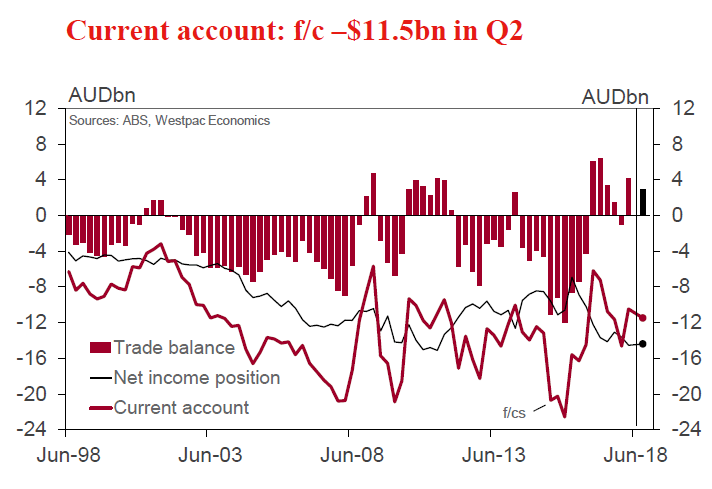
Aus Q2 net exports, ppts cont'n
- Sep 4, Last: +0.3, WBC f/c: 0.1
- Mkt f/c: 0.1, Range: 0.0 to 0.3
Net exports have been volatile of late largely because of a choppy export profile, in part reflecting supply disruptions to shipments (notably for coal).
In the March quarter, net exports added 0.35ppts to activity as export volumes rebounded, up 2.4%, following a soft end to 2017, down 1.5% in Q4.
For the June quarter, net exports are expected to be a positive, albeit making a smaller contribution than in Q1, at a forecast 0.1ppt.
Export volumes advanced by an estimated 0.6%, including gains across services, rural goods and resources, partially offset by a dip in manufactured items.
Imports were broadly flat, we estimate, with weaker services (associated with rising prices) offsetting a rise in goods.
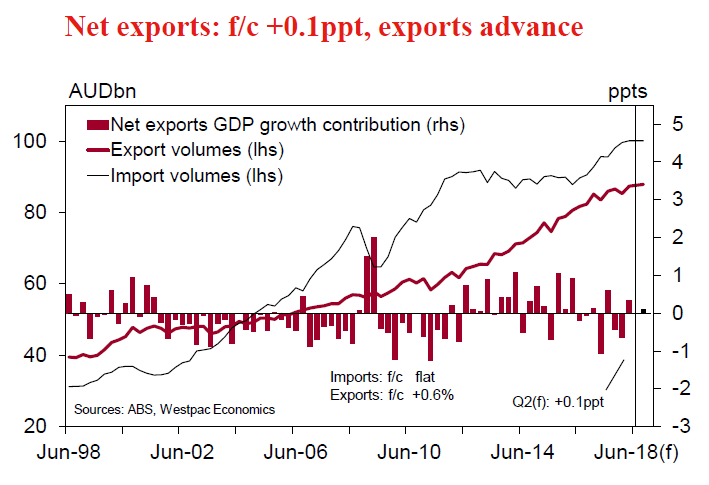
Aus Q2 public demand
- Sep 4, Last: 1.5%, WBC f/c: 1.0%
The public sector - directly accounting for almost a quarter of the economy - is a key growth driver, expanding at a well above trend pace in 2015, 2016 and 2017, with annual growth at 4.8%, 5.5% and 5.0%, respectively. This brisk momentum has extended into 2018.
Public investment is trending sharply higher, off low levels, with a focus on long overdue transport projects. Health spending (included in 'consumption') is also moving higher.
Total public demand grew by 1.5%qtr, 5.5%yr in Q1, with investment 7.4% higher over the year and consumption 5.1% up on a year earlier.
For the June quarter, we anticipate a robust 1.0% rise in public demand, including a further 2.5% increase in investment spending.
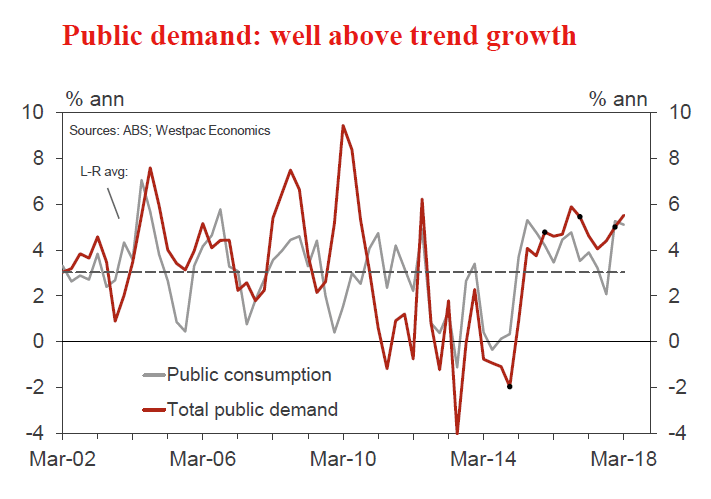
Aus RBA policy decision
- Sep 4, Last: 1.50%, WBC f/c: 1.50%
- Mkt f/c: 1.50%, Range: 1.50% to 1.50%
The RBA will hold rates unchanged at their September meeting, as they have since they last cut rates in August 2016. The Governor's decision statement will repeat the line that: "further progress in reducing unemployment and having inflation return to target is expected, although this progress is likely to be gradual".
Economic growth over the past year was above trend, at 3.1%; inflation is in the target band, at 2.1%; and unemployment has declined to a six year low, 5.3%.
However, uncertainties and challenges remain, notably around the consumer, weak wages growth, high household debt levels and housing, as prices ease a little following strong gains and as lending conditions tighten.
We expect the RBA cash rate to remain unchanged at 1.50% throughout 2018 and 2019, and now as well during 2020.
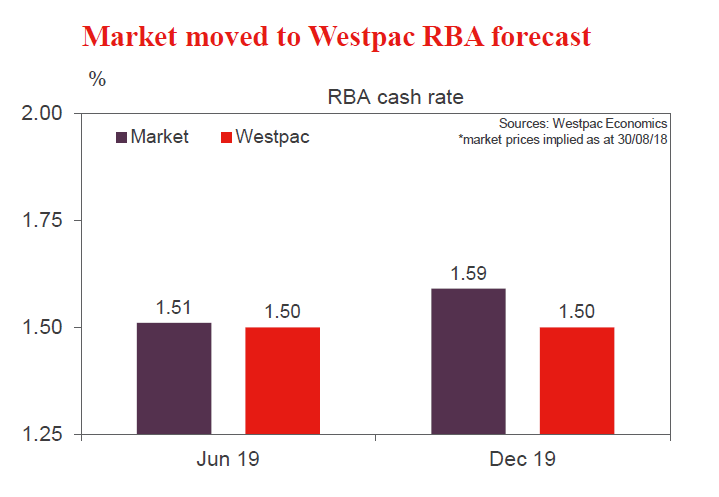
Aus Q2 GDP
- Sep 5, Last: 1.1%qtr, 3.1%yr; WBC f/c: 0.6%qtr, 2.7%yr
- Mkt f/c: 0.7%, Range: 0.5% to 1.0%
The economy expanded by an above trend 3.1% in the year to March 2018, with domestic demand increasing by 3.2% and net exports subtracting 0.2ppts from activity.
The March quarter was a strong outcome, with output up by 1.0%. Half of this growth was accounted for by inventories (0.2ppts) and net exports (0.3ppts).
For the June quarter, we expect GDP of 0.6%qtr, 2.7%yr.
The arithmetic is: domestic demand, 0.6%; inventories, -0.2ppts and net exports, +0.1ppt.
Consumer spending, f/c 0.7%; home building activity, f/c 1.6%; and brisk public demand, f/c 1.0%qtr, 5.0%yr; all likely advanced in the period. Business investment is expected to be flat, dented by a decline in mining capex, but is still up on levels of a year ago.
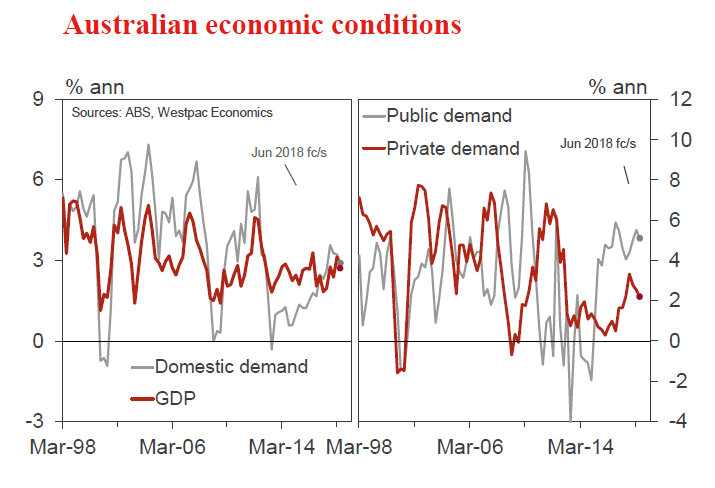
Aus Jul trade balance, AUDbn
- Sep 6, Last: 1.9, WBC f/c: 1.5
- Mkt f/c: 1.5, Range: 0.9 to 1.9
Australia's trade account has been in surplus each month so far in 2018.
In June, the surplus jumped by a little in excess of $1.1bn to $1.9bn. Export earnings increased by 2.6%, with relatively broad based gains.
For July, we expect a modest reversal, with the surplus narrowing to a forecast $1.5bn.
Export earnings are expected to edge 1% lower. Weaker iron ore shipments in the month outweigh increased volumes for coal and LNG.
The import bill is expected to be broadly unchanged. The currency was mixed in the month (down 1.2% against the US dollar but up 0.6% on a TWI basis), suggesting no material impact on import prices.
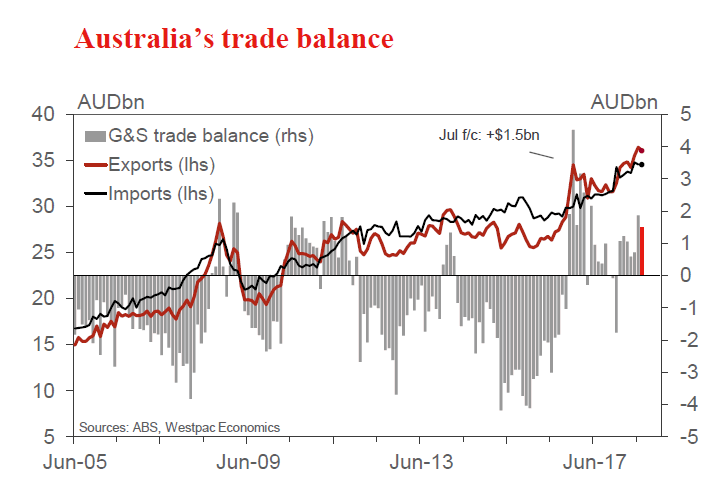
Aus Jul housing finance (no.)
- Sep 7, Last: -1.1%, WBC f/c: -0.5%
- Mkt f/c: -0.1%, Range: -1.5% to 1.0%
Australian housing finance approvals softened notably in June, with the number of owner occupier loans declining 1.1% vs and the value of investor loans down 2.7%. The decline is consistent with other market indicators showing a material slowdown in activity through May-July.
Industry data covering the major banks suggests July was more settled. However, other indicators tracking wider mortgage activity suggest flows continued to soften in the month. Overall we expect owner occupier finance approvals to be down 0.5%. The value of investor loans will again be of interest given the wider market has continued to slow materially through July-Aug.
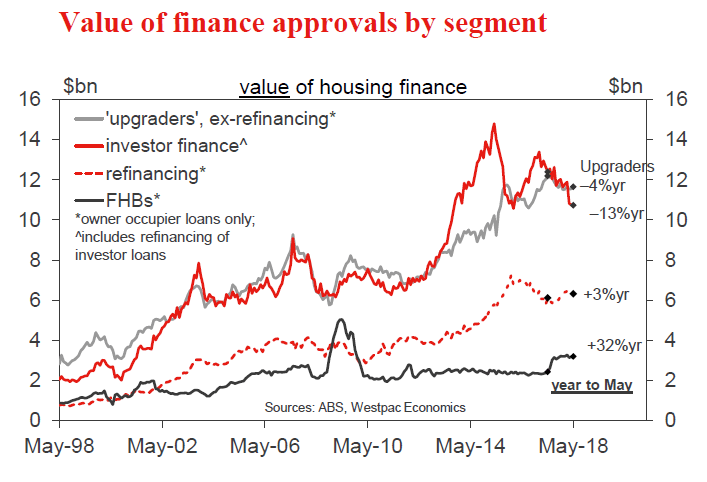
NZ Q2 terms of trade
- Sep 3, Last: -1.9%, WBC f/c: +1.0%, Mkt f/c: +1.0%
We estimate that New Zealand's terms of trade improved by 1% in the June quarter. This would leave the index just shy of the all-time high that was reached at the end of 2017.
Export commodity prices rose across the board in the June quarter, largely reversing their falls in the March quarter. This volatility appears to have more to do with the timing of export shipments than with changes in world market prices.
There was a further sharp rise in oil import prices over the quarter, but prices for New Zealand's other imports (mainly manufactured goods) are likely to have remained subdued.
We expect the terms of trade to soften over the second half of this year, given the recent falls in some export prices and the still-high price of oil.
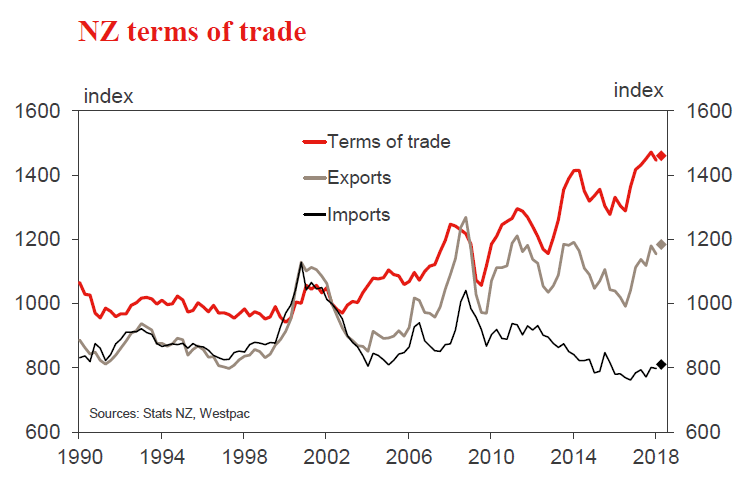
NZ Q2 building work put in place
- Sep 5, Last -0.9%, Westpac f/c: +2.0%, Mkt f/c: +2.0%
Construction activity fell 0.9% in the March quarter. That fall was mainly due to a 1.5% drop in non-residential construction, which followed a solid rise in the previous quarter. Residential building activity also fell modestly, weighed down by the ongoing wind-back in earthquake reconstruction in Canterbury.
We're expecting a 3% increase in residential building activity in June, along with a modest 0.2% increase in the more volatile non-residential category. Underlying this are signs of a reacceleration in Auckland, with regulatory changes supporting a rise in medium-density home building.
Construction activity is expected to remain elevated for an extended period. However, factors such as stretched capacity, rising costs, and difficulties accessing finance are providing a brake on how quickly building activity can ramp up to meet demand.
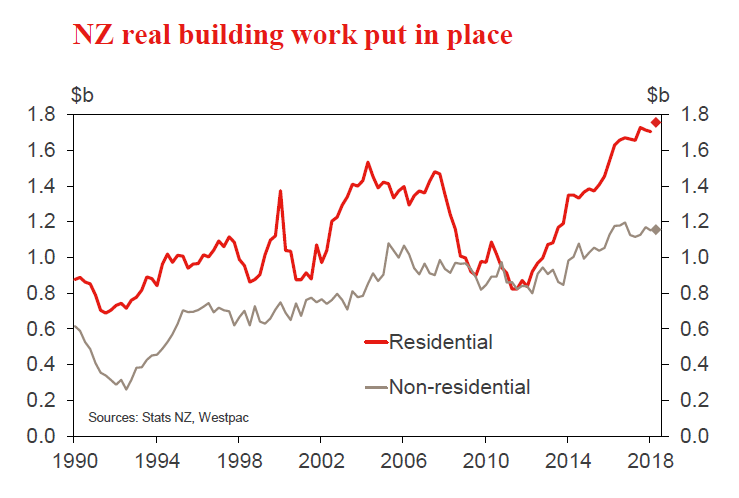
US Aug employment report
- Sep 7, last 157k, WBC 185k
To date, employment growth has run well ahead of population growth in 2018, averaging 215k jobs per month against 182k in 2017.
Come August, we see employment growth remaining strong at 185k. To this forecast, risks are skewed to the upside. As we progress through the remainder of the year, owing to where we are in the economic cycle and amid uncertainty over trade and financial conditions, jobs growth should slow. But the deceleration is likely to be small in scale and, at all points, risks will remain skewed upward.
Strong emphasis also needs to be placed on income growth. We remain of the view that hourly earnings growth will continue to tend towards 3.0%, but is unlikely to move materially above that benchmark until mid-to-late 2019. This will keep inflation expectations in check.