Sample Category Title
The Ceaseless Quest for a Perfect Strategy
Although having a well-defined trading strategy is vital to get ahead, some traders (particularly those new to the business) mistakenly believe that this is the be-all and end-all of trading, and therefore pursue perfection.
Sorry to be the ones to burst this bubble, but there is not a perfect strategy that’ll rain pips day in day out. And even if there was, do you really think it’d be plastered over a trading forum or sold for $1000? Aside from this, trading successfully involves considerably more than a strategy!
Regrettably, the quest for a flawless approach is widespread, and often elbows countless traders into a vicious cycle – a cycle that can last for years, and for some, even decades.
Hopefully, by the end of this piece you’ll have the knowledge to sidestep this.
The cycle
If you find yourself continuously swapping or altering methods in the hope of discovering something superior, then you’re likely feeling unfulfilled and frustrated. While the will to improve should never be discouraged, constantly modifying or exchanging strategies could be doing more harm than good! This cycle is a dark place for just about any trader.
So, with that in mind, what is the cycle, how does one recognize it and can it be avoided?
What is the cycle?
Imagine you’re about to begin trading a new method. You came across the strategy through a friend on a trading forum. To make sure the setup had substance you spent a few hours cataloguing around 5-10 setups and found that most of the formations generated a winning trade (this, for those of you who do not know, is NOT a back test).
Confident with the results, you enter your first live trade which comes in as a winner. Not as much as your recently noted examples, but a winner, nonetheless. Content with the win and excited about the future, you continue trading. The second trade, however, records a loss, as does the third trade.
What do you think happens next?
At this point, traders typically feel uneasy. This usually leads to either modifying the method or changing it altogether. This, fellow traders, is the cycle, and will continue to repeat itself until the trader realises that there is not a perfect strategy, or just simply throws in the towel.
How does one recognize the cycle?
Recognizing that you’re in a cycle would be relatively easy you’d think. Yet, we’ve come across several traders that have been trading within this cycle for an inordinate length of time. They’re so deeply entrenched; they do not even know they’re in it.
When asked about the cycle, the typical response we hear is that by altering parts of the strategy, they believe they’re improving it. Though this is a valid answer, the majority of these traders do not allow enough trades to complete to justify modification. A trader needs to log at least 30 trades to have any worthwhile statistics. Think about it, it is almost impossible to know whether or not a strategy requires adjustment after only two or three trades. It is no more than guesswork!
If you happen to be one of these traders that adjusts (or even changes) their method after only a few trades, then you are very likely trapped within the cycle.
How can the cycle be avoided?
There is only one way that this can be sidestepped, as far as we can see. Put the work in and back test the strategy thoroughly. By doing this, you will be aware of the statistics the strategy carries and will therefore not panic (and look to alter the setup) when your account suffers a loss, or two.
There’s reasonably good software on the market to help speed this process up. Nevertheless, if pennies are low, you may have to conduct a candle-by-candle back test, starting from the beginning and manually scrolling through the charts, noting setups as and when they form. Alongside this, you could also begin trading the method using simulated funds: http://www.icmarkets.com/blog/making-use-of-your-forex-demo-account/.
What a good strategy represents?
Understandably, strategies will vary from trader-to-trader. Even so, every strategy should have the following things in common:
- Clearly established entry and exits signals.
- Timing.
- Trade management rules.
And within the overall trading plan:
- Risk profile.
- Money management.
- Record of trades – a trading journal.
- Market selection.
- Times of trading.
To sum up…
We firmly believe that there is not, and will never be, a perfect strategy. Instead, one should accept imperfection and accept that there will be losses. Find a strategy that fits your personality, as it is ultimately you who are in control of your account! And remember; avoid the cycle at all costs. Spend time back testing a method to prove its worth – you’ll feel so much more confident following this, we guarantee it!
Forex Forecast and Cryptocurrencies Forecast
First, a review of last week’s events:
EUR/USD. As expected, the week was full of multidirectional economic news, which caused first growth, and then the fall of this pair. Recall that 45% of experts, relying on the problems in the US-Chinese negotiations and the contradictions between the US president and the head of the Fed, predicted a further weakening of the dollar and the growth of the pair to the height of 1.1750. As a result, the pair reached the high at 1.1735.
Weak statistics from the eurozone supported those 35% of analysts who had talked about strengthening the dollar. As a result, those 25% of experts proved to be completely right, who could not decide on the direction of the main trend, because, after the week's fluctuations, the pair eventually returned to the values of a week ago and completed the five-day period at 1.1600.
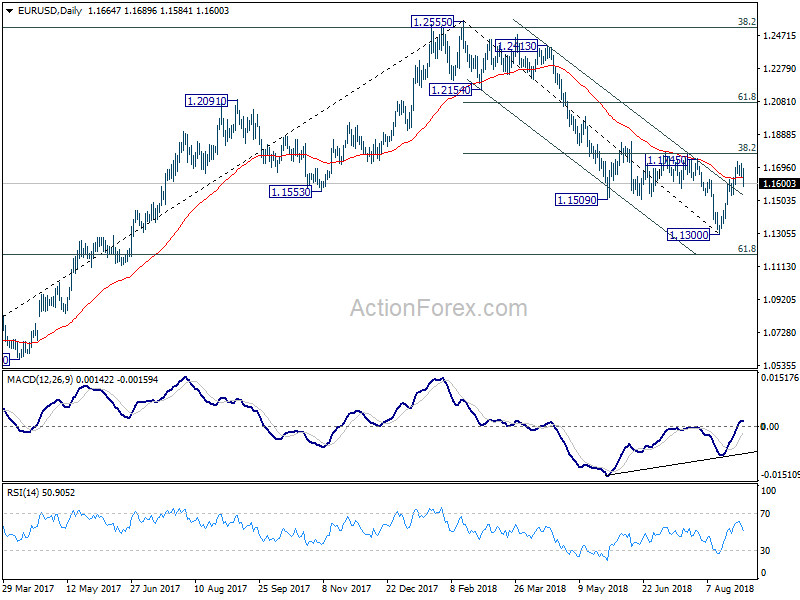
If we look at the charts D1 and W1, it is clear that after the August peak and fall to 1.1300 the pair has once again entered the side channel 1.1575-1.1750, where it moved all mid-summer;
GBP/USD. Problems related to Brexit continue to scare off foreign investors. The data published on Thursday August 30 indicate that they continue to actively get rid of British assets. The sale off of government bonds has reached its peak since 1982. - £ 17.2 billion. Despite this, the pound managed not only to hold positions, but even to win back about 200 points against the dollar after the EU negotiator Michel Barnier announced on Wednesday that he was ready to make the Brits a unique trade proposal. However, Mr. Barnier played back a little later, saying that he did not rule out the hard version of Brexit, as a result of which the pair met the end of the week session at the level of 1.2960;
USD/JPY. Recall that most experts (65%) predicted the growth of the pair, indicating a target level of 112.00. The fact that the pair is overbought which was signaled by 20% of the oscillators, could limit this growth and turn the trend around. The level 110.75 was called as the nearest support.
In reality, the pair rose to the height of 111.82, and then fell to the horizon of 110.70, so these goals can be considered fairly accurate. The final chord was set in the zone 111.10, which can be considered Pivot Point of the last six weeks;
Cryptocurrencies. The crypto market has successfully survived the information that the US Securities and Exchange Commission (SEC) rejected another batch of applications for the launch of bitcoin-funded investment funds (bitcoin-ETF). There was more optimism thanks to the hope for the revision of these applications, as well as the information that Yahoo Finance has acquired an opportunity to carry out trade operations with bitcoin, Litecoin and Ethereum.
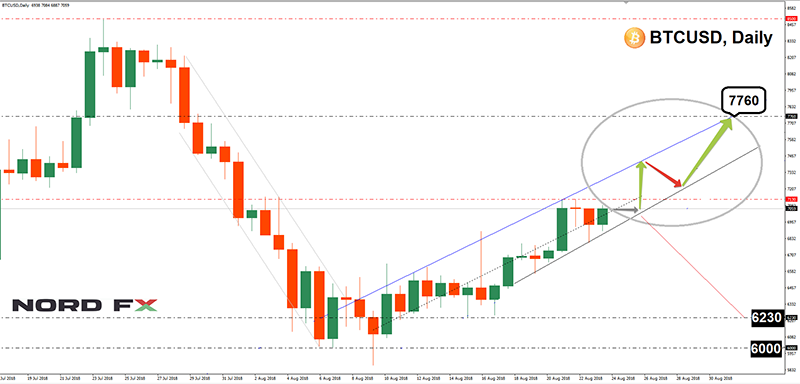
The experts called the taking of the height of $ 6,850, and then $ 7,760 as bulls' targets for the pair BTC/USD. Backed by the positive news, the pair easily broke through the resistance of $6,850, but the strength of the bulls dried up at the height of $7,130 and it returned to the resistance zone, turning it into a support zone. However, the pair was able to rise again above $7,000 by the end of the week.
As for the major altcoins, their graphs repeated the dynamics of the main crypto currency, but it was only Litecoin (LTH) that managed to fix a small growth, adding about 9%. But Ethereum (ETH) and Ripple (XRP), after growing in the middle of the week, returned to their original values.
As for the forecast for the coming week, summarizing the opinions of a number of analysts, as well as forecasts made on the basis of a variety of methods of technical and graphical analysis, we can say the following:
EUR/USD. The main trends for the upcoming week can be defined as follows: the small growth of the pair in its first half and the fall towards the end of the five-day period.
15% of oscillators on H4 indicate the pair is oversold. In addition, the market expects negative data on business activity in the US on Tuesday, September 04, which may weaken the dollar and allow the pair to rise to the 1.1700-1.1750 zone. The next resistance is at 1.1800.
However, most experts (60%) expect the dollar to strengthen. This should be facilitated by the release of a series of data on the labor market, including data from ADP on Thursday and NFP indicators on Friday, which are expected to become a strong support for the dollar and may bring the pair closer to the mid-August low in zone 1.1300. The nearest support is in the zone 1.1500-1.1525. The graphical analysis on H4 and D1 also agrees with this development.
It should be noted that in the medium term, the positive dynamics of GDP growth and a strong labor market are quite powerful factors for tightening the monetary policy of the Fed and, as a consequence, of the further strengthening of the US currency;
GBP/USD. Most analysts (60%) are looking north. They remember both the unique proposal of Michel Barnier and the fact that the index of business activity in the service sector of Great Britain can show a significant increase in August, from 53.5 to 54.7, which will become a serious bullish stimulus for the sterling. As a result, the correction may continue, and the pair will rise to the zone 1.3140-1.3170. More than 80% of oscillators on D1 are painted green as well.
An alternative view is expressed by graphical analysis on D1 and 40% of experts, who are confident that Brexit problems will outweigh any positive economic data. This is the reason that the pair will soon return to the downtrend. The nearest support in the zone 1.2800, the main target is 1.2660;
USD/JPY. Graphical analysis on D1 draws a motion in the lateral channel with a rather narrow range 110.00-111.4 5. More than 55% of experts and oscillators agree with this scenario, the oscillators are approximately equally colored in green, red and neutral gray colors. The reasons for such a forecast are the same. They are on the one hand, low inflation, which hinders Japan's GDP growth, and the success of the US economy, as well as, on the other hand, the role of the yen as a safe haven in the US-China wars and scandals related to the election of US President Donald Trump.
In case the pair goes out of the above corridor, the following support is located at 109.30 and 108.65, and the resistance is 112.15 and 113.15;
Cryptocurrencies. The bearish targets for the BTC/USD pair are still the same: the breakdown of support $6,230, then $6,000 and a descent to a low of $5,760. However, if nothing extraordinary happens, the decline below the mining profitability level in the $6,000-6,230 zone seems almost impossible now.
From the point of view of most experts, the growth of the pair is more likely to reach $7.760, then correction, and a new jump upwards, now to the high of July 25, $8.500.
EUR/USD Weekly Outlook
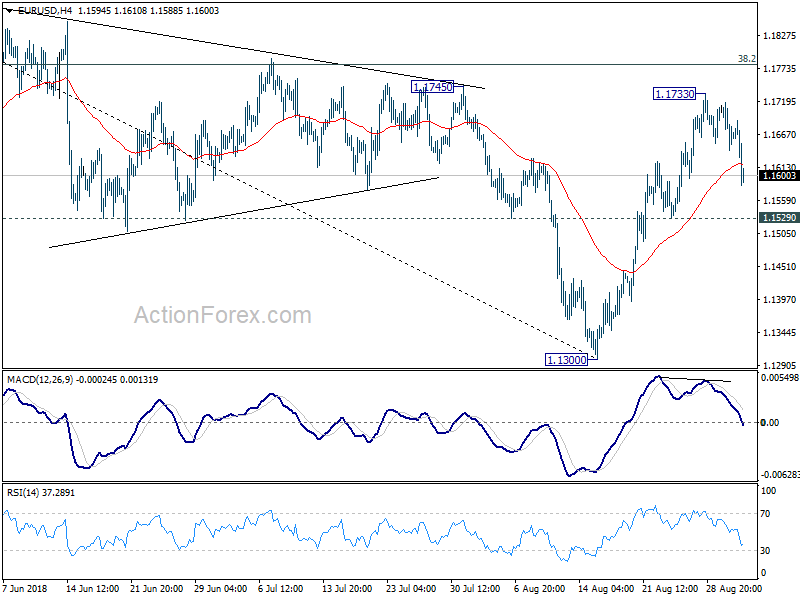
EUR/USD rose to 1.1733 last week but formed a short term top there and retreated sharply. At this point, another rise could still be seen as long as 1.1529 minor support holds. However, in that case, we'd continue to expect strong resistance from 38.2% retracement of 1.2555 to 1.1300 at 1.1779 to limit upside, at least on first attempt, to bring near term reversal. On the downside, break of 1.1529 minor will indicate completion of the rebound and turn bias to the downside for retesting 1.1300 low. After all, consolidation from 1.1300 will likely extend for a while before completion.
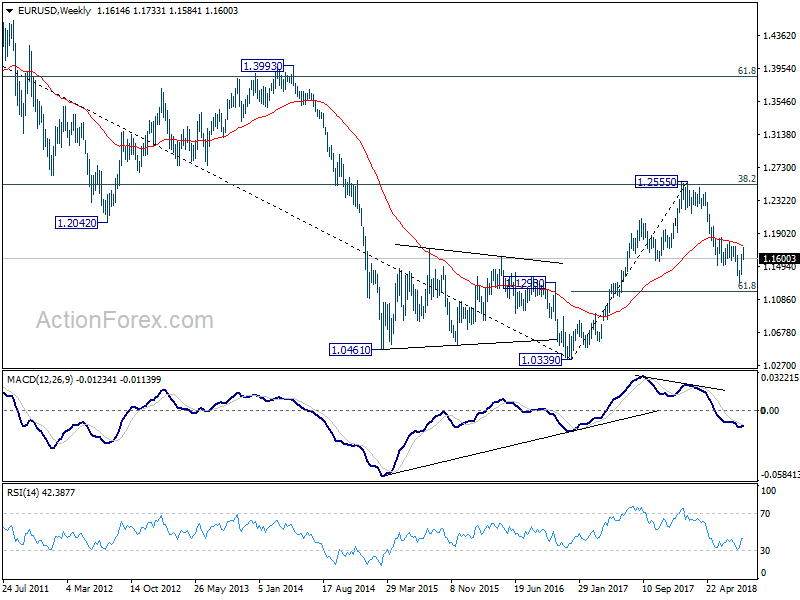
In the bigger picture, a medium term bottom should be in place at 1.1300, on bullish convergence condition in daily MACD and some consolidations would be seen. But still, note that EUR/USD was rejected by 38.2% retracement of 1.6039 (2008 high) to 1.0339 (2017 low) at 1.2516. That carries some long term bearish implications. Thus, we'd expect fall from 1.2555 high to resume after consolidation completes. Below 1.1300 should send EUR/USD through 61.8% retracement of 1.0339 to 1.2555 at 1.1186. And, in that case, EUR/USD would head to retest 1.0339 (2017 low).
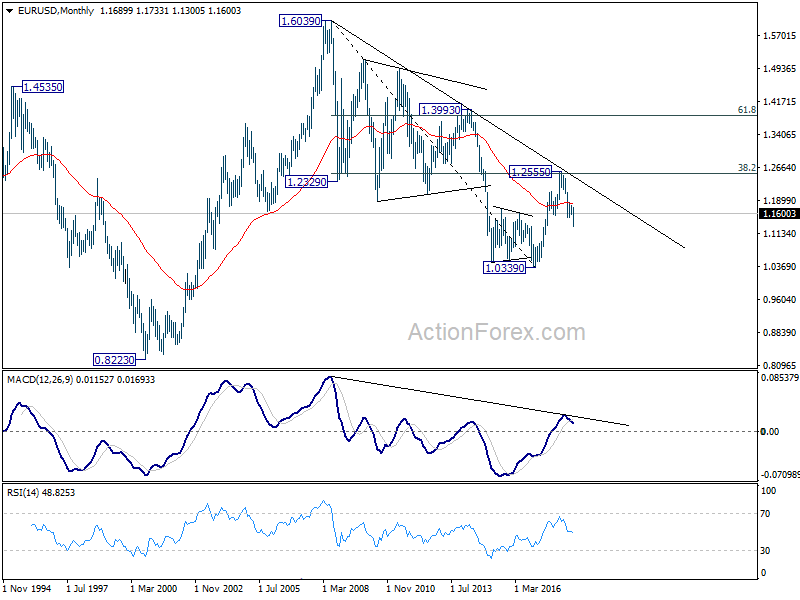
In the long term picture, the rejection from 38.2% retracement of 1.6039 to 1.0339 at 1.2516 argues that long term down trend from 1.6039 (2008 high) might not be over yet. EUR/USD is also held below decade long trend line resistance. Sustained trading below 55 week EMA adds bearishness to the case. Firm break of 61.8% retracement of 1.0339 to 1.2555 at 1.1186 should at least bring a retest on 1.0339 low.
USD/JPY Weekly Outlook
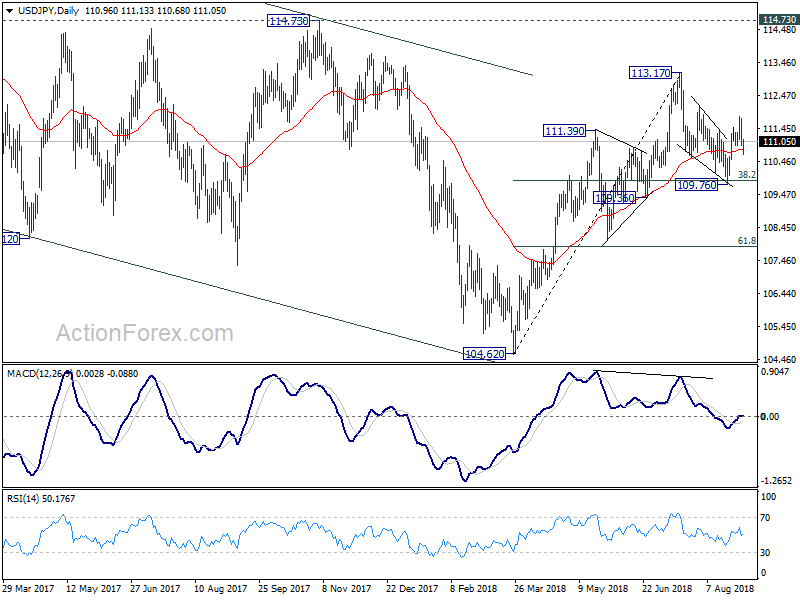
USD/JPY rebounded to 111.82 last week but retreated sharply since then. Deeper decline cannot be ruled out this week. But after all, price actions from 113.17 are viewed as a corrective pattern. Downside should be contained by 38.2% retracement of 104.62 to 113.17 at 109.90 to bring rebound. On the upside, above 111.82 will resume the rebound from 109.76 and target a test on 113.17 high.
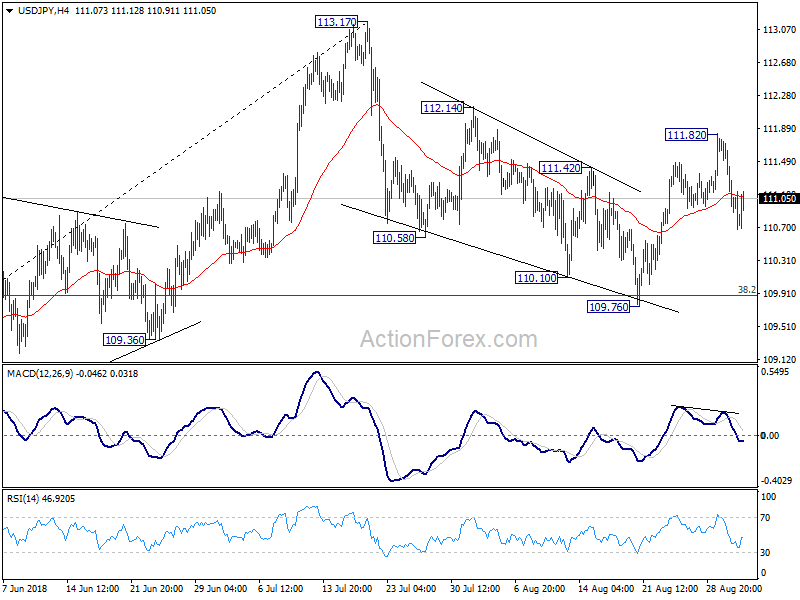
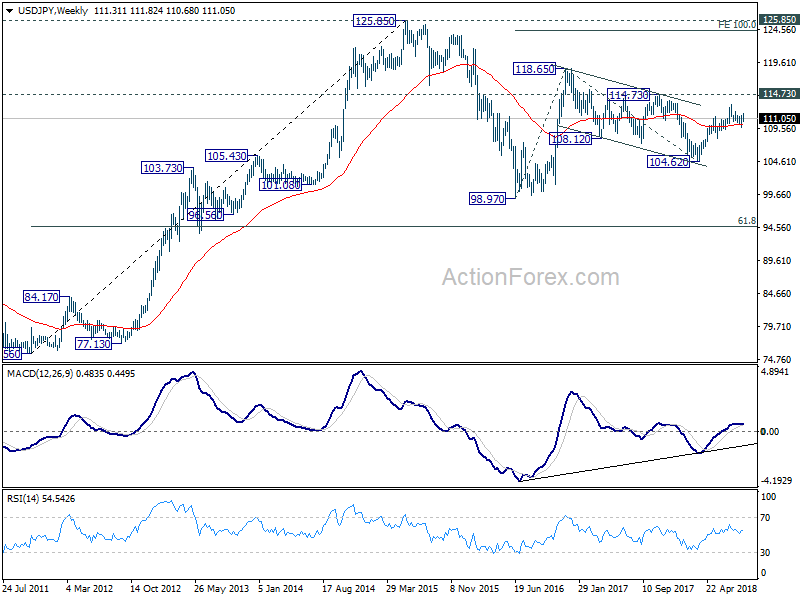
In the bigger picture, corrective fall from 118.65 (2016 high) should have completed with three waves down to 104.62. Decisive break of 114.73 resistance will likely resume whole rally from 98.97 (2016 low) to 100% projection of 98.97 to 118.65 from 104.62 at 124.30, which is reasonably close to 125.85 (2015 high). This will stay as the preferred case as long as 109.36 support holds. However, decisive break of 109.36 will mix up the outlook again. And deeper fall should be seen back to 61.8% retracement of 104.62 to 113.17 at 107.88 and below.
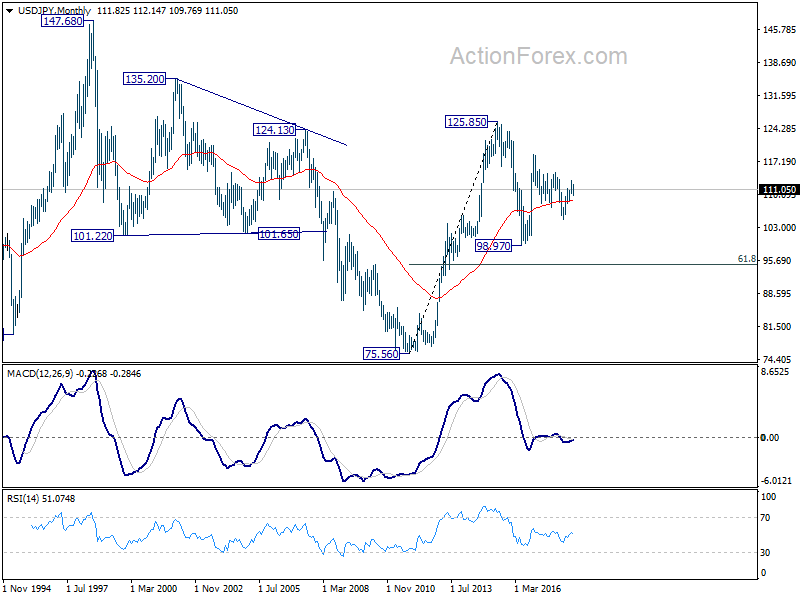
In the long term picture, the rise from 75.56 (2011 low) long term bottom to 125.85 top is viewed as an impulsive move, no change in this view. Price actions from 125.85 are seen as a corrective move which could still extend. In case of deeper fall, downside should be contained by 61.8% retracement of 75.56 to 125.85 at 94.77. Up trend from 75.56 is expected to resume at a later stage for above 135.20/147.68 resistance zone.
GBP/USD Weekly Outlook
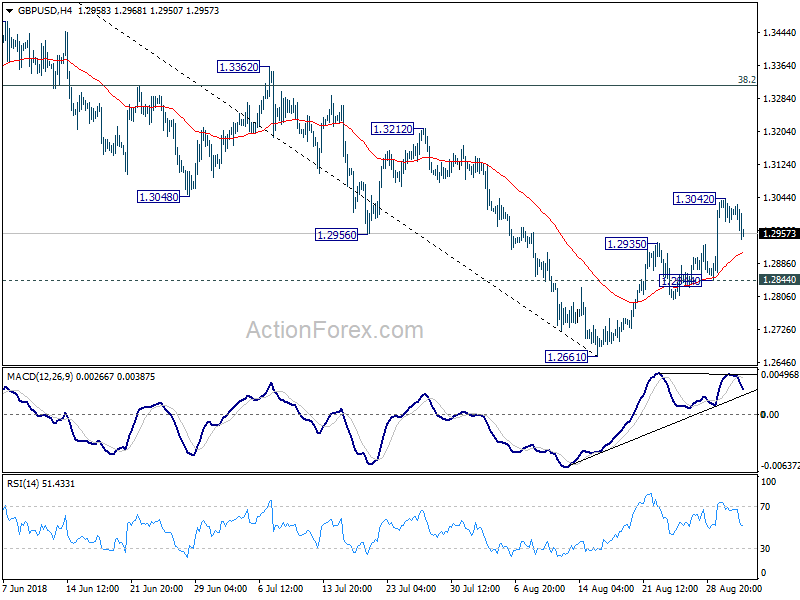
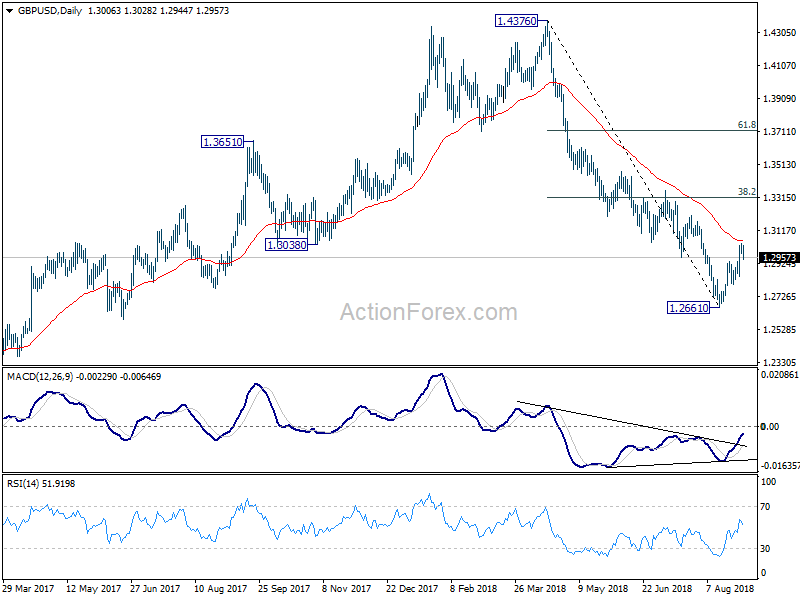
GBP/USD rebounded further to 1.3043 last week but formed a temporary top there and retreated. Initial bias is neutral this week first. With 1.2844 minor support intact, rebound from 1.2661 could extend higher. But in that case, we'd expect strong resistance from 1.3316 fibonacci level to limit upside, at least on first attempt. On the downside, break of 1.2844 support will argue that the rebound is completed and bring retest of 1.2661 low.
In the bigger picture, whole medium term rebound from 1.1946 (2016 low) should have completed at 1.4376 already, after rejection from 55 month EMA (now at 1.4099). The structure and momentum of the fall from 1.4376 argues that it's resuming long term down trend. And this will be the preferred case as long as 38.2% retracement of 1.4376 to 1.2661 at 1.3316 holds. However, firm break of 1.3316 would bring stronger rebound to 61.8% retracement at 1.3721. And, the eventual depth of the fall from 1.4376, and the chance of hitting 1.1946 low, will depend on the strength of the interim corrective rebound from 1.2661.
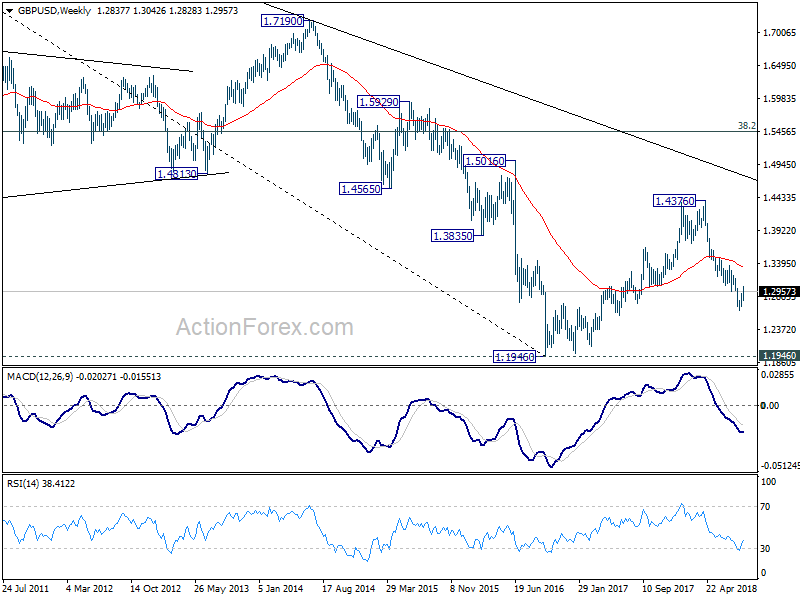
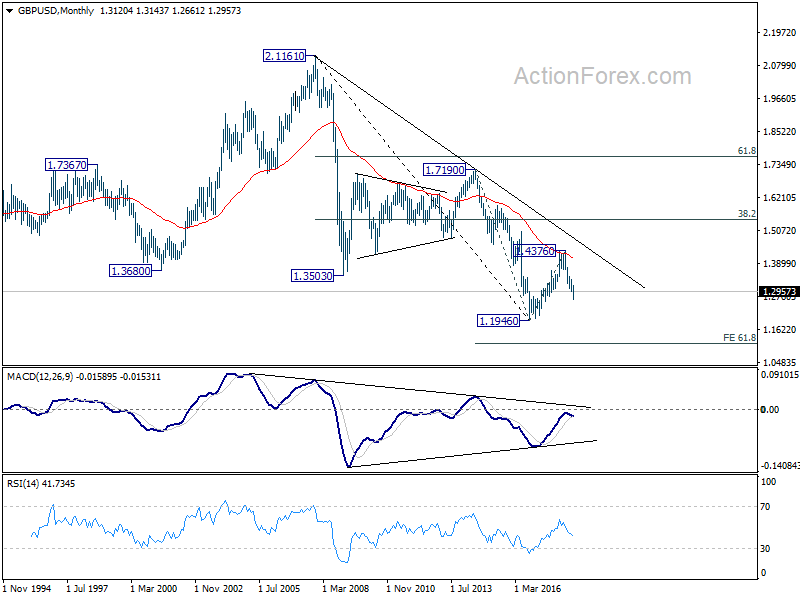
In the longer term picture, outlook in GBP/USD is held bearish. Rebound from 1.1946 was rejected solidly by falling 55 month EMA. The pair was limited well below 38.2% retracement of 2.1161 (2007 high) to 1.1946, as well as the decade long falling trend line. On break of 1.1946, next target will be 61.8% projection of 1.7190 to 1.1946 from 1.4376 at 1.1135.
USD/CHF Weekly Outlook
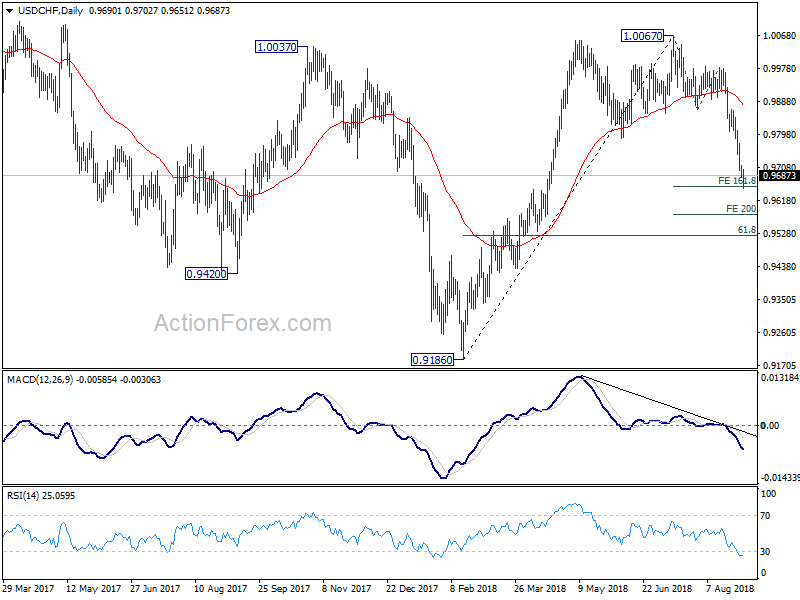
USD/CHF dropped sharply to as low as 0.9651 last week and the development argues that whole rise from 0.9186 has completed at 1.0067 already. A temporary low is in place after hitting 161.8% projection of 1.0067 to 0.9866 from 0.9981 at 0.9656. Initial bias is neutral this week for some consolidations. But upside of recovery should be limited by 0.9775 minor resistance to bring another fall. On the downside, break of 0.9651 will target 200% projection at 0.8579 next.
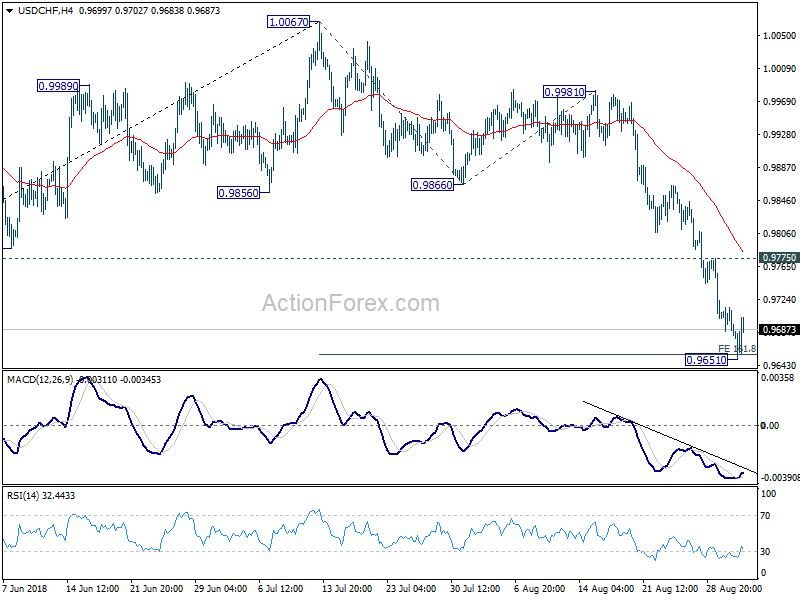
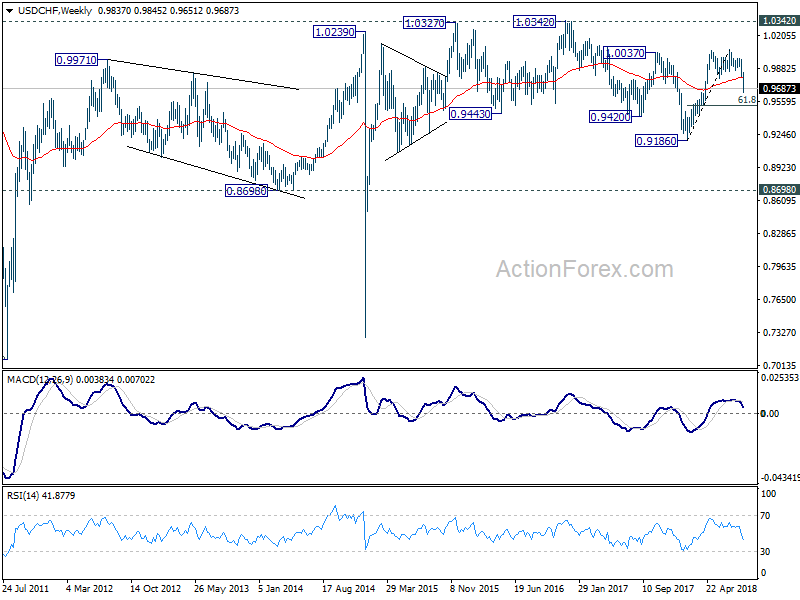
In the bigger picture, current development suggests that rise from 0.9186 low has completed at 1.0067, after failing to sustain above 1.0037 resistance. Fall from 1.0067 could extend to 61.8% retracement of 0.9816 to 1.0067 at 0.9523 and below. But for now, we don't expect a break of 0.9186 low. On the upside, firm break of 0.9866 support turned resistance will suggests that fall from 1.0067 has completed and rise from 0.9186 is resuming.
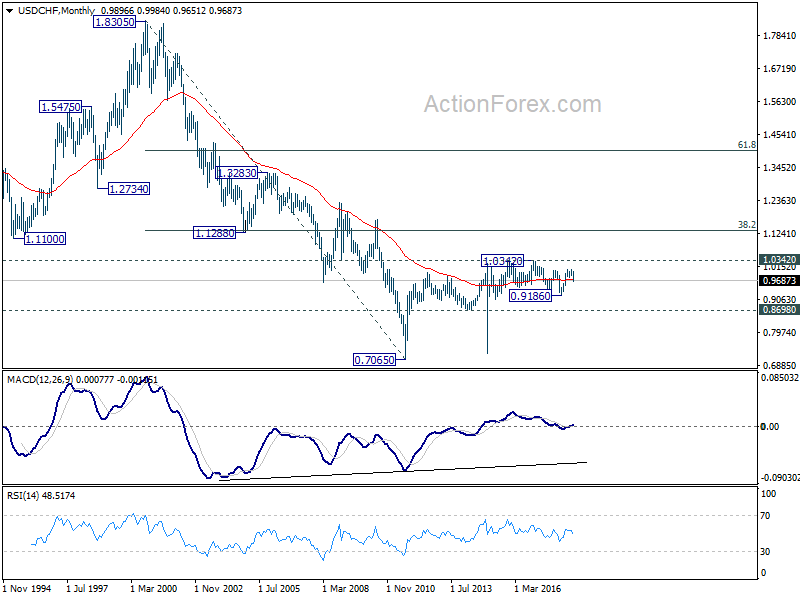
In the long term picture, price actions from 0.7065 (2011 low) are not clearly impulsive yet. Thus, we'll treat it as developing into a corrective pattern, at least, until a firm break of 1.0342 resistance.
AUD/USD Weekly Outlook
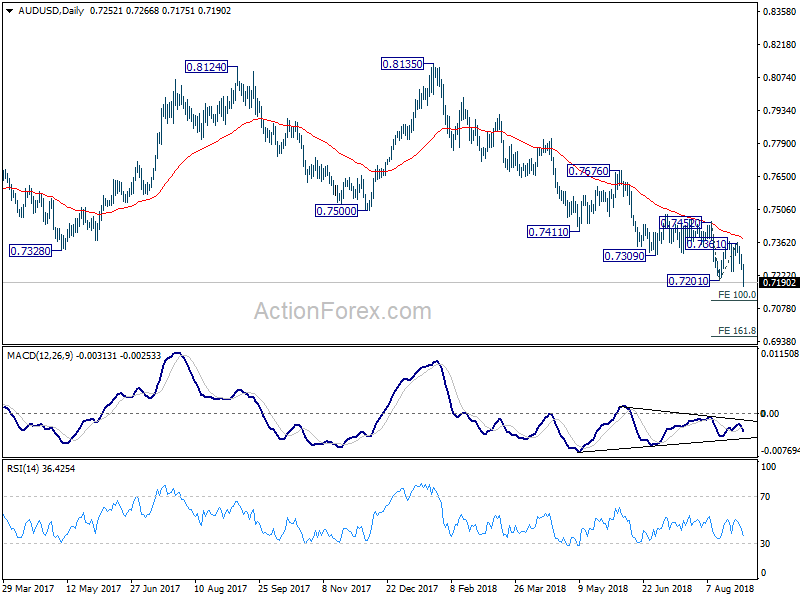
AUD/USD dropped to as low as 0.7175 last week and the break of 0.7201 confirmed resumption of down trend from 0.8135. Initial bias is on the downside this week for 100% projection of 0.7452 to 0.7201 from 0.7361 at 0.7110. Break will target 161.8% projection at 0.6955. On the upside, break of 0.7361 résistance is needed to indicate short term bottoming. Otherwise, outlook will remain bearish in case of recovery.
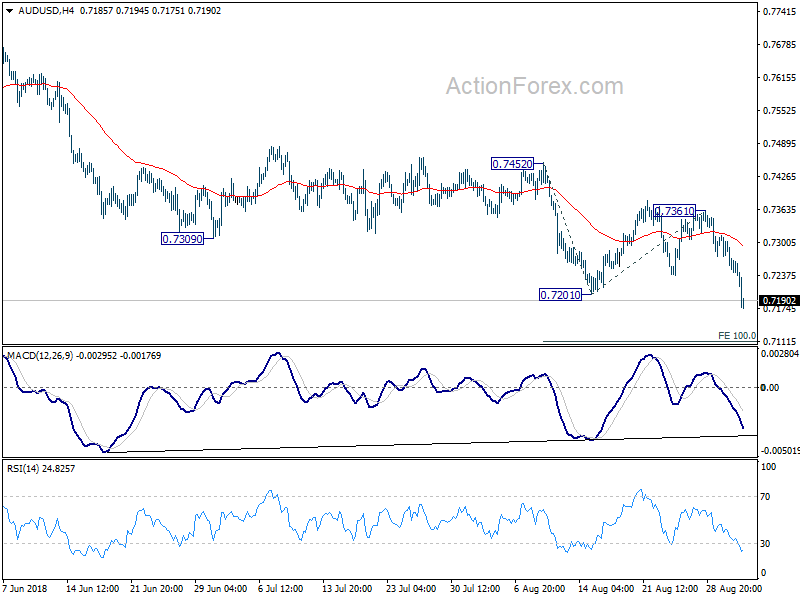
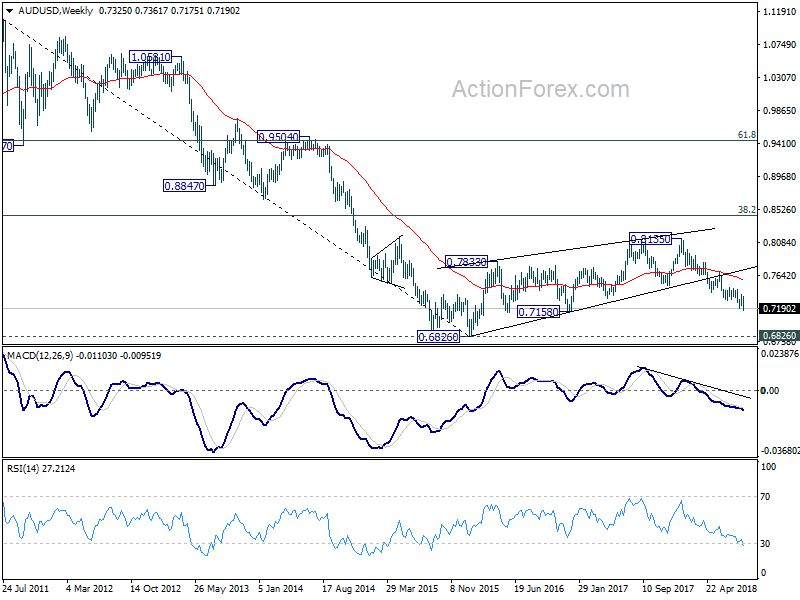
In the bigger picture, rebound from 0.6826 (2016 low) is seen as a corrective move that should be completed at 0.8135. Fall from there would extend to have a test on 0.6826. There is prospect of resuming long term down trend from 1.1079 (2011 high). But we'll look at downside momentum to assess at a later stage. On the upside, break of 0.7452 resistance, however, will indicate medium term bottoming, on bullish convergence condition in daily MACD. In that case, a medium term correction should be seen first before down trend resumption.
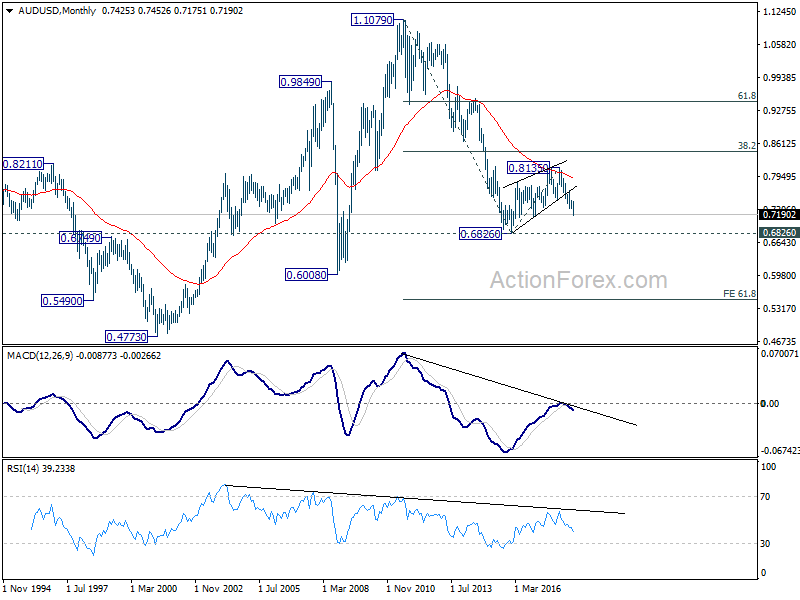
In the longer term picture, rebound from 0.682 (2016 low) should have completed at 0.8135 already. Failure to reach 38.2% retracement of 1.1079 (2011 high) to 0.6826 at 0.8451 carries bearish implications. This is also supported by the corrective structure from 0.6826 to 0.8135, as well as the rejection by 55 month EMA. The down trend from 1.1079 is in favor to extend. On break of 0.6826, next target will be 61.8% projection of 1.1079 to 0.6826 from 0.8135 at 0.5507.
USD/CAD Weekly Outlook
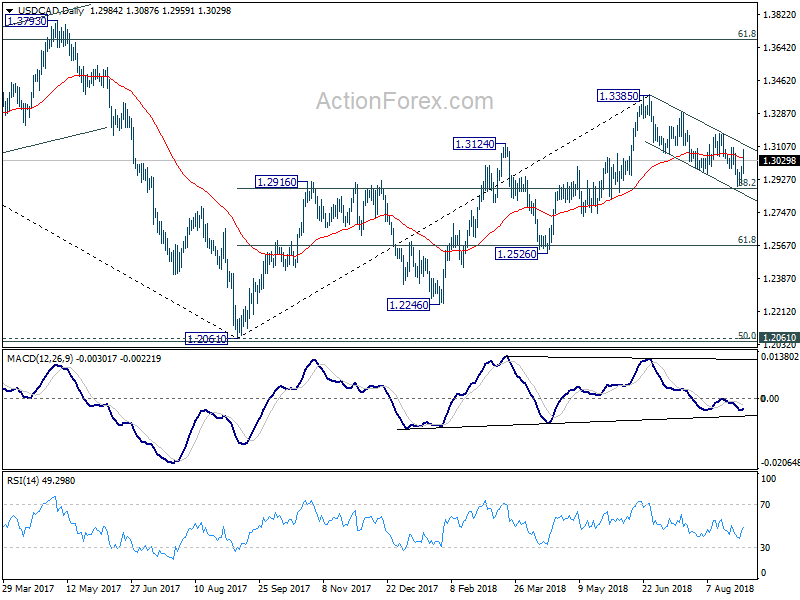
USD/CAD's choppy fall from 1.3385 extended lower to 1.2886 last week. But it quickly recovered ahead of 1.2879 fibonacci level. Near term outlook is mixed up. Initial bias is mildly on the upside this week as long as 1.2997 minor support holds. Sustained of near term channel resistance (now at 1.3111) will will be the first sign of bullish reversal and bring stronger rise to 1.3173 resistance for confirmation. That will also carry larger bullish implication. Meanwhile, below 1.2997 minor support will turn bias back to the downside for 1.2879 fibonacci level.
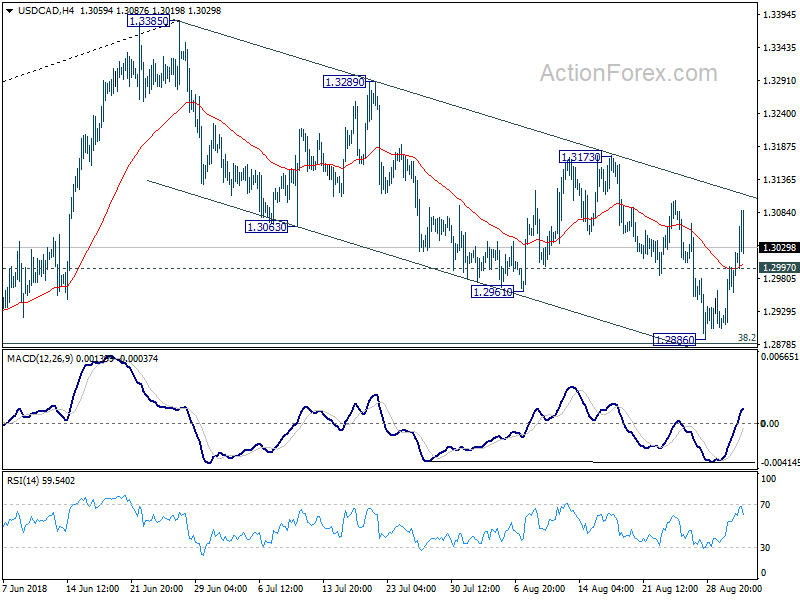
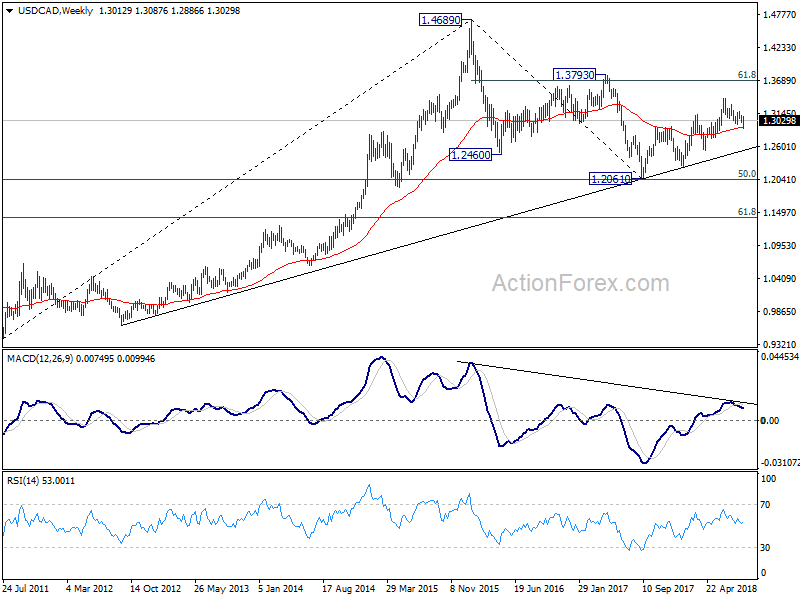
In the bigger picture, focus is now on 38.2% retracement of 1.2061 to 1.3385 at 1.2879. Decisive break there will affirm the case of medium term reversal and target 61.8% retracement at 1.2567 and below. That will also put key long term support at 50% retracement of 0.9406 (2011 low) to 1.4689 (2015 high) at 1.2048 into focus. On the upside, break of 1.3173 resistance will revive the bullish case and target 61.8% retracement of 1.4689 to 1.2061 at 1.3685 and above.
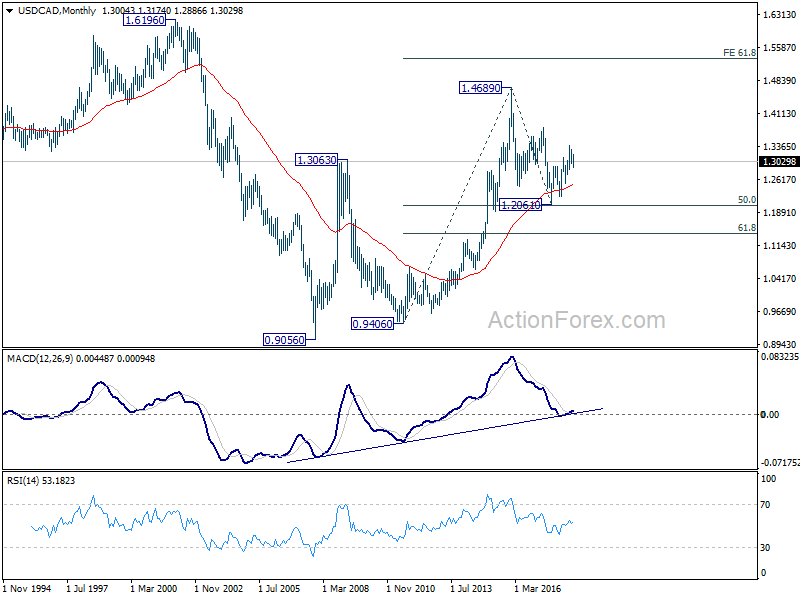
In the longer term picture, corrective fall from 1.4689 (2015 high) should have completed with three waves down to 1.2061, just ahead of 50% retracement of 0.9406 (2011 low) to 1.4689 (2015 high) at 1.2048. The development keeps long term up trend from 0.9406 and that from 0.9056 (2007 low) intact. For now, there is now prospect of extending the long term up trend to 61.8% projection of 0.9406 to 1.4689 from 1.2061 at 1.5326 in medium to long term.
GBP/JPY Weekly Outlook
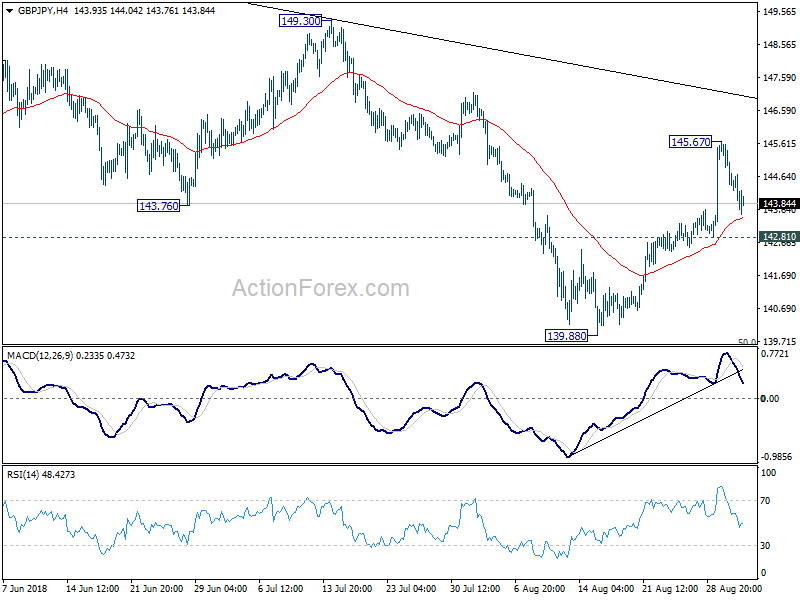
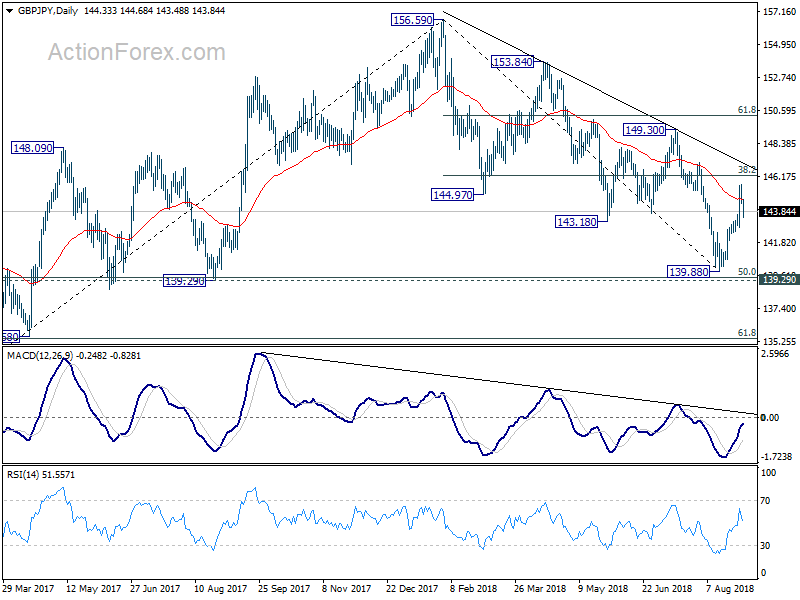
GBP/JPY rebounded further to 145.67 last week but formed a temporary top and retreated. Initial bias stays neutral this week first. As long as 142.81 minor support holds, another rise is mildly in favor. Above 145.67 will target trend line resistance (now at 146.99). Firm break there will be a signal of bullish reversal and should target 149.30 resistance for confirmation. However, break of 142.81 will argue that the rebound from 139.88 has completed and turn bias back to the downside for 139.29/47 key support zone.
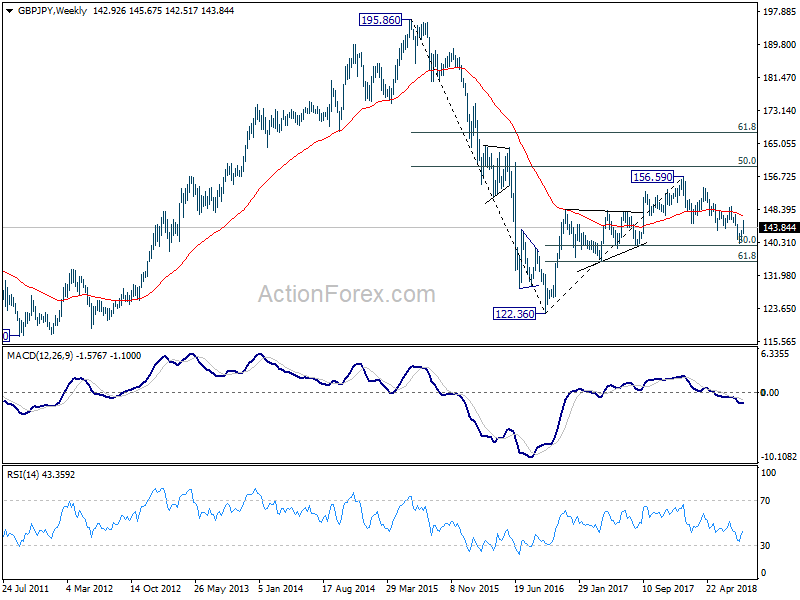
In the bigger picture, at this point decline from 156.59 is still seen as a corrective move. Focus remains on 139.29 cluster support (50% retracement of 122.36 to 156.59 at 139.47). Strong rebound from there will re-affirm the bullish case that rise from 122.36 is still to extend through 156.59 high. However, sustained break of 139.29/47 should confirm medium term reversal. GBP/JPY would then target a retest on 122.26 (2016 low).
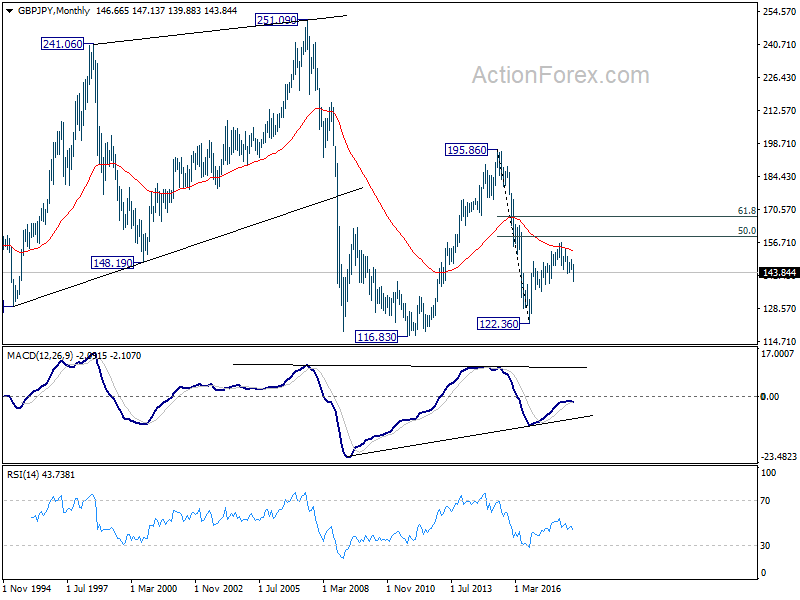
In the longer term picture, the failure to sustain above 55 month EMA (now at 152.97) is mixing up the outlook. Nonetheless, as long as 139.29 holds, rise from 122.36 is in favor to extend to 50% retracement of 195.86 (2015high) to 122.36 (2016 low) at 159.11, and possibly further to 61.8% retracement at 167.78 before completion. However, firm break of 139.29 will turn focus back to 116.83/122.36 support zone instead.
EUR/JPY Weekly Outlook
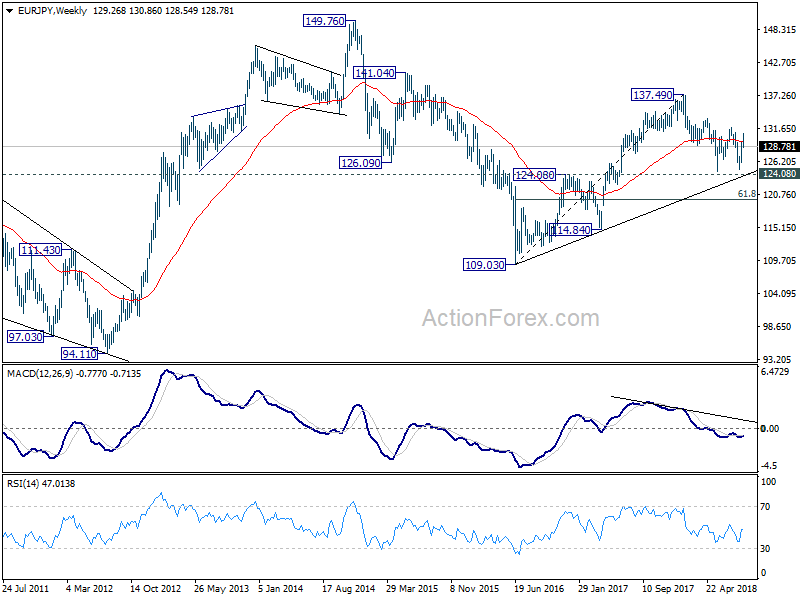
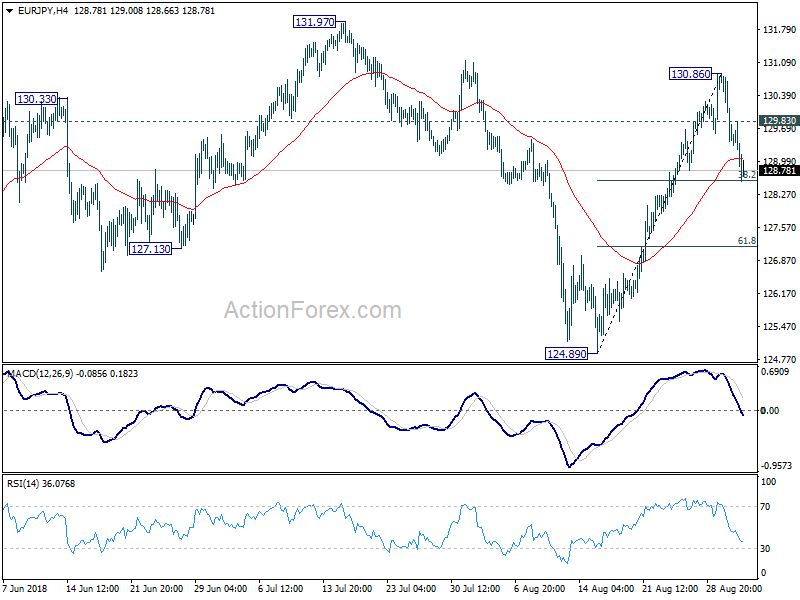
EUR/JPY rose further to 130.86 last week but formed a top there and retreated sharply. As long as 38.2% retracement of 124.89 to 130.86 at 128.57 holds, another rise is mildly in favor. Above 129.83 minor resistance will turn bias back to the upside for 130.86 first and then resistance zone between 131.97 and 61.8% retracement of 137.49 to 124.61 at 132.56. However, firm break of 128.57 will argue that rebound from 124.89 has completed, and it's the third leg of consolidation pattern from 124.61. In that case, intraday bias will be turned back to the downside for 124.61/89..
In the bigger picture, EUR/JPY once again rebounded ahead of 124.08 key resistance turned support. It's also held well above long term trend line from 109.03 (2016 low). The development argues that such rise from 109.03 might not be over yet. Decisive break of 61.8% retracement of 137.49 to 124.61 at 132.56 will pave the way to retest 137.49 high. But, firm break of 124.08 will argue that whole rise from 109.03 (2016 low) has completed at 137.49. Deeper decline would be seen to 61.8% retracement of 109.03 to 137.49 at 119.90 next.
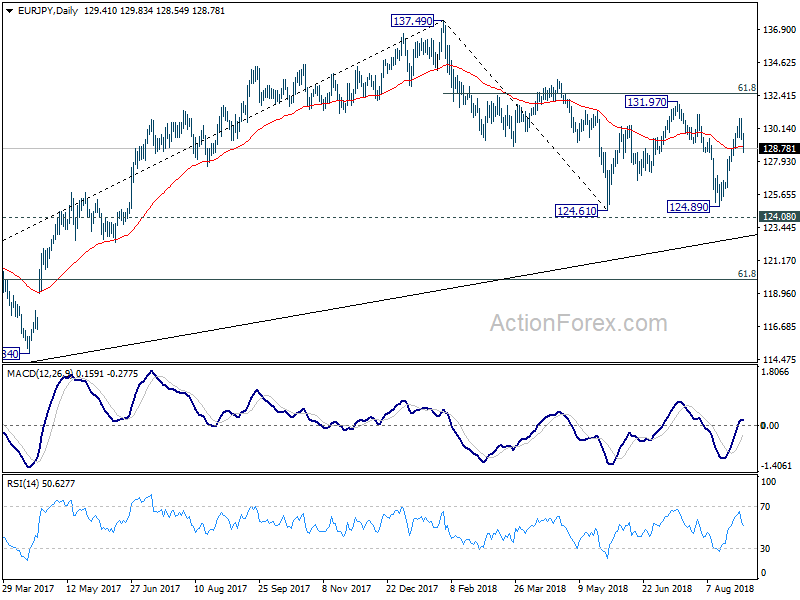
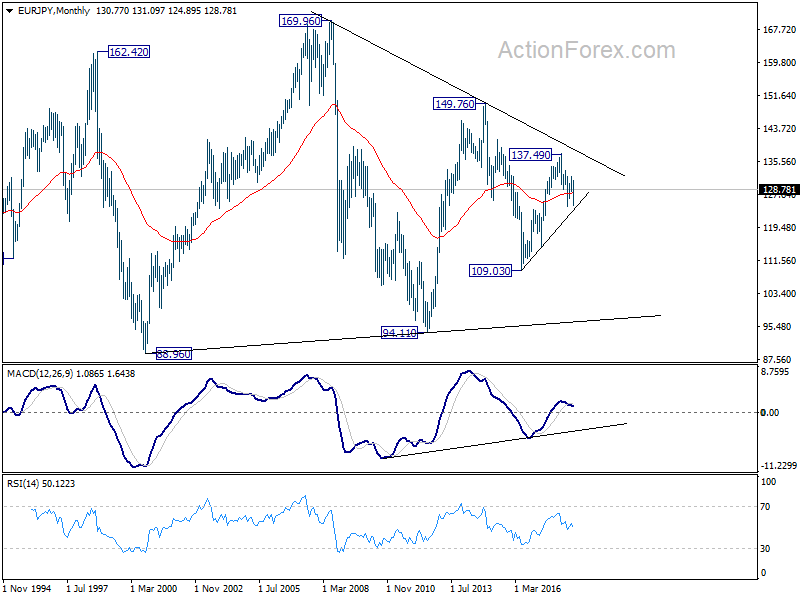
In the long term picture, at this point, EUR/JPY is staying in long term sideway pattern, established since 2000. Rise from 109.03 is seen as a leg inside the pattern. As long as 124.08 support holds, further rally is in favor in medium to long term through 149.76 high. However, break of 124.08 could extend the fall through 109.03 low instead.