Sample Category Title
Mid-US Update: Selloff in emerging market currencies could be back in spotlight
Risk aversion seems to be the main theme in the markets today, as Brexit and NAFTA(?) take a back seat. Instead, selloff in Turkish Lira and stocks are what's driving the forex markets. Yen is trading as the strongest one for today, followed by Dollar and then Swiss Franc. Yen and the Swissy are clearly benefiting from risk aversion. The greenback continues to take advantage of slump in emerging market currencies.
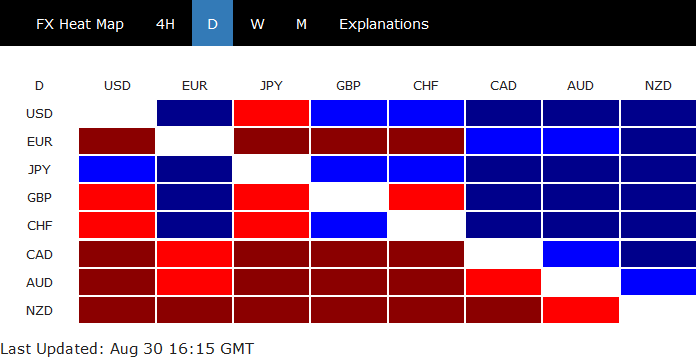
Meanwhile, commodity currencies are all weak, including Canadian, Australian and New Zealand Dollar. Sterling also retreats mildly as the lift from Brexit optimism fades. Make no mistake that it's still likely to have deal when both sides want to, but they have to deliver. And just like Canada-US trade talks, eyes will be on whether there is a conclusion by the end of tomorrow.
US stocks and yields are trading generally in red. DOW is down -0.40%, S&P 500 down -0.28%, NASDAQ down -0.07%. But remember that both S&P 500 and NASDAQ are on record runs. So such shallow retreat does nothing to change the trend. In Europe, FTSE closed down -0.62%, DAX down -0.54% and CAC down -0.42%.
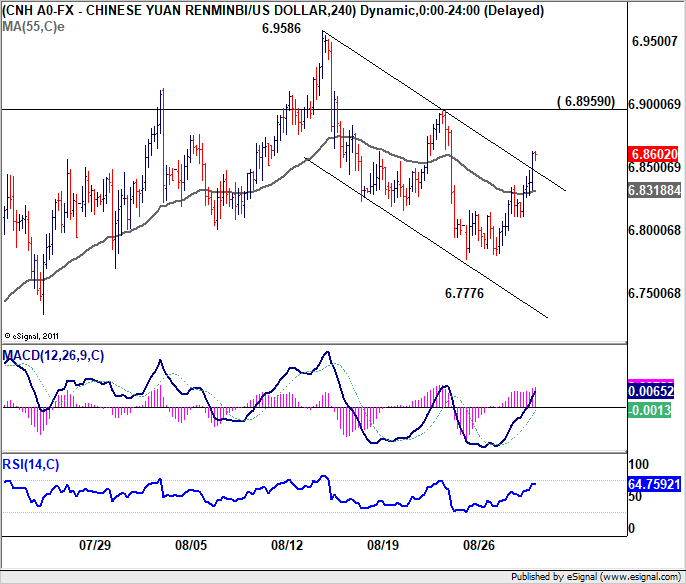
USD/CNH (offshore Yuan), is trading up more than 0.6% at the time of writing. Break of the near term channel resistance argues that pull back from 6.9586 could completed with three waves down to 6.7776 already. Immediate focus is on 6.8959, for tomorrow and early next week. Break will bring rest of 6.9586 and even resume the down trend in Yuan.
And as we mentioned early, USD/TRY's break of 61.8% retracement of 7.2068 to 5.6919 at 6.6281 could pave the way to retest 7.2069 high.
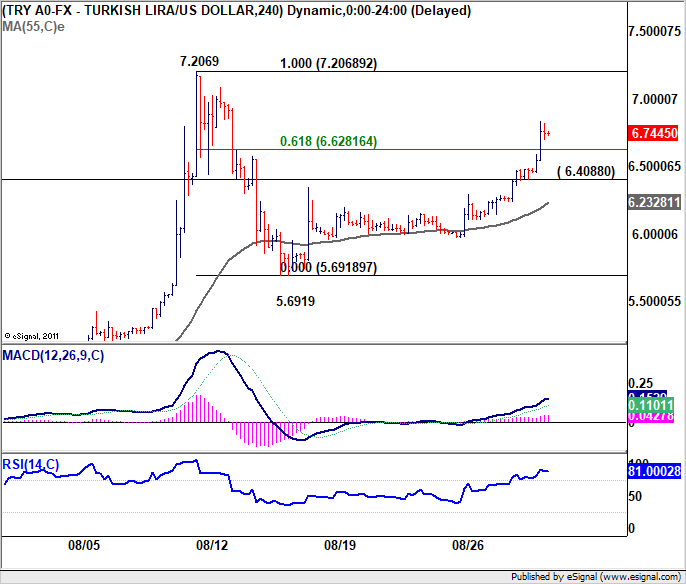
Selloff in emerging market currency could come back into spot light. If that happens, Dollar and Yen would be the main beneficiary.
NAFTA Negotiations: Canada Steps up to the Plate
On Monday, the U.S. and Mexican NAFTA discussions resulted in an announcement of a bilateral trade agreement. This agreement includes augmented rules of origin for autos, strengthened intellectual property protections, guarantees of a more level playing field for financial services, and enhanced protections for labour and the environment. (A more complete list of achievements can be found on the Office of the U.S. Trade Representative website.)
The agreement is far from complete, as both sides still have to hash out details. Most importantly, a lot of what has been agreed upon still requires approval by the Canadian government in order for the trade pact to remain trilateral, and roughly 10 of the 30 chapters in NAFTA remain incomplete. Given that it took about 2 months to achieve the current U.S.-Mexico terms without Canadian participation, the August 31st deadline imposed by the U.S. Trade Representative is likely unachievable. However, it’s in the economic interest of all three political leaders to forge an agreement, even if it’s only one in principle against the short political timeline.
Trying to expedite the process by proceeding with a bilateral trade deal to the exclusion of Canada at this juncture also comes up against a big hurdle. The current Trade Promotion Authority (TPA) granted to the U.S. President allows for fast-tracked approval relates only to the current trilateral agreement (i.e. NAFTA). Pushing for a bilateral agreement would likely require a procedural time lag through the dissolution of NAFTA and advance notification to both Congress and trade partners. At the same time, any new bilateral agreement(s) would require at least 90 days, and up to 180 between notification and consideration by Congress.
Therefore, unless Canada is pleased with what’s on the table and can proceed at a rapid pace of negotiation, it will likely be difficult for the current sitting U.S. Congress to pass any agreement before elections in November. That said, there can still be “agreements in principle”. Doing so, however, does not remove the risk of the ball being placed onto the field of incoming new governments in Mexico and the U.S.
Until then, NAFTA will remain in effect in its current, unrevised form, leaving time for consideration by Canadian Parliament. Although the U.S. administration may threaten to pullout from NAFTA, a complete nullification of the agreement would require Congressional approval, something that may be unpopular within states that have strong trade inter-dependence with Canada, particularly in the lead-up to U.S. midterm elections this fall.
Some wins for Canada in the new agreement
The augmented rules of origin for the auto industry are considered a win for manufacturers located in higher cost jurisdictions such as Canada and the U.S. The changes include requiring that 75% of auto content be made in the U.S. and Mexico, and that 40-45% of auto content be made by workers earning at least U.S. $16 per hour. Importantly, there is much wider breadth in the products that qualify as North American auto content, including all components of the vehicle, company headquarters and research and development facilities. This should make for an easy hurdle for Canadian manufacturers to surpass, with a large share of U.S. and Canadian manufacturing facilities (and products) already meeting these new requirements.
Concerns of a ‘sunset clause’ have been alleviated and this is a positive development. The agreement will be reviewed every six years. At that time, if one or more parties expresses a desire to alter the trade pact, there would be a ten year window to resolve issues before the agreement would end. There is a key difference in the incentive structure that is created by a sunset clause versus the current review period proposal. The former is typically structured as an “opt-in” clause that requires all three countries to formally confirm their commitment to the trade pact, otherwise it would automatically be dissolved over some specified time period and process.
The initial U.S. sunset clause proposal was on a very short time frame of 5 year cycles, which would create far too much business uncertainty. In contrast, a review period reflects an “opt-out” approach. A country needs to deliberately provide notice to terminate the trade pact, otherwise it continues in its current form. In addition, even in the event that a country raises this possibility, the ten year window for resolution offers far more line-of-sight to businesses.
However, not all progress is for the better
Although the auto agreement purports to benefit higher cost manufacturers in Canada and the U.S., consumers are likely to be the losers. The higher cost of parts and assembly will likely be passed onto consumers. Moreover, at the moment higher cost North American producers are not shielded from lower cost foreign producers, where business models may dictate that the lower cost option remains to simply pay the current 2.5% tariff on non-North American auto parts and vehicles in order to remain in full compliance to the new rules of origin. This incentive structure could cause the U.S. to revisit a higher tariff imposition for other countries, via Section 232 on grounds of national security. In turn, this would keep trade wars front and center for other countries, with the consumer ultimately holding the bill at the end of the day.
To this end, there are reports that the U.S. and Mexico have negotiated a side agreement imposing a quota on Mexican auto exports. The imposition of quotas on Canadian vehicles entering the U.S. would be a negative outcome. Avoiding it may be difficult. The U.S. can use the threat of additional tariffs, including the previously threatened 25% tariff on autos and auto parts, or non-tariff barriers in an attempt to strong-arm Canada to come to an agreement sooner rather than later.
Indeed, with the U.S. Commerce Department due to deliver the results of its Section 232 investigation into auto and parts imports (the same grounds used to impose steel and aluminum tariffs), this side agreement may represent a template for U.S. negotiations with Canada and other major auto exporting nations, like Europe.
Strengthened intellectual property laws to the U.S. standards of 75-year copyright and 10-year data protection for biologicals, may be deemed as a threat to certain Canadian industries, such as the thriving Canadian generic pharmaceuticals industry.
Many questions remain
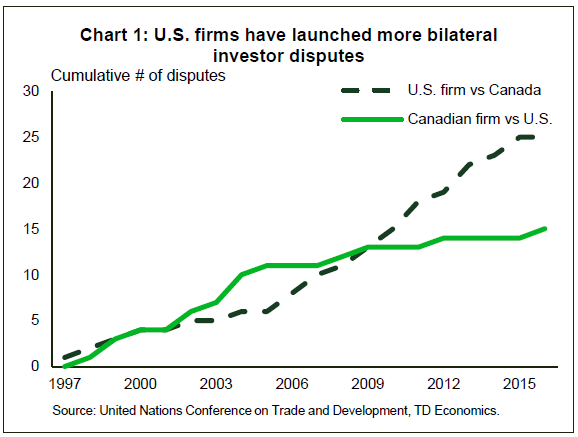
The ultimate status of the current dispute resolution mechanism remains in limbo. Under the U.S.-Mexico agreement, some U.S. industries will remain fully protected by the current dispute process, such as energy, infrastructure, transportation, and telecoms, but others may face a more limited dispute resolution process. Canada would prefer that the current or improved dispute resolution mechanism remain in place, with international panels preferred to local courts. Interestingly, under the current system, U.S. businesses have been the top users of this mechanism (Chart 1).
The path forward for agricultural sectors is also an open question. CETA, which saw Canada agree to an expansion of dairy import quotas, may provide a template for negotiations. It remains to be seen how Canadian negotiators balance the sensitivities of dairy and other protected agricultural industries against potential impacts on auto manufacturing and other sectors. Should the Canadian government feel it necessary to cede on dairy supply management in order to mitigate risks elsewhere in the trade pact, they would likely be able to provide direct support to the industry, as is typically done within the U.S.
Access to U.S. government procurement for Mexican and Canadian firms remains uncertain.
Not much impact yet for monetary policy
News of progress on NAFTA and Canada’s rejoining of negotiations appears to have lifted some of the trade-related uncertainty, based on markets’ positive reactions. The loonie gained more than 1% on the news of a U.S.-Mexico agreement, even with Canada not having been part of the talks! This speaks to the market confidence that a broader deal is at hand. The TSX has risen about 0.2% since news broke last Friday of a potential agreement this week.
The impact of these developments for the Bank of Canada’s policy interest rate path is likely neutral in the near term (2018), and slightly hawkish in the medium term (2019-2020). The Bank has incorporated a drag on economic growth from trade policy uncertainty that kept the level of GDP about half a point lower than it would otherwise have been by the end of 2020. To the extent that this uncertainty is lifted, a stronger forecast will be the result, and this can lead to a quicker pace of monetary tightening.
However, we are not out of the woods yet, and uncertainty is likely to prevail in the near term. While progress on negotiations will be welcomed by Governor Poloz and company, we do not expect any significant change in the path of monetary policy or the communication thereof at this juncture. This has not increased the likelihood that they’ll raise rates at the upcoming September meeting (market implied odds have in fact fallen since the weekend). The most probable timing for the next hike remains October.
Will the Fed’s Balance Sheet Ever Return to “Normal”? Part I
Executive Summary
The size of the Fed's balance sheet ballooned in the years after the financial crisis. Although the balance sheet is now slowly shrinking, it is clear that it will not return to its pre-crisis level. In the first of two reports, we delve into the liability side of the balance sheet. Over the past 10 years, there has been a natural increase in currency in circulation as well as the cash balances that the U.S. Treasury maintains at the Fed. In addition, changes in Fed operating procedure also have led to sizable increases in the amount of reverse repurchase agreements as well as the excess reserves that financial institutions desire to hold at the Fed. We estimate that the unwinding process will come to an end in late 2019/early 2020 when the balance sheet will total roughly $3.7 trillion. Thereafter, the balance sheet will start to grow again in line with organic growth in the Fed's liabilities. The size of the Fed's balance sheet will have implications for both short- and long-term interest rates in coming years, which we will discuss in Part II.
Fed Assets and Liabilities: Two Sides of the Same Coin
The balance sheet of the Federal Reserve, which totaled about $900 billion in autumn 2008, subsequently mushroomed to $4.5 trillion by early 2015 (Figure 1). Not only did the FOMC put in place a host of programs to prevent the financial system from collapsing during the darkest days of the financial crisis, it also initiated a program of quantitative easing after the target for the fed funds rate reached a range of 0.00 percent to 0.25 percent. Since then, the balance sheet has slowly receded to about $4.2 trillion at present, and many market participants are asking what its ultimate size will be once the shrinking process has come to an end.
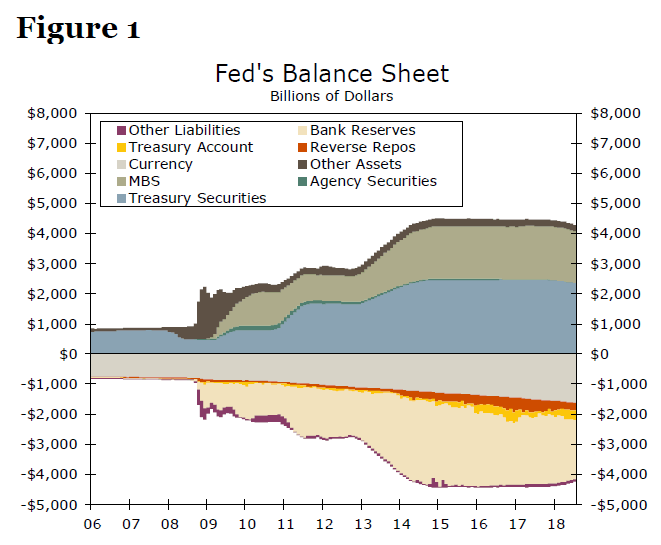
In the first of two reports on this subject, we decompose the Fed's liabilities to come up with an estimate of the ultimate size of the balance sheet. Ultimately, the Fed will match its assets against what it believes to be the appropriate size and mix of liabilities, making the liability side of the balance sheet key to estimating its size going forward. As shown in Figure 1, the bulk of the Fed's liabilities consist of currency in circulation, which accounts for 38 percent of the Fed's total liabilities at present, reverse repurchase agreements (6 percent), and the cash balances that the U.S. Treasury holds at the Fed (8 percent). Prior to the financial crisis, the reserves that financial institutions held at the Fed accounted for just a small share of the Fed's liabilities. The Fed financed its sizeable purchases of Treasury securities and mortgage-backed securities (MBS) in the years following the financial crisis via a marked increase in the amount of reserves that financial institutions hold at the Fed. Today, those reserves account for 46 percent of the Fed's liabilities. As we will describe in more detail subsequently, reserves of financial institutions will need to decline if the Fed wants to shrink its balance sheet in a meaningful way.
In the remainder of this report, we delve further into the four major components of the Fed's liabilities. We then generate a forecast for the liability side of the Fed's balance sheet. In our second report, we will decompose the asset side of the balance sheet and discuss implications for interest rates and financial markets.
Currency in Circulation
As shown in Figure 2, the amount of U.S. currency in circulation has doubled from about $800 billion before the Great Recession to more than $1.6 trillion at present.1 Nominal GDP has grown by roughly 40 percent over the past 10 years, so some of the increase in currency in circulation simply reflects the larger size of the economy. But, growth in nominal GDP does not explain the entire increase in currency outstanding, because the currency-to-GDP ratio has risen from about 5 percent prior to the Great Recession to about 8 percent today.
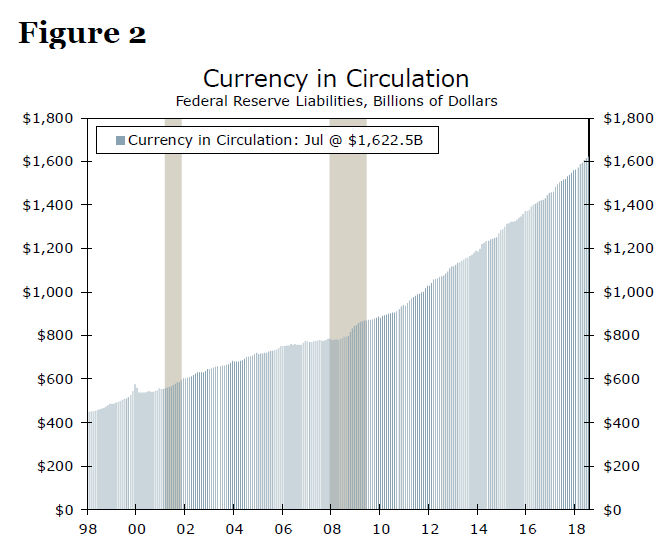
Low interest rates, which reduce the opportunity cost of holding cash, may have played a role in stoking the demand for currency in circulation, at least in the years in the immediate aftermath of the Great Recession. However, the currency-to-GDP ratio has continued to trend higher since 2015 although interest rates have risen, so it would appear that low interest rates cannot account for the continued increase in currency outstanding.
Another major factor to take into account is foreign demand for currency. There is not much "hard" data, but the Federal Reserve recently estimated that more than half of the dollars outstanding circulate in foreign countries.2 Therefore, changes in foreign demand for U.S. cash from abroad can have a significant effect on total demand for currency. Economic and political instability abroad has contributed to increased demand for U.S. cash, which is a likely explanation for a breakdown in the expected relationship between interest rates and currency use.3 A comparison with Canada is instructive. The currency-to-GDP ratio in Canada is about one-half of the comparable ratio in the United States despite similar payment systems and monetary policy stances between the two countries. U.S. dollars are widely held by foreigners; Canadian dollars are not.
To forecast the growth of currency outstanding going forward, we assume that the currency-to-GDP ratio will remain unchanged at 7.9 percent. We then use our forecast of nominal GDP growth in coming years to estimate that currency in circulation will rise by $20 billion or so per quarter in coming quarters.
Reverse Repurchase Agreements
Before it started the process of policy "normalization," the Fed announced in September 2014 that it intended to use an overnight reverse repurchase agreement (ON RRP) facility as a supplementary policy tool to help control the federal funds rate and keep it in the target range set by the FOMC.4
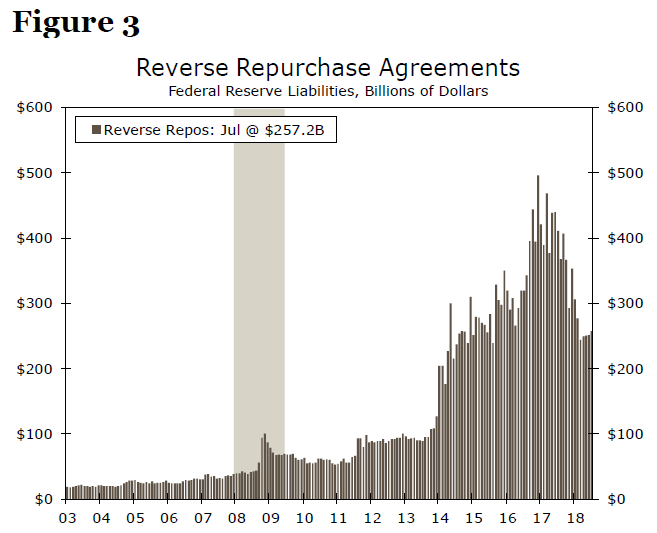
In short, the reverse repurchase agreements help provide a floor on short-term interest rates by allowing investors to lend to the Fed on an overnight basis. The list of eligible counterparties is much broader for the ON RRP program than for the bank-dominated list of institutions eligible to earn interest on excess reserves.5 As long as a broad range of counterparties are eligible to participate in the program, lenders will have few incentives to lend below this rate. Participation in the program has waxed and waned depending on alternative short-term investment options. For example, Treasury bill issuance surged to start 2018; the $333 billion in net issuance in Q1-2018 was the most since late 2008 when the federal deficit exploded as the economy tanked. This significant increase in issuance subsequently put upward pressure on T-bill yields, increasing the spread between T-bills and the reverse repo rate offered by the Federal Reserve. If the spread between these close substitutes widens, lending money to the Fed will become less attractive, all else equal. While this Q1-2018 explosion of issuance in Treasury bills was somewhat of a perfect storm, the ominous outlook for the budget deficit in the years ahead should ensure a steady expansion of T-bill supply. Coming up with a precise forecast of the ON RRP facility is complicated by the many factors that determine demand for these financial instruments, so we assume that the amount of reverse repos outstanding remains unchanged at its current level of roughly $250 billion (Figure 3).
Treasury Cash Balances
Another major component of the Fed's liabilities is the account maintained by the U.S. Treasury at the Federal Reserve. In addition to its numerous other responsibilities, the Fed acts as the U.S. government's bank, helping to manage activities such as the government's daily cash flows. Historically, the cash balance kept by the Treasury was rather small, with figures well below $50 billion before the Great Recession (Figure 4). In mid-2014, however, the Treasury undertook a review of its cash balance policy and determined that it would be prudent to maintain a larger cash balance. By mid-2015, the Treasury adopted the following policy: "Treasury will hold a level of cash generally sufficient to cover one week of outflows in the Treasury general account, subject to a minimum balance of roughly $150 billion."6
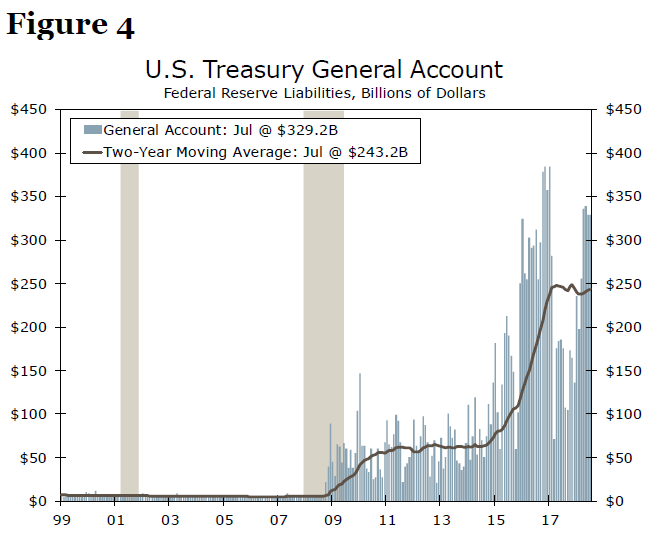
Smoothing through the fluctuations caused by debt ceiling complications, a two-year moving average reveals that the cash balance sharply ramped up in 2015 and has averaged just shy of $250 billion over the past two years, roughly in line with average weekly outflows over that period (Figure 4). Thus, in light of this policy change, the U.S. Treasury's general account at the Fed is likely to remain much larger in the future than it was before the Great Recession. This is yet another driver of a Fed balance sheet that will likely remain historically large in the years ahead. We assume the Treasury's cash balance on average will remain unchanged at its recent average of $250 billion in coming years.
Reserves of Financial Institutions
As noted earlier, the reserves of financial institutions are the largest single liability on the Fed's balance sheet. At present, these reserves total about $2 trillion, but only $190 billion are required reserves. In other words, the vast majority of the reserves that financial institutions hold at the Fed are excess reserves. Prior to the financial crisis, financial institutions wanted to hold few excess reserves, because they earned no interest on them. So, does this mean that excess reserves will eventually dwindle to essentially zero again? If so, the Fed could shrink its balance sheet significantly and manipulate the fed funds rate as it did before the Great Recession by altering the supply of excess reserves through open market operations.
In our view, financial institutions will desire to hold significant quantities of excess reserves, at least for the foreseeable future. For starters, the Fed now pays interest on excess reserves. Although financial institutions can earn more than the 1.95 percent that the Fed currently pays for excess reserves, the "loan" to the Fed is risk free. If, as we forecast, the Fed continues to raise rates (including the interest rate that it pays on excess reserves), then the quantity demanded of excess reserves will increase, everything else equal.
Second, regulatory changes have given financial institutions a reason to hold excess reserves. Specifically, large banks must meet a liquidity coverage ratio (LCR). In short, the LCR requires that large banks hold a certain level of highly liquid assets to meet their short-term obligations in a period of significant liquidity stress.7 There are multiple buckets into which high-quality liquid assets are grouped, and reserves held at the Fed are counted in the safest and most liquid "Level 1" bucket. In addition, reserves at the Fed are in theory unlimited, while the supply of other short-term liquid assets, such as Treasury bills or highly-rated commercial paper, can ebb and flow based on exogenous factors such as the U.S. budget deficit. From a regulatory standpoint, this fixed level of demand must be met somehow, and excess reserves provide a useful safety net to ensure this need is met. Thus, banks now not only earn a competitive market rate on their excess reserves, but also have a strong regulatory incentive to hold excess reserves, two noteworthy changes from the pre-2008 period.
Third, the Fed may want financial institutions to hold excess reserves due to monetary policy implementation. The current system of using interest on excess reserves and ON RRPs to keep the fed funds rate in a target range allows the Fed to keep quantitative easing readily accessible should the need arise. If the Fed were to wind down excess reserves to a level where the old system of open market operations sets the fed funds rate, the Fed would need to bounce back and forth between operational systems should it desire to utilize QE again, which policymakers and financial markets might find unsettling. Furthermore, while there have been some speed bumps along the path of normalization (a topic we will discuss more in Part II), the current monetary policy transmission system has been broadly successful at achieving its main policy goal of pulling short-term interest rates higher throughout the economy.
Data on the amount of reserves that individual institutions hold at the Fed are not readily available for all large banks that are covered by the LCR. However, we do have a detailed breakdown of the LCR buckets for three of the largest banks in the United States from their 10-Qs. We assume that the other large banks hold reserves at the Fed in the same proportion to their overall LCR holdings as the three banks for which we have data. This assumption allows us to estimate the total reserves that banks currently hold at the Fed for LCR purposes. Our back-of-the-envelope calculations suggest that total bank reserves exceed the reserves that are held for LCR purposes by about $700 billion at present, which gives the Fed some room to shrink its balance sheet further. Of course, reserve holdings for LCR purposes will increase in coming quarters as the deposit bases of banks continue to grow.
When and Where Will the "Terminal" Size Be Reached?
Adding up our forecasts of currency in circulation, the amount of ON RRPs outstanding, the Treasury's cash balance, and bank reserves for LCR purposes gives us a forecast of the liability side of the Fed's balance sheet. As noted earlier, we estimate that there are nearly $700 billion worth of "excess" liabilities on the Fed's balance sheet at present (Figure 5). Of course, liabilities must equal assets at all times. But those "excess" liabilities largely reflect excess reserves that banks do not need or necessarily want at present. Indeed, the size of the Fed's balance sheet has declined by about $270 billion since early 2015 as the excess reserves held by the commercial banking system have dropped by about $750 billion over that period (currency in circulation and the Treasury's account at the Fed have both risen over the past three years).
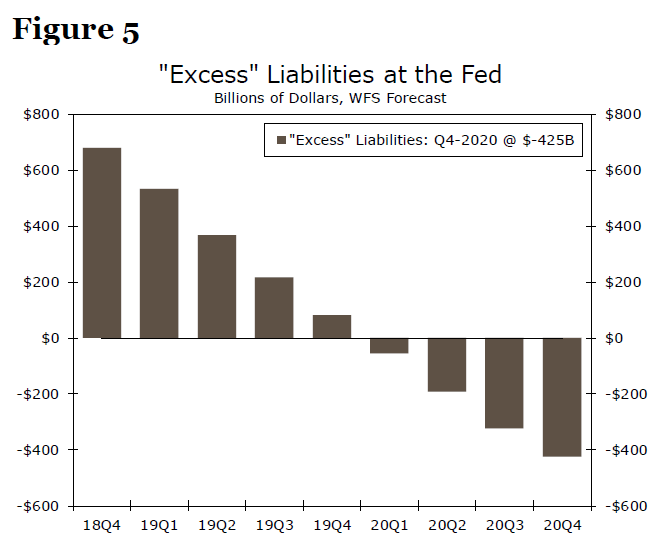
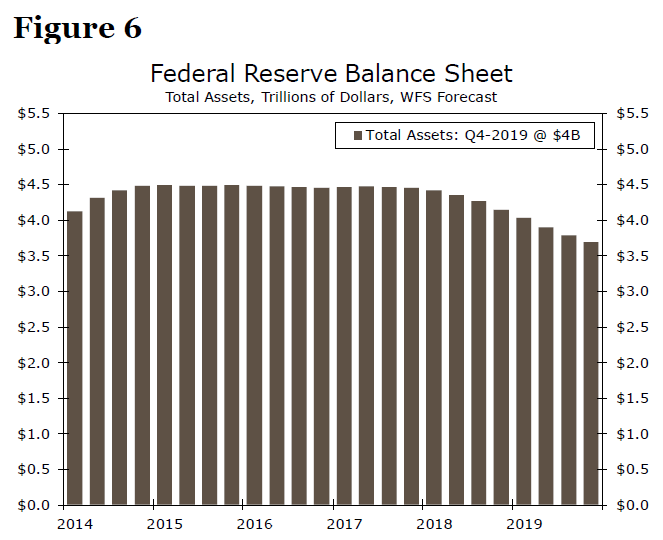
"Excess" liabilities will shrink in line with the asset side of the balance sheet. The Fed is currently allowing a maximum of $24 billion worth of Treasury securities and $16 billion worth of MBS to roll off its balance sheet each month. These maximum amounts will increase to $30 billion and $20 billion respectively in October, and then remain at those levels as long as the shrinkage of the balance sheet is underway, but our analysis shows that that process will come to an end in another year or so. Specifically, our calculations show that "excess" liabilities will be exhausted by 2019/early 2020, at which point the Fed's balance sheet would total roughly $3.7 trillion (Figure 6). Starting in 2020, the balance sheet would need to increase again due, at least in part, to continued growth in the volume of currency in circulation. The likely need of the Department of the Treasury to gradually raise its cash account would also put upward pressure on the size of the Fed's balance sheet at that time.
Conclusion
The size of the Fed's balance sheet ballooned from less than $1 trillion prior to the financial crisis to a peak of $4.5 trillion in early 2015. The size of the balance sheet remained more or less unchanged through 2016 and 2017, but it has been shrinking noticeably in recent months. Our analysis suggests that the balance sheet will shrink further over the next year or so, but that the process will come to an end in late 2019/early 2020 when the balance sheet would total about $3.5 trillion. Unless regulations and the operating procedure of the Fed revert back to their precrisis modes, which we do not believe will happen anytime soon, banks will desire to hold excess reserves at the Fed. Furthermore, the Fed will naturally have higher liabilities than it did 10 years ago due to the increase in demand for currency and higher cash balances of the U.S. Treasury.
We acknowledge, however, that there is some uncertainty surrounding our estimate of when the unwinding process of the balance sheet comes to an end. The results of our analysis depend heavily on our assumptions about the currency-to-GDP ratio going forward, Treasury cash balances, ON RRPs outstanding and bank's demand for excess reserves. There is also some uncertainty on the asset side of the Fed's balance sheet. As we will discuss in more detail in our second report, the Fed's MBS holdings, which total about $1.7 trillion at present, may not roll off as quickly as we currently project. A larger-than-expected increase in mortgage rates, should it occur, would discourage refinancing, thereby slowing MBS redemptions. Although the unwinding of the balance sheet may take longer than we currently envision, the Fed's balance sheet will remain sizable. As we discuss in our next report, the significant holdings of Treasury securities that the Fed is likely to maintain will have implications for both short- and long-term interest rates going forward.
1 Paper currency in the United States contains the label "Federal Reserve Note" at the top of each note.
2 Ruth Judson, "The Death of Cash? Not So Fast: Demand for U.S. Currency at Home and Abroad, 1990- 2016," (paper presentation, Deutsche Bundesbank International Cash Conference 2017, War on Cash: Is There a Future for Cash?, Island of Mainau, Germany, April 26, 2017).
3 Thomas Haasl, Anna Paulson & Sam Shulhofer-Wohol, "Understanding the Demand for Currency at Home and Abroad," Chicago Fed Letter 396 (2018).
4 For a timeline of FOMC communications related to policy normalization, see the following https://www.federalreserve.gov/monetarypolicy/policy-normalization.htm
5 For a full-list of eligible reverse repo counterparties, see the following from the Federal Reserve Bank of New York https://www.newyorkfed.org/markets/rrp_counterparties.html
6 U.S. Treasury. "Quarterly Refunding Statement of Acting Assistant Secretary for Financial Markets Seth B. Carpenter." May 6, 2015. https://www.treasury.gov/press-center/press-releases/Pages/jl10045.aspx
7 For a brief summary of the LCR, see this piece from the Bank for International Settlements https://www.bis.org/fsi/fsisummaries/lcr.htm
Yen Gains Ground as Retail Sales Beats Expectations
The Japanese yen has edged higher in the Thursday session, erasing the losses seen on Wednesday. In North American trade, the pair is trading at 111.26, down 0.38% on the day. On the release front, Japanese retail sales dropped to 1.8%, but still beat the estimate of 1.5%. Later in the day, Japan releases Tokyo Core CPI, with a forecast of 0.8%. In the U.S, Core PCE Price Index edged up to 0.2%, while Personal Spending remained pegged at 0.4%. Both of these indicators matched the estimates. Unemployment claims rose to 213 thousand, just below the forecast of 214 thousand.
Investors are keeping a close eye on Tokyo Core CPI, the fourth Japanese inflation indicator this week. Although the indicators have been within expectations, inflation remains a headache for the BoJ, as a radical program monetary easing has failed to coax inflation to the target of around 2 percent. Rather than reduce the inflation target, the Bank will likely postpone yet again the timeline for its 2% target to fiscal year 2020 or beyond. Massive quantitative and qualitative easing have failed to coax inflation higher, so policymakers may have to consider other means of fiscal easing in order to encourage more spending and push inflation higher.
The U.S economy continues to fire on all cylinders. GDP for Q2 was revised upwards to 4.2%, edging above the estimate of 4.0%. This reading was above the initial GDP release of 4.1% back in July. Growth in the second quarter was much stronger than in Q1, which posted a gain of 2.2%. Will the strong data continue in the third quarter? Consumer spending has been strong early in the quarter, but housing data has disappointed, with recent key indicators missing expectations.
Canadian Dollar Dips after Soft GDP, NAFTA Talks Continue
The Canadian dollar has reversed directions on Thursday and posted considerable losses. In the North American session, USD/CAD is trading at 1.2997, up 0.69% on the day. On the release front, Canadian GDP dipped to 0.0%, shy of the estimate of 0.1%. In the U.S, Core PCE Price Index edged up to 0.2%, while Personal Spending remained pegged at 0.4%. Both of these indicators matched the estimates. Unemployment claims rose to 213 thousand, just below the forecast of 214 thousand.
Canada’s economy remained flat in June, with a disappointing reading of 0.0%. Second quarter growth climbed 2.9% at an annualized rate, shy of the estimate of 3.0%. The soft reading has sent the Canadian dollar lower on Thursday, after four consecutive winning sessions. At the same time, growth in Q2 improved significantly over the previous quarter, which recorded growth of just 1.4%. Meanwhile, NAFTA remains in the spotlight, with senior officials from both the U.S and Canada saying that a new NAFTA pact could be signed as early as Friday. Earlier in the week, Mexico and the U.S reached a new trade agreement, and Canada is expected to follow suit, after months of negotiations.
The U.S economy continues to fire on all cylinders. GDP for Q2 was revised upwards to 4.2%, edging above the estimate of 4.0%. This reading was above the initial GDP release of 4.1% back in July. Growth in the second quarter was much stronger than in Q1, which posted a gain of 2.2%. Will the strong data continue in the third quarter? Consumer spending has been strong early in the quarter, but housing data has disappointed, with recent key indicators missing expectations.
USD/CAD Mid-Day Outlook
Daily Pivots: (S1) 1.2887; (P) 1.2924; (R1) 1.2947; More...
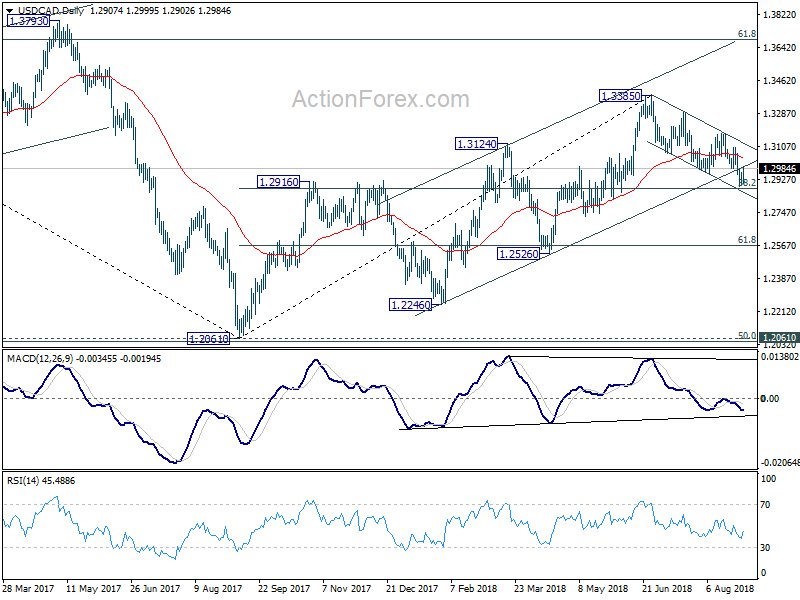
USD/CAD's break of 1.2981 minor resistance suggests that a short term bottom could be formed at 1.2886, just ahead of 1.2879 fibonacci level. Intraday bias is now mildly on the upside for recovery towards near term channel resistance (now at 1.3118). But break of 1.3173 resistance is needed to confirm completion of the choppy fall from 1.3385. Otherwise, out will remain cautiously bearish for another fall.
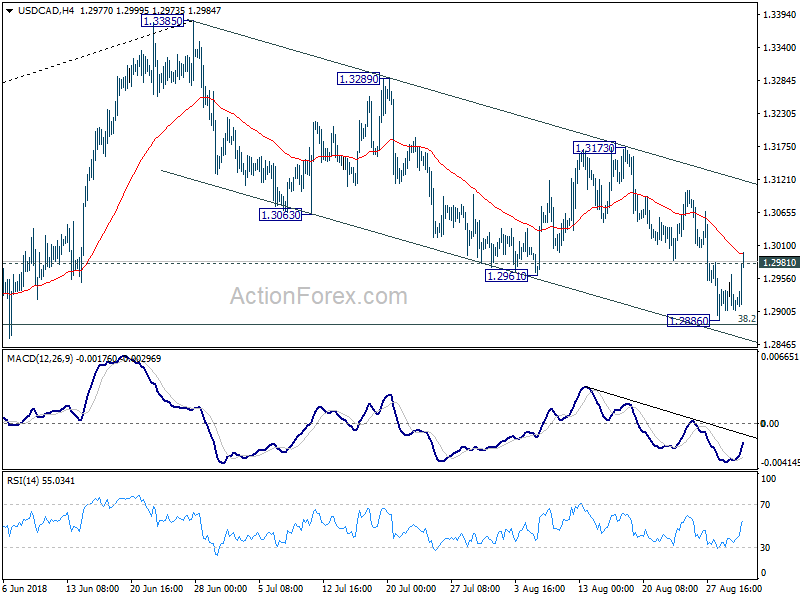
In the bigger picture, the break of channel support (now at 1.2988), argues that rise from 1.2246, as well as that from 1.2061, has completed at 1.3385. Focus is back on 38.2% retracement of 1.2061 to 1.3385 at 1.2879. Decisive break there will affirm the case of medium term reversal and target 61.8% retracement at 1.2567 and below. That will also put key long term support at 50% retracement of 0.9406 (2011 low) to 1.4689 (2015 high) at 1.2048 into focus. On the upside, break of 1.3173 resistance will revive the bullish case and target 61.8% retracement of 1.4689 to 1.2061 at 1.3685 and above.
Canadian Q2 GDP Growth Bounces Higher
Highlights:
- Canadian Q2/18 GDP growth rose to 2.9% from 1.4% in Q1. The Q2 gain was marginally below market expectations of a 3.1% increase though slightly above the Bank of Canada’s forecasted 2.8% gain.
- Q2 GDP strength largely reflected both exports rising an annualized 12.3% after increasing only 2.4% in Q2 along with a strengthening in consumer spending growth to 2.6% from 1.0% in Q1.
- The bounce in consumer spending contributed to domestic demand rising 2.1% from a 1.7% Q1 increase with the gain restrained by residential and business investment rising 1.1% and 1.9%, respectively.
Our Take:
As expected, Canadian Q2 GDP growth strengthened to an annualized 2.9% up from the disappointing 1.4% gain in Q1. The strengthening largely reflected a rebound in exports along with some strengthening in consumer spending. Both areas had been negatively impacted by adverse winter weather in the first quarter with these pressures easing in Q2. The wage measures in today’s GDP report, along with the separate May ‘SEPH’ employment earnings numbers also out this morning, point to the Bank of Canada’s ‘wage-common’ measure rising 2.4% in Q2 little changed from the increase in the first quarter. There had been speculation that economic conditions remained sufficiently robust to prompt the Bank of Canada hiking the overnight rate as early as the upcoming policy meeting next Wednesday. This expectation had been abetted further by guarded optimism that a re-negotiated NAFTA deal was close at hand. However, this morning’s Q2 GDP report likely tempered those expectations as it was only slightly above the 2.8% the Bank of Canada had assumed in its latest forecast released in April. As well, the wage data do not imply an imminent threat to the central bank’s 2% inflation target. With respect to NAFTA developments, Bank of Canada actions are expected to be more guided by how businesses eventually respond to whatever emerges from the negotiations. Economic conditions in our view likely remain sufficiently strong to warrant further tightening though at a measured pace. Thus our expectation is that the overnight rate will likely rise 25 basis points before the end of the year though more likely in October rather than next week’s policy meeting.
Crude Oil: Sees Further Upside, Eyes The 70.41 Region
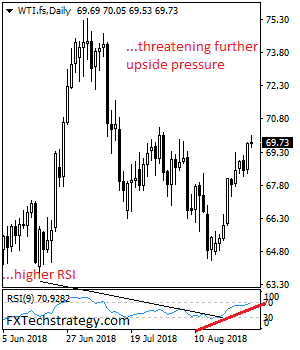
CRUDE OIL - The commodity faces further recovery threats following its higher close on Wednesday. On the downside, support resides at the 69.50 level where a break will expose the 69.00 level. A cut through here will set the stage for a run at the 68.50 level. Further down, support resides at the 68.00 level. On the upside, resistance resides at the 70.50 level. Further out, resistance comes in at the 71.00 level. A break above here will aim at the 71.50 level and then the 72.00 level followed by the 72.50 level. Its daily RSI is bullish and pointing higher suggesting further strength. All in all, CRUDE OIL remains biased to the upside.
Sunset Market Commentary
Markets
Global core bonds recovered some lost ground today with German Bunds outperforming US Treasuries. Disappointing Spanish and (regional) German inflation data triggered Bund strength. EC confidence remains at an elevated level, but recorded an 8th straight decline and printed also below consensus. US eco data (PCE inflation, weekly jobless claims, personal income/spending data) were spot on forecasts and didn’t alter today’s trading picture. Risk sentiment on (European) stock markets was shaky, with indices correcting lower for the first time since mid-August. End-of-month extension flows make the positive core bond picture complete. German yields lose 2.3 bps (2-yr) to 4 bps (belly of the curve). US yield declines range between -1 bp (2-yr) and -2 bps (5-yr) with the belly of the curve also outperforming. Peripheral bonds underperform vs Germany in today’s risk-off session with Greece and Italy (+14 bps) being worst off. The Italian 10-yr yield spread (285 bps) now approaches the post-election high (290 bps) despite a well-received Italian BTP auction today. Portuguese and Spanish spreads add 5 bps.
Today, the dollar initially held tight ranges even as there were plenty of eco data both in Europe and in the US. EC confidence data were softer than expected and German HICP inflation (1.9% vs 2.1% expected)printed also below consensus. US data (spending and income, price deflators and jobless claims) were almost completely in line with expectations. Bunds outperformed US Treasuries, widening the interest rate differential in favour of the dollar. Initially this wasn’t enough to inspire any clear directional price action in EUR/USD. However, this time US equity futures failed to reverse the risk-off mode that dominated trading in Asia and Europe. EUR/USD finally turned south. The pair is currently changing hands in the 1.1665 area. The safe haven yen is also a better bid across the board. USD/JPY is drifting lower in the 111 big figure (currently 111.40 area). EUR/JPY reversed yesterday’s gain and struggles not to fall below the 130 mark. Several EM currency also feel growing headwinds.
Yesterday, sterling succeeded a surprise rebound. The move was said to be due to ‘soft’ comments from EU Brexit negotiator Barnier. EUR/GBP dropped below the 0.90 mark. Today, the quotes from Barnier (and also from other parties involved in the process) were less ‘soft’. Barnier ‘hedged ‘ yesterday’s comments with the assessment that the EU must prepare for a no-deal scenario even if the goal is to reach an orderly brexit. Sterling hardly reacted to those ‘less soft’ comments of Barnier. This confirms the view that yesterday’s sterling rebound was in the first place a technical, order driven squeeze in a market that was positioned ‘sterling short’ rather than a reaction to the Barnier comments. In the same context, sterling also ignored weak UK July lending data (consumer credit and housing related credit). Still sterling maintained most of yesterday’s gain. EUR/GBP even lost further ground in line with EUR/USD. The pair trades in the 0.8970 area. Cable hovered closed to, mostly slightly north of 1.30.
News Headlines
German CPI (EU Harmonized) unexpectedly declined in August from 2.1% to 1.9% (YoY). Market consensus expected inflation 2.1%. In Spain, the HICP inflation also eased from 2.3% Y/Y to 2.2%. The data suggest downside risks for the EMU CPI release expected tomorrow.
Argentina’s central bank has increased its interest rates by 15 percentage points to 60%. The move came after its currency fell 15% in early trading today. The central bank’s rate hike follows the comments of president Mauricio Macri yesterday, asking the IMF to speed up the disbursement of its $50bn bailout package.
China announced new measures to support its economy, as an escalating trade war with the US threatens Chinese exporters. China’s cabinet said today those measures should reduce firms’ costs by over $6.5bn, by speeding up infrastructure spending and offering help to smaller companies.
EUR/USD Mid-Day Outlook
Daily Pivots: (S1) 1.1668; (P) 1.1690; (R1) 1.1728; More.....
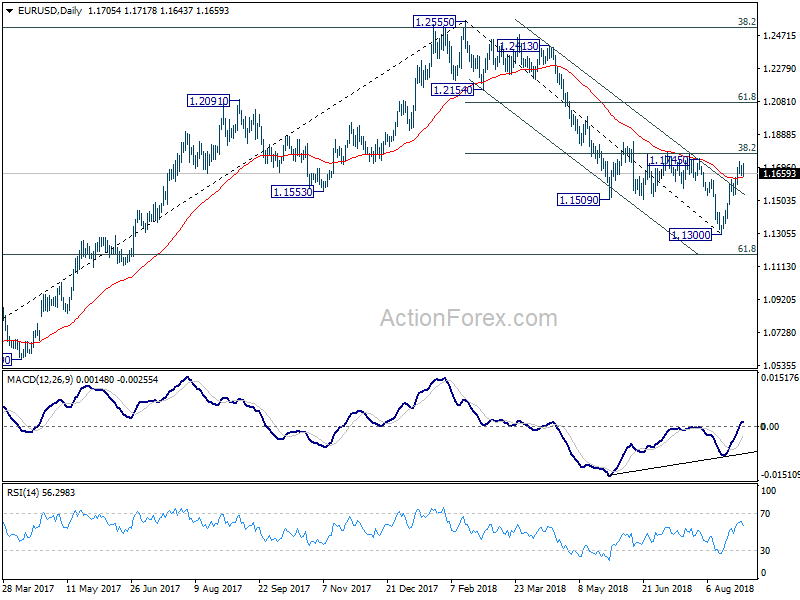
EUR/USD is staying in consolidation from 1.1733 temporary top and intraday bias remains neutral first. At this point, further rise cannot be ruled out yet. But we'd continue to expect strong resistance from 38.2% retracement of 1.2555 to 1.1300 at 1.1779 to limit upside, at least on first attempt, to bring near term reversal. On the downside, break of 1.1529 minor will indicate completion of the rebound and turn bias to the downside for retesting 1.1300 low. After all, consolidation from 1.1300 will extend for a while before completion.
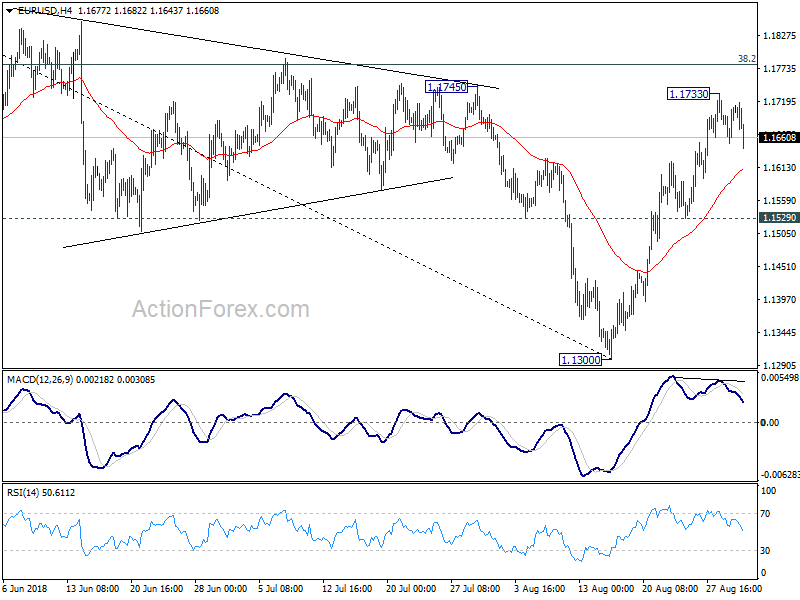
In the bigger picture, a medium term bottom should be in place at 1.1300, on bullish convergence condition in daily MACD and some consolidations would be seen. But still, note that EUR/USD was rejected by 38.2% retracement of 1.6039 (2008 high) to 1.0339 (2017 low) at 1.2516. That carries some long term bearish implications. Thus, we'd expect fall from 1.2555 high to resume after consolidation completes. Below 1.1300 should send EUR/USD through 61.8% retracement of 1.0339 to 1.2555 at 1.1186. And, in that case, EUR/USD would head to retest 1.0339 (2017 low).