
Sample Category Title
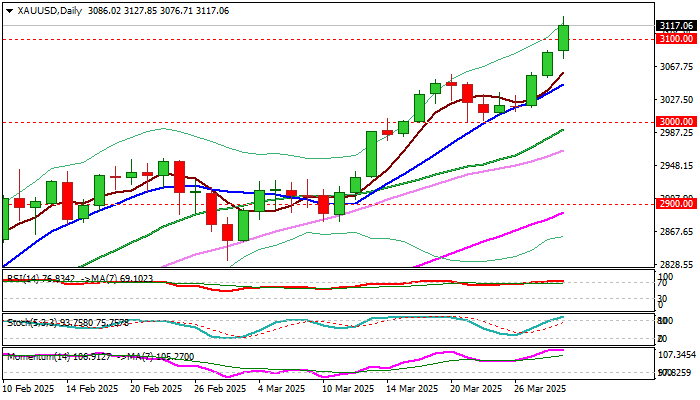
XAU/USD: Gold Hits New All-Time High Above $3,100
Gold surged through round-figure barrier at $3100 and hit new record high on Monday, with growing economic and geopolitical uncertainty continuing to strongly boost safe haven demand.
US import tariffs which are due to start on Apr 2 and anticipated damage on global economy from escalation of trade war, as well as fragile geopolitical situation are expected to continue to fuel migration into safety.
The yellow metal’s price remains in a steep uptrend from $2000 zone and is on track for the biggest monthly gain in 14 years in March and also for the biggest quarterly advance in nearly four decades (over 18%).
Next targets lay at $3156, $3173 (Fibo projections) and $3200 (psychological).
Overbought daily studies suggest that bulls may take a breather with dips likely to be shallow on strong bullish sentiment.
Broken $3100 level reverted to initial support, followed by former top ($3057) and rising 10DMA (3045) guarding lower breakpoint at $3000.
Res: 3127; 3156; 3173; 3200.
Sup: 3010; 3057; 3045; 3017.
Crypto’s Dive
Market Picture
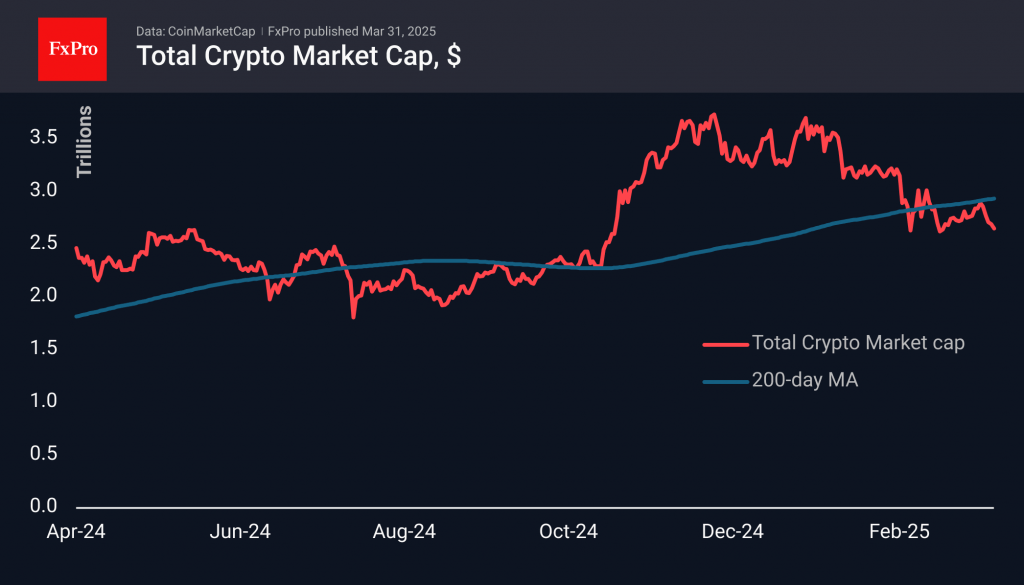
Crypto market capitalisation has fallen 1.3% in the last 24 hours and around 6.5% over the weekend, pulling back towards the lows of three weeks ago. The sell-off intensified after a failed attempt to climb above the 200-day average. It may turn out that the market’s recovery from 11 to 26 March was a rebound after a decline. A $2.56 trillion plunge below the March 11 lows could confirm this bearish scenario.
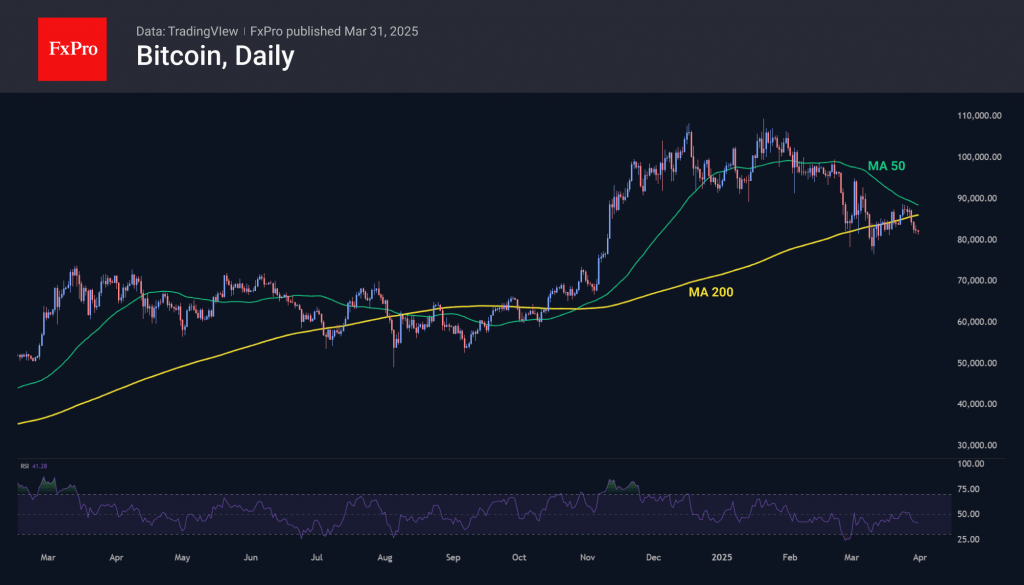
Bitcoin has pulled back below $82,000, having lost over 6% since Friday, when a sell-off in stock markets dampened enthusiastic sentiment. On Monday, the pressure in the markets remains, forcing us to consider BTC’s return below $80000 as the main scenario for the near term. Deepening below would open the way to $68000-72000, triggering a broader institutional sell-off.
XRP is moving down despite reports of Ripple and SEC proceedings ending. The coin’s price has pulled back to $2.05, testing the support area near where the reversal has been taking place since early December. A failure of this support is very likely due to the negative sentiment in the larger markets. But in this case, there is a risk of the start of a large capitulation, capable of taking up to 70% of the current price.

News Background
According to SoSoValue data, net inflows into spot bitcoin-ETFs almost quadrupled last week to $196.5 million to cumulative inflows since the approval of bitcoin-ETFs to $36.24bn. Net outflows from the ETH-ETF amounted to $8.6 million, decreasing the total inflow since this ETF’s launch to $2.41 billion.
CryptoQuant believes crypto funds are ‘at a critical turning point.’ Institutions are shaking up their portfolios and de-risking due to macroeconomic uncertainty, which is having a major impact on Bitcoin.
The US SEC has dropped lawsuits against cryptocurrency companies Kraken, ConsenSys and Cumberland. The cases have been dismissed due to ‘bias,’ making it impossible to re-file them.
Tron founder Justin Sun appeared on the cover of Forbes, becoming the second Chinese person after Jack Ma to be featured on the magazine’s cover. The news was met with wariness in the community, as in the past, the appearance of crypto industry representatives in Forbes was accompanied by a market decline.
ECB’s Panetta: Uncertainty demands caution on rate cuts
Italian ECB Governing Council member Fabio Panetta warned that the battle against inflation "cannot yet be said to be over." and urged caution in the timing of interest rate cuts.
In a speech today, Panetta pointed to the heightened uncertainty stemming from “contradictory” announcements on US trade policy, suggesting that such unpredictability complicates the ECB’s path forward. As a result, the central bank must continue to monitor "all the factors that could hinder the return to the 2% target"
Panetta emphasized the balancing act the ECB now faces. On one hand, subdued consumption and investment, driven by geopolitical tensions and weak Eurozone growth, are helping to ease inflationary pressures.
But on the other hand, the resurgence of uncertainty—particularly around US tariffs—means the ECB must remain vigilant and not rush into policy loosening.
ECB Lagarde: Europe must march toward economic independence amid tariff threats
ECB President Christine Lagarde emphasized the need for Europe to assert more control over its economic future in light of looming US tariffs, set to begin on April 2.
In a France Inter radio interview, Lagarde reframed the narrative around “Liberation Day,” saying that while the US sees it as a move toward sovereignty, Europe must seize it as an inflection point—“a march toward independence.”
Lagarde reiterated her previous estimates that tariffs from the US could shave around 0.3% off Eurozone growth in the first year. Should Europe retaliate with reciprocal measures, the negative impact could deepen to as much as 0.5%.
On inflation, Lagarde noted that keeping it in check remains a “constant battle.” She stressed that while some progress has been made, inflation needs to fall in a sustainable way. That, she said, requires a carefully calibrated interest rate policy.
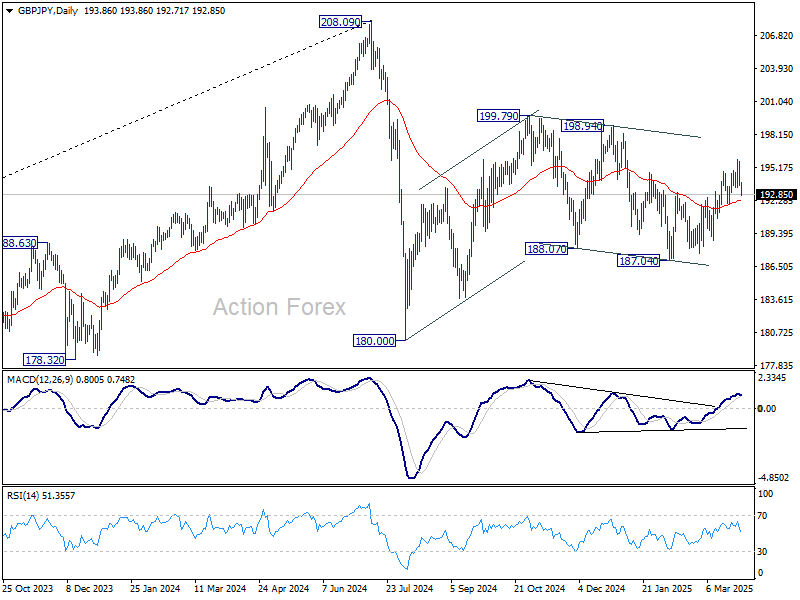
GBP/JPY Daily Outlook
Daily Pivots: (S1) 193.17; (P) 194.47; (R1) 195.20; More...
Intraday bias in GBP/JPY remains neutral at this point. On the upside, break of 195.95 will extend the rally from 187.04 once again, to 198.94 resistance. However, firm break of 192.00 support will turn bias back to the downside for deeper fall. Overall, corrective pattern from 180.00 is still extending.
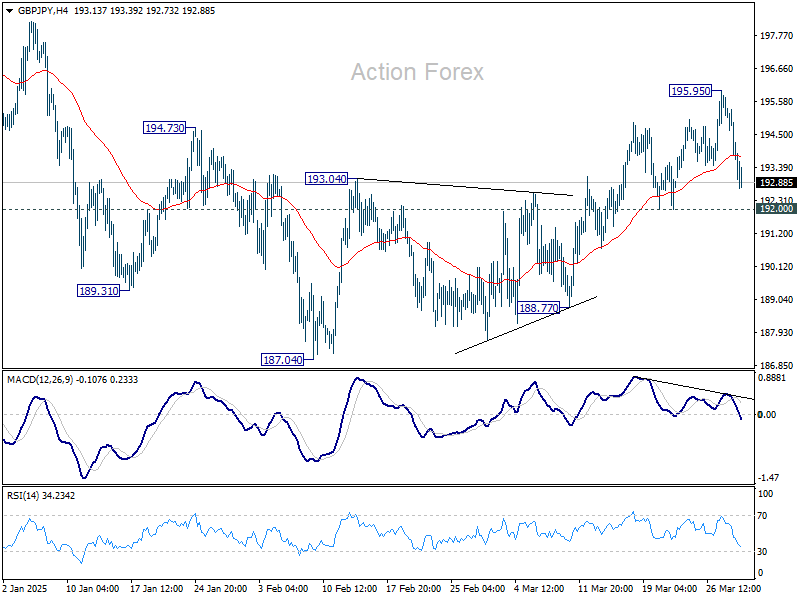
In the bigger picture, price actions from 208.09 are seen as a correction to rally from 123.94 (2020 low). Strong support should be seen from 38.2% retracement of 123.94 to 208.09 at 175.94 to contain downside. However, sustained break of 152.11 will bring deeper fall even still as a correction.
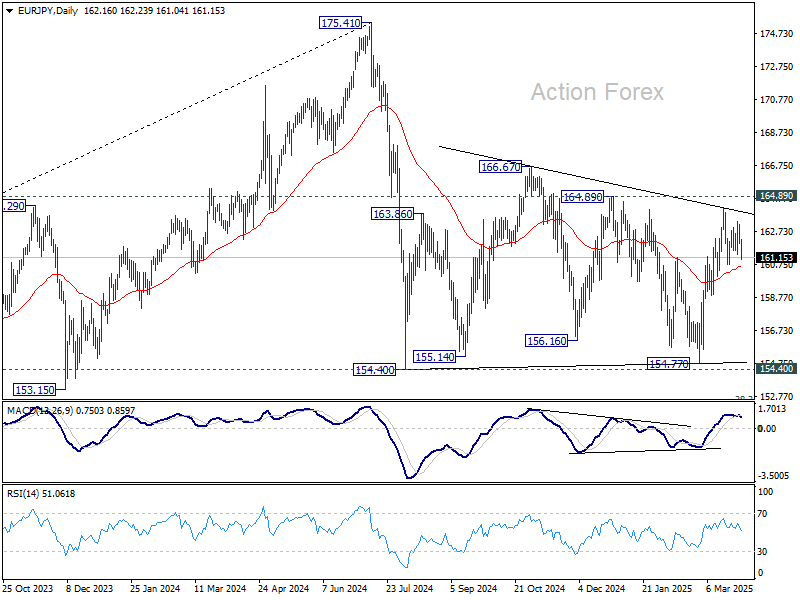
EUR/JPY Daily Outlook
Daily Pivots: (S1) 161.85; (P) 162.52; (R1) 162.96; More...
Intraday bias in EUR/JPY remains neutral for the moment. Further rise is in favor as long as 160.73 support holds. Above 164.16 will resume the rally from 154.77 to 164.89 resistance, and then 166.67. However, break of 160.73 will turn bias back to the downside for 158.87 support and below. Overall, sideway consolidation pattern from 154.40 is still extending.
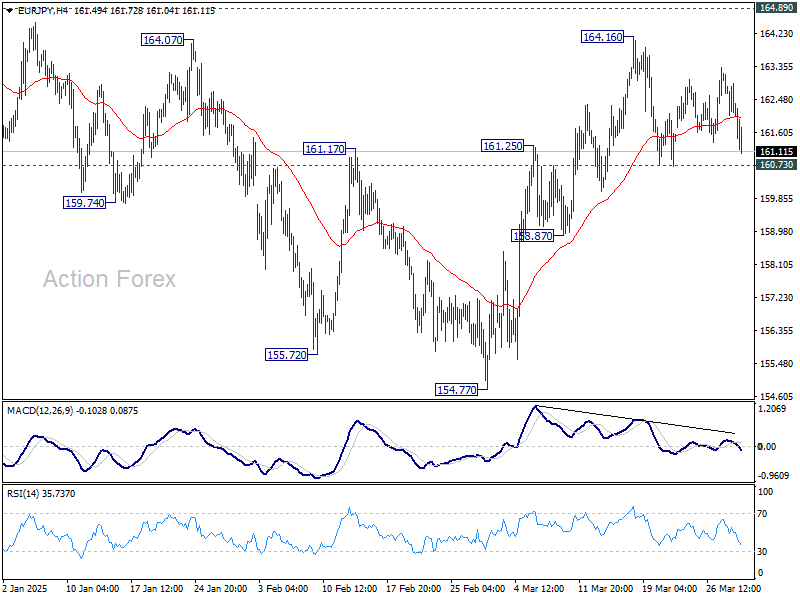
In the bigger picture, price actions from 175.41 are seen as correction to rally from 114.42 (2020 low). Strong support should be seen from 38.2% retracement of 114.42 to 175.41 at 152.11 to contain downside. However, sustained break of 152.11 will bring deeper fall even still as a correction.
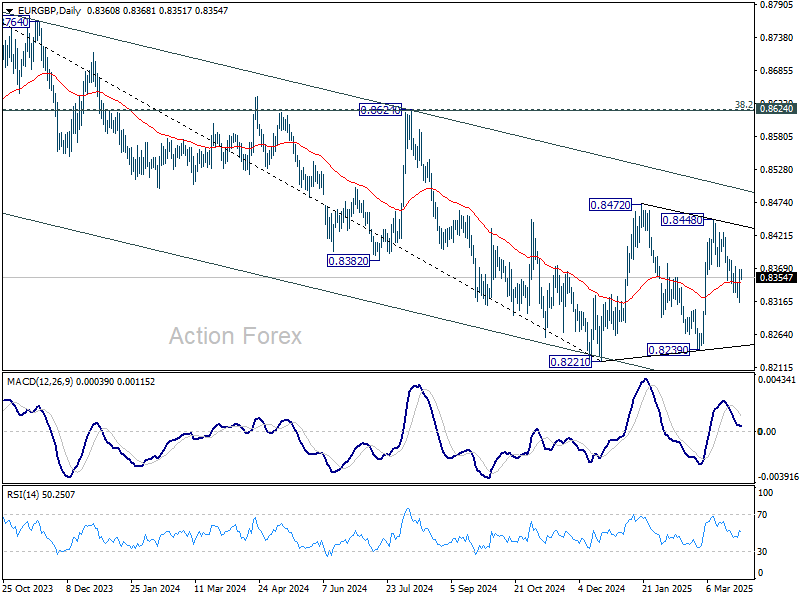
EUR/GBP Daily Outlook
Daily Pivots: (S1) 0.8333; (P) 0.8351; (R1) 0.8387; More...
Intraday bias in EUR/GBP remains neutral for the moment. On the downside, below 08314 will bring deeper fall back to 0.8239 support. However, firm break of 0.8373 minor resistance will argue that fall from 0.8448 is merely a correction and has completed. Retest of 0.8448 should be seen next.
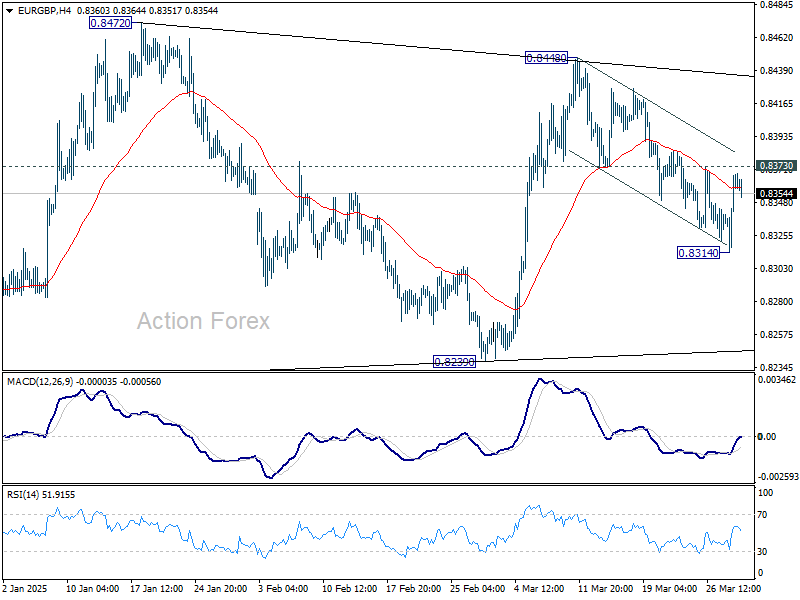
In the bigger picture, EUR/GBP is still bounded inside medium term falling channel. While rebound from 0.8221 might extend higher, it could still develop into a corrective pattern. Overall outlook will be neutral at best and down trend from 0.9267 (2022 high) could extend, at least until decisive break of channel resistance (now at 0.8495).
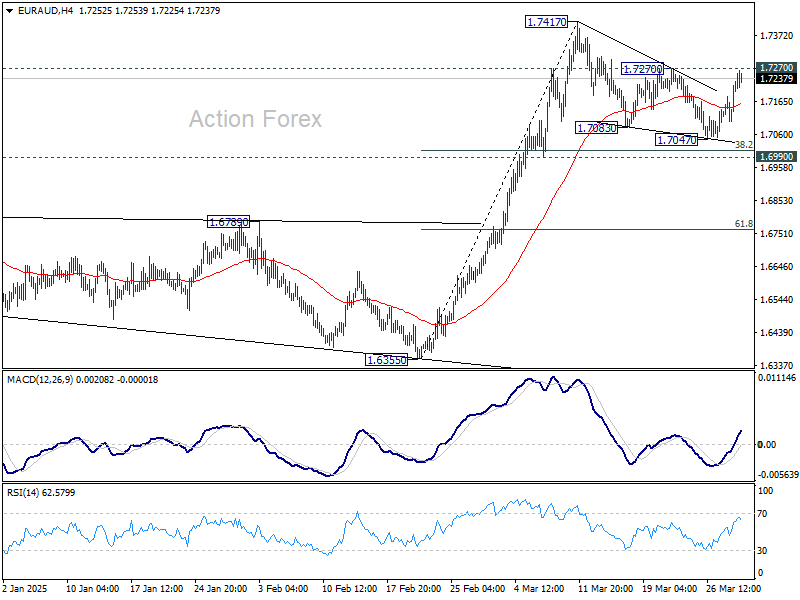
EUR/AUD Daily Outlook
Daily Pivots: (S1) 1.7146; (P) 1.7189; (R1) 1.7273; More...
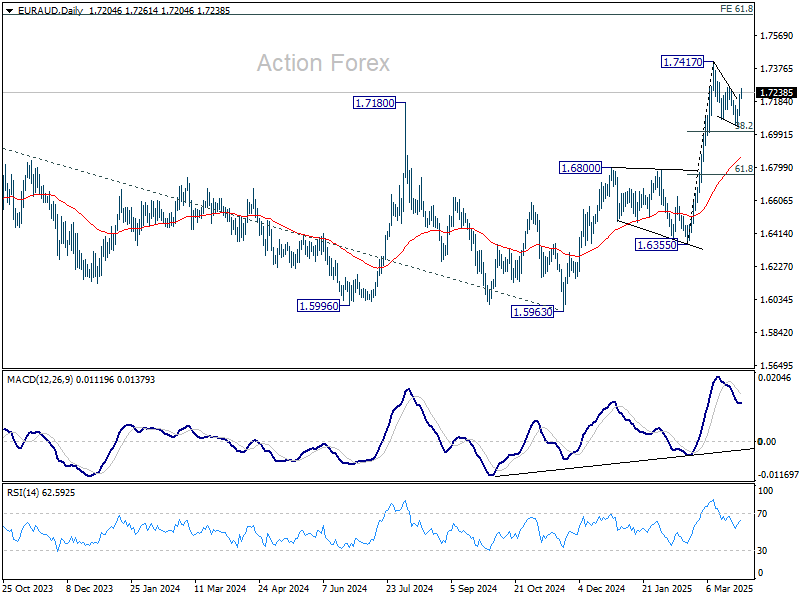
Intraday bias in EUR/AUD Remains neutral for the moment. On the upside, above 1.7270 resistance will argue that the correction has completed at 1.7047, and bring retest of 1.7417. Firm break there will resume larger rise from 1.6335. In case of another fall, downside is still expected to be contained by 1.6990 support to bring rebound.
In the bigger picture, the breach of 1.7180 key resistance (2024 high) suggests that up trend from 1.4281 (2022 low) is resuming. Sustained trading above 1.7180 will confirm and target 61.8% projection of 1.4281 to 1.7062 from 1.5963 at 1.7682, which is also close to 61.8% retracement of 1.9799 (2020 high) to 1.4281 at 1.7691. For now, this will remain the favored case as long as 1.6800 resistance turned support holds, even in case of deep pullback.
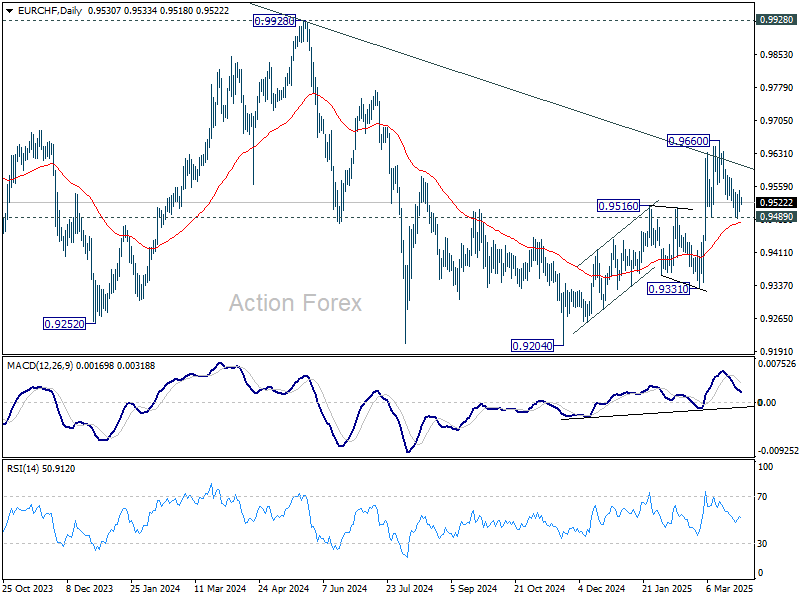
EUR/CHF Daily Outlook
Daily Pivots: (S1) 0.9511; (P) 0.9531; (R1) 0.9558; More....
Intraday bias in EUR/CHF remains neutral at this point. Strong support is still expected from 0.9486 to complete the correction from 0.9660. On the upside, above 0.9581 minor resistance will bring retest of 0.9660 high. Firm break there will resume whole rise from 0.9204. However, sustained break of 0.9489 will dampen this view, and bring deeper fall back to 0.9331 support next.
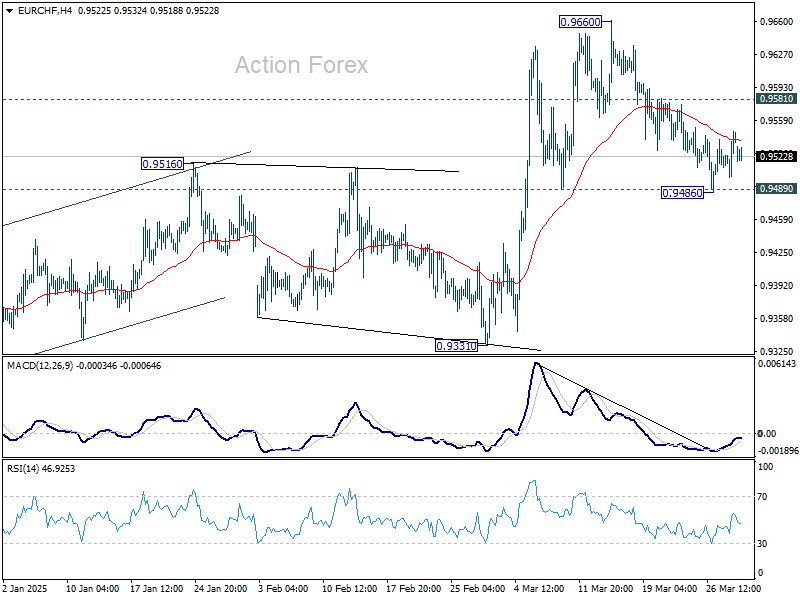
In the bigger picture, prior strong break of 55 W EMA (now at 0.9491) is a medium term bullish sign. Sustained break trading above long-term falling channel resistance (at around 0.9610) would suggest that the downtrend from 1.2004 (2018 high) has bottomed at 0.9204. Stronger rally should then be seen to 0.9928 key resistance at least.
USD/JPY Slides Further Below 149
Markets
The build-up to US President Trump’s “Liberation Day” is leaving very nasty scars on financial markets. Last Friday’s trading session was full risk-off with European stock markets losing around 1% and key US gauges dropping 1.7% to 2.7%. US indices are ready for/into a new fierce sell-off wave after falling out of the flag of a technical bearish flag formation and extending the sell-on-upticks pattern. Safe haven flows resulted in a correction higher in US Treasuries, but we doubt that they’ll be a long term beneficiary of current developments. US yields lost 8 bps to 11 bps in a daily perspective with the belly of the curve outperforming the wings. Treasuries outperformed German Bunds with daily German changes varying between -3.2 bps (30-yr) and -5.3 bps (5-yr). US eco data on Friday confirmed the stagflation risks with March inflation expectations in the Michigan consumer confidence survey showing upward revisions for bot the short term (1y) gauge (5% from 4.9%; highest since 2022) and long term (5-10y) measure (4.1% from 3.9%; highest since February 1993). In the meantime, the Atlanta Fed’s GDPNow estimate showed Q1 GDP shrinking by 2.8% Q/Qa vs the previous release’s estimate of -1.8% Q/Qa. Unlike US Treasuries, the US dollar failed to even briefly profit from the risk-off climate given the rising US recession risk premium. Fears of global de-dollarization become more and more of an issue as well. EUR/USD closed back above the 1.08 mark (1.0845). USD/JPY fell from 151.05 to 149.84.
Friday’s themes are at play this morning. Asian stock markets sink by up to 3-4% (Japan, Taiwan) with European and US futures pointing to steep losses. USD/JPY slides further below 149 with core bond futures gaining more traction. US President Trump said he’ll start his reciprocal tariffs with all countries (20% across the board?!) instead of a focus on the “dirty 15” which are responsible for the lion share of the US goods trade deficit as suggested earlier by Secretary of Treasury Bessent. Details on what specific sectors, calculations or (ways to get) exemptions are still unknown. Adding to the risk-off climate is an escalation in ceasefire talks between Russia and the US with Trump threatening secondary tariffs on buyers of Russian oil and more and more talk about plans to bypass the constitution prohibition on US presidents being elected three times. This week’s tariff narrative by far outweighs other eco figures like today’s EMU March CPI figures (expected to strengthen the case for a final April ECB rate cut) or key US eco data (ISM surveys, JOLTS job openings, ADP employment and payrolls).
News & Views
Both the Chinese manufacturing and non-manufacturing PMI rose gradually further above to 50 mark this month. The manufacturing index improved from 50.2 to 50.5, the best level in 12 months. The rise was supported by a further improvement in orders. However, employment remained in contraction territory (48.2). Price indicators suggest ongoing deflationary pressures (input prices 49.8, output prices 47.9). Medium and small enterprises showed an improvement in sentiment, which might be an indication of better domestic demand. Large enterprises turned more cautious. The non-manufacturing improved modestly as well, from 50.4 to 50.8. The rise suggests that (fiscal) stimulus is gradually supporting activity. A the same time, some of the improvement might be due to orders improving as demand has been frontloaded ahead of the implementation of US tariffs later this week.
Rating agency S&P on Friday affirmed the Czech Republic’s AA- credit rating with a stable outlook. According to S&P, the stable outlook reflects the view that Czechia's strong government and external balance sheets, including sizeable international reserves at the central bank, should cushion the effects of a more muted economic performance in the face of a more subdued European economic outlook, unclear trajectory of global trade disputes, and structural challenges facing Czechia's automotive manufacturing-centered economy. S&P assesses that economic recovery since the pandemic has been somewhat lackluster with GDP only exceeding 2019 levels by only 2.5%. 2025-2026 growth is seen as mainly being driven by domestic factors with average growth at about 2% still seen below potential growth of 2.5%. Still growth is expected to exceed the average of the EU. S&P also indicated that Czechia demonstrated the strongest fiscal consolidation within the CEE region with a government deficit below 3%. Net public debt also is expected to remain low at 31% of GDP, which the rating agency sees as proving room for spending on defense and nuclear power generation.