
Sample Category Title
USD/CAD Weekly Outlook
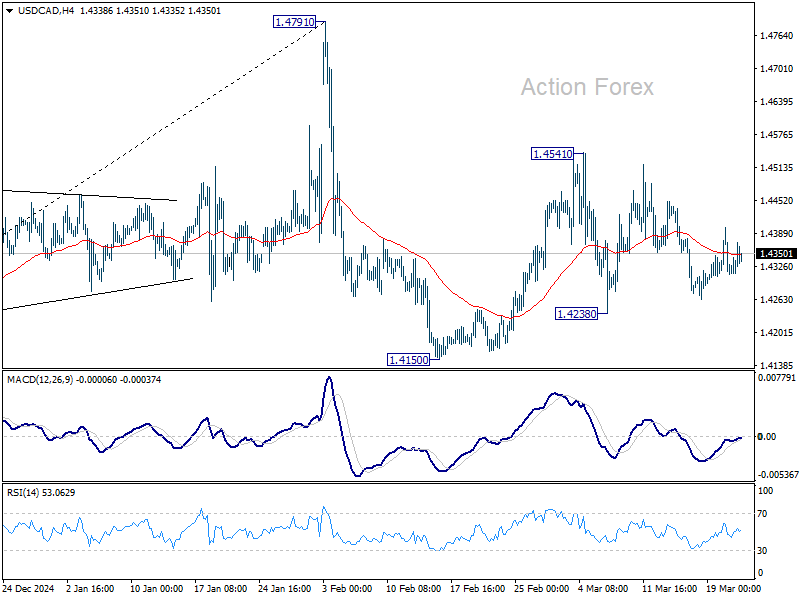
Range trading continued in USD/CAD last week and outlook is unchanged. Initial bias remains neutral this week first. Overall, price actions from 1.4791 are seen as a corrective pattern. On the upside, break of 1.4541 will extend the second leg from 1.4150 to retest 1.4791 high. On the downside, break of 1.4238 will argue that the third leg has already started through 1.4150 support.
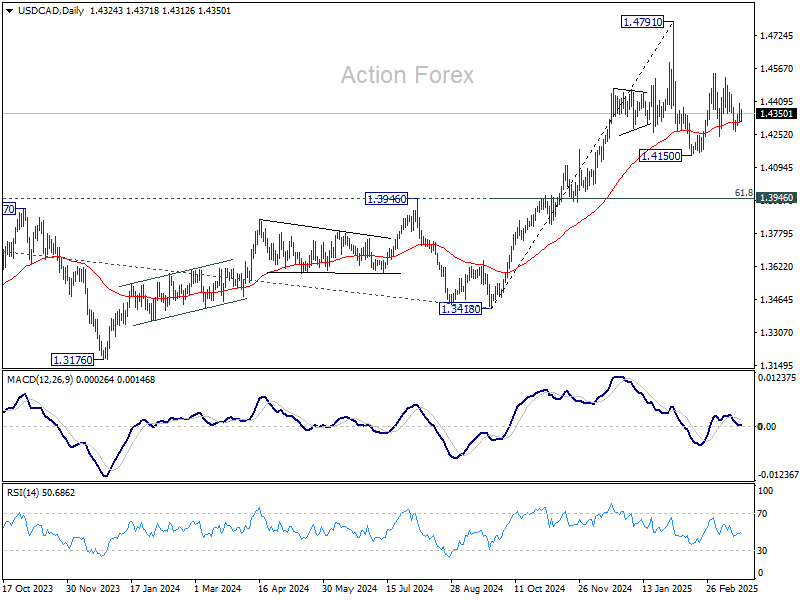
In the bigger picture, long term up trend is tentatively seen as resuming with prior breach of 1.4667/89 key resistance zone (2020/2015 highs). Next target is 100% projection of 1.2401 to 1.3976 from 1.3418 at 1.4993. This will remain the favored case as long as 1.3976 resistance turned support holds (2022 high), even in case of deep pullback.
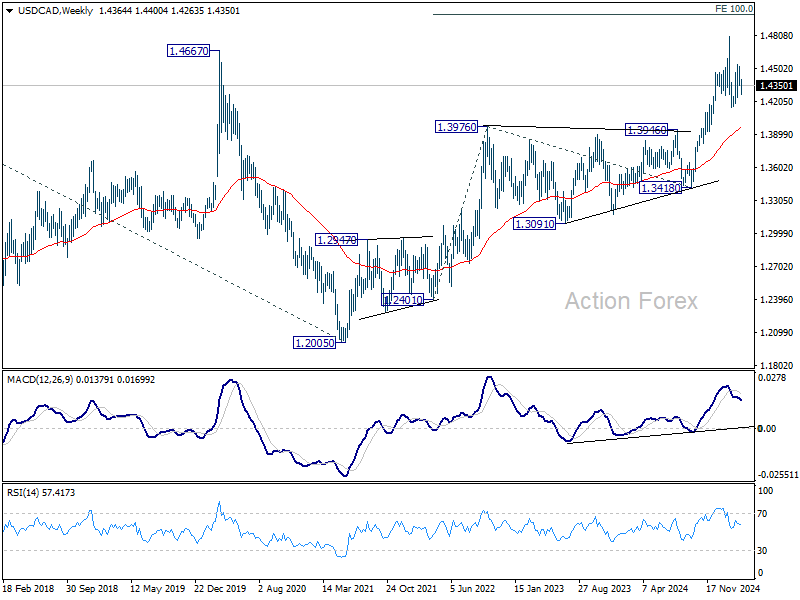
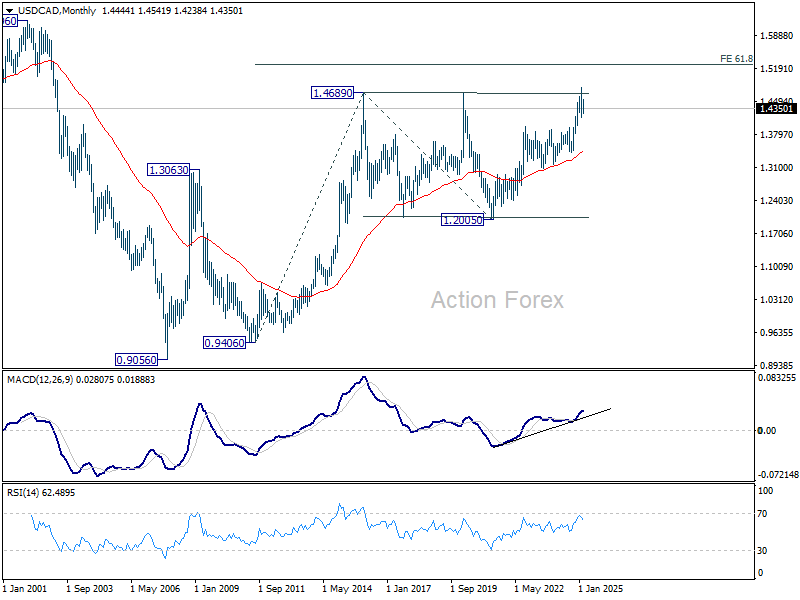
In the longer term picture, up trend from 0.9506 (2007 low) is in progress and possibly resuming. Next target is 61.8% projections of 0.9406 to 1.4689 from 1.2005 at 1.5270. While rejection by 1.4689 will delay the bullish case, further rally will remain in favor as long as 55 M EMA (1.3463) holds.
GBP/JPY Weekly Outlook
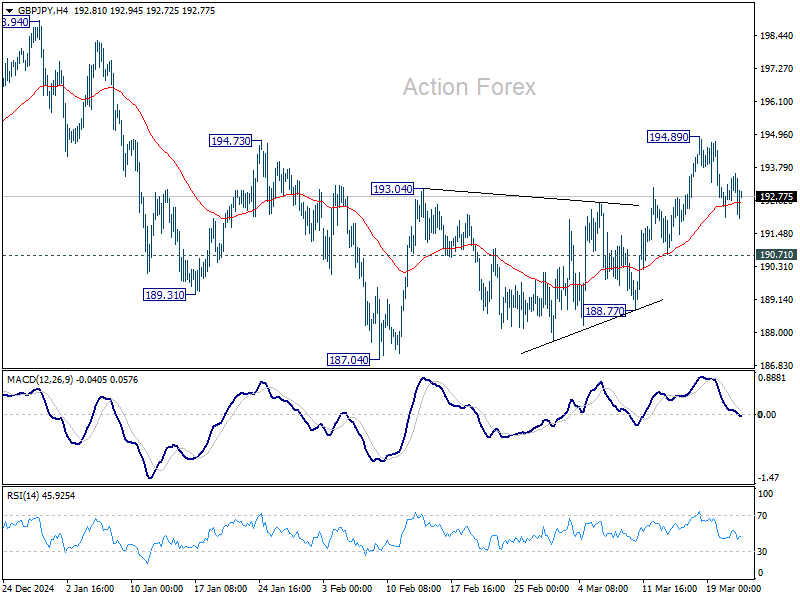
GBP/JPY edged higher to 194.89 last week but quickly retreated again. Initial bias stays neutral this week first. On the upside, above 194.89 will resume the rebound from 187.04 towards 198.94 resistance. On the downside, break of 190.71 will bring deeper fall back to 187.04 support. Overall, corrective pattern from 180.00 is still be extending.
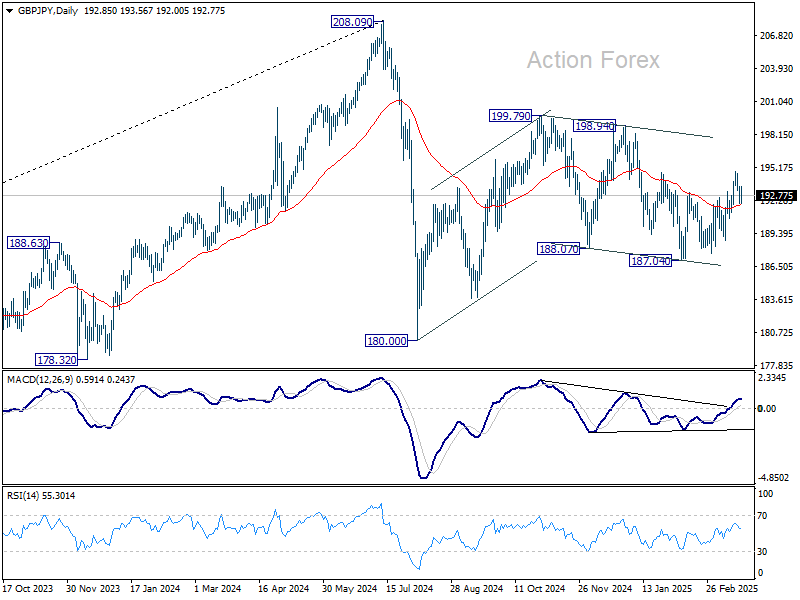
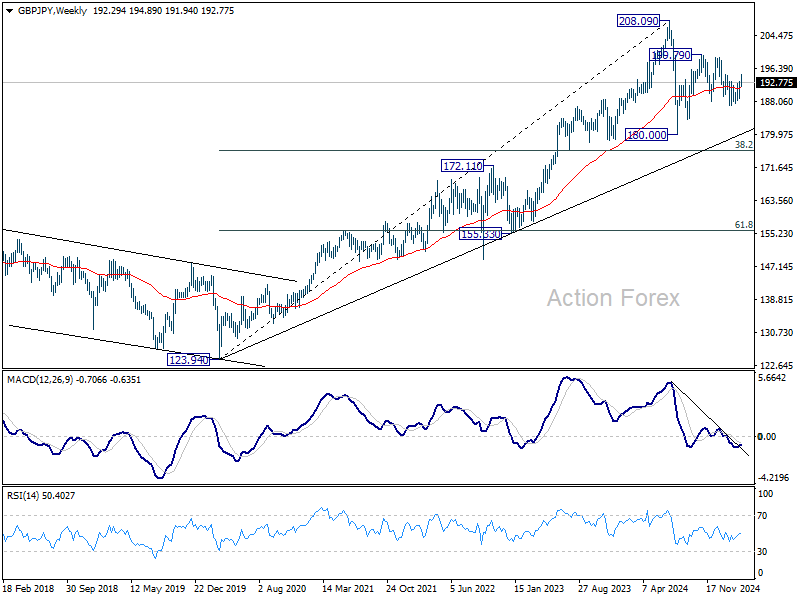
In the bigger picture, price actions from 208.09 are seen as a correction to rally from 123.94 (2020 low). Strong support should be seen from 38.2% retracement of 123.94 to 208.09 at 175.94 to contain downside. However, sustained break of 152.11 will bring deeper fall even still as a correction.
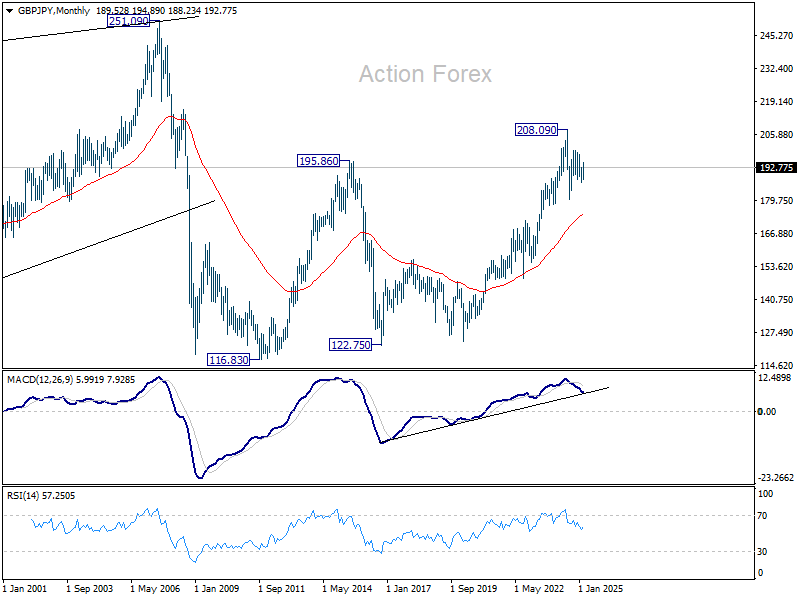
In the longer term picture, while a medium term top was formed at 208.09 (2024 high), it's still early to conclude that the up trend from 122.75 (2016 low) has completed. But GBP/JPY is at least in a medium term corrective phase, with risk of correction to 55 M EMA (now at 174.62).
EUR/JPY Weekly Outlook
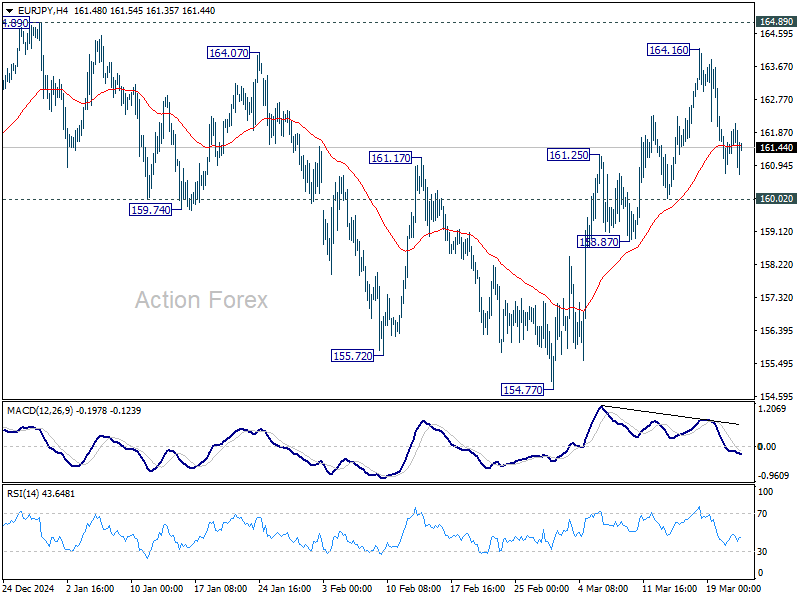
EUR/JPY edged higher to 164.16 last week but quickly retreated again. Initial bias stays neutral this week for consolidations. Further rally remains in favor as long as 160.02 support holds. Above 164.16 will target 164.89 and then 166.67. On the downside, however, break of 160.02 will argue that rise from 154.77 has completed and turn bias to the downside. Overall, sideway consolidation pattern from 154.40 is still extending.
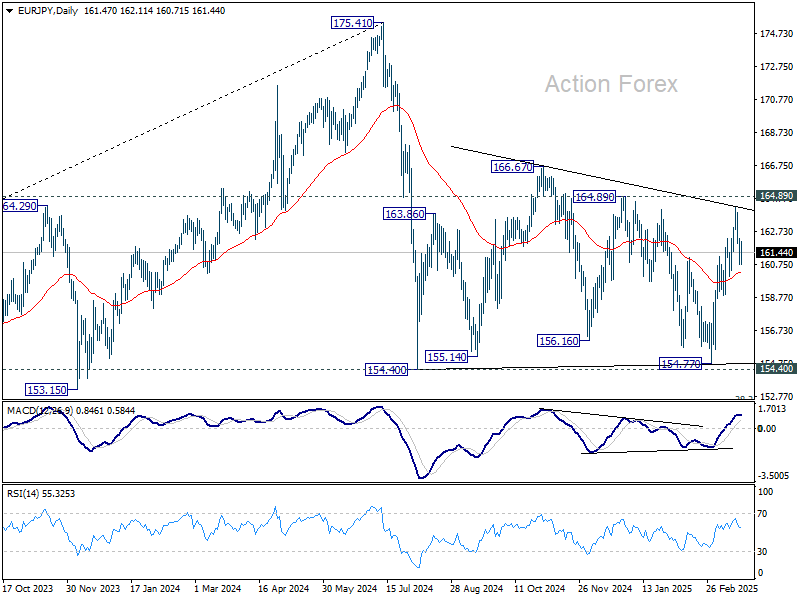
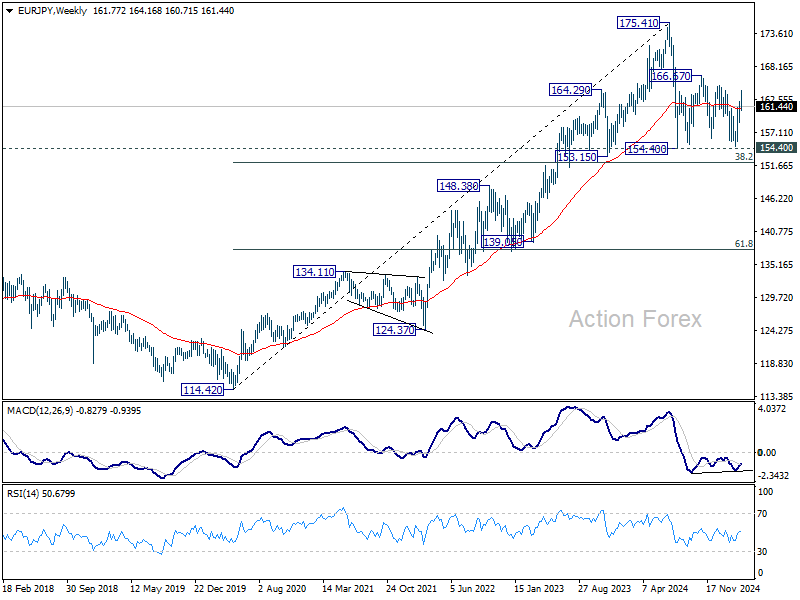
In the bigger picture, price actions from 175.41 are seen as correction to rally from 114.42 (2020 low). Strong support should be seen from 38.2% retracement of 114.42 to 175.41 at 152.11 to contain downside. However, sustained break of 152.11 will bring deeper fall even still as a correction.
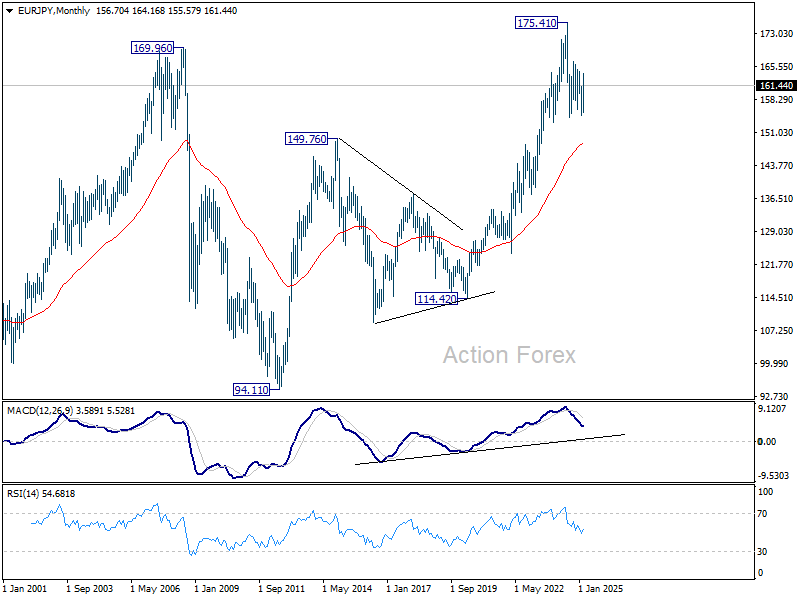
In the long term picture, while 175.41 is at least a medium term top, it's still early to conclude that up trend from 94.11 (2012 low) has completed. A medium term corrective phase is in progress with risk of deeper fall back to 55 M EMA (now at 148.45).
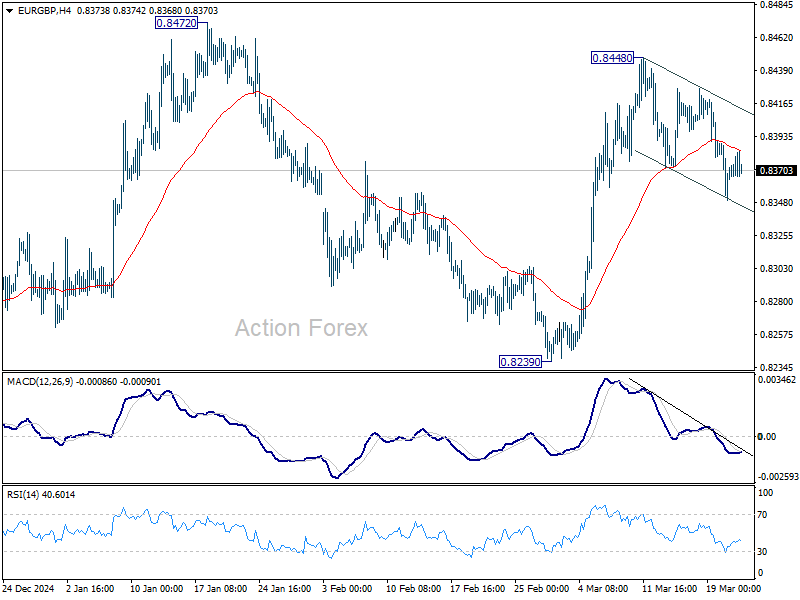
EUR/GBP Weekly Outlook
EUR/GBP dipped lower last week but lacked follow through momentum. Initial bias remains neutral this week first. On the upside. break of 0.8488 will resume the rise from 0.8239 through 0.8472 resistance to medium term falling channel resistance (now at 0.8495). However, sustained break of 55 D EMA (now at 0.8347) will suggest that rise from 0.8239 has completed and turn bias back to the downside instead.
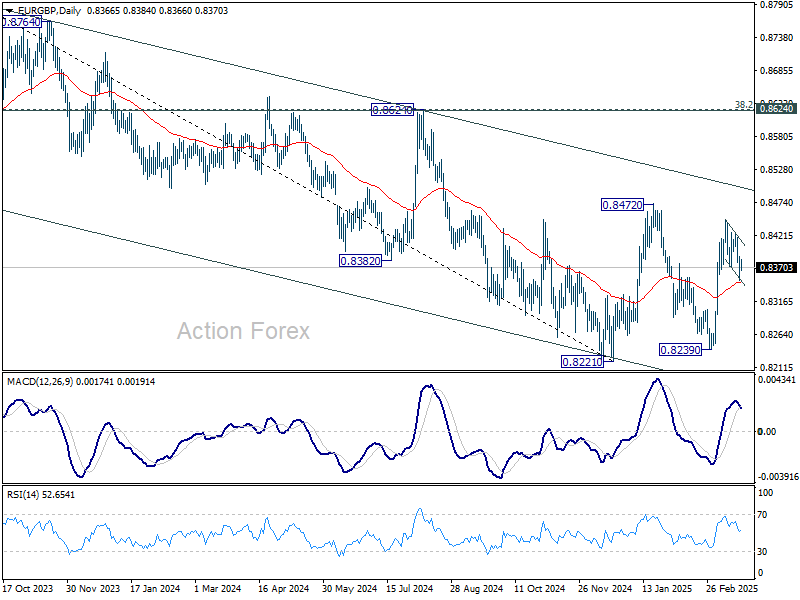
In the bigger picture, EUR/GBP is still bounded inside medium term falling channel. While rebound from 0.8221 might extend higher, it could still develop into a corrective pattern. Overall outlook will be neutral at best and down trend from 0.9267 (2022 high) could extend, at least until decisive break of channel resistance (now at 0.8495).
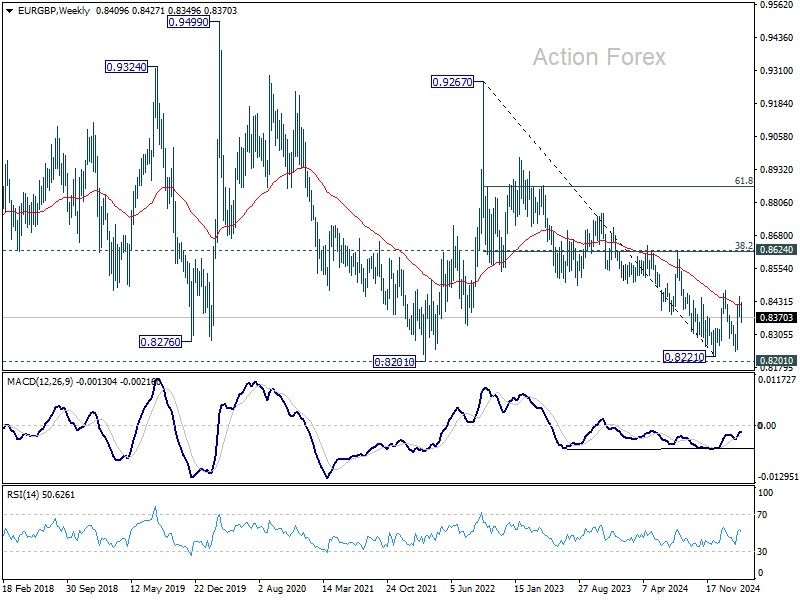
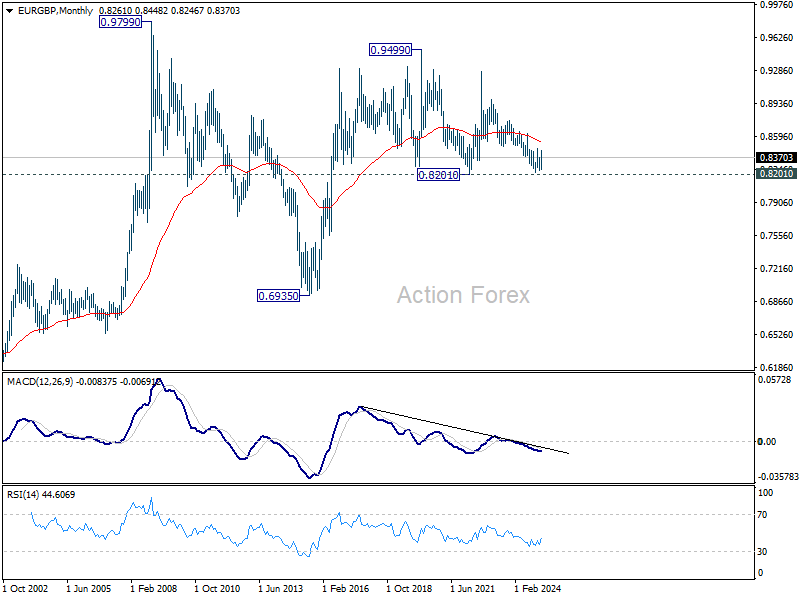
In the long term picture, price action from 0.9499 (2020 high) is seen as part of the long term range pattern from 0.9799 (2008 high). Range trading should continue between 0.8201 and 0.9499, until there is clear signal of imminent breakout.
EUR/AUD Weekly Outlook
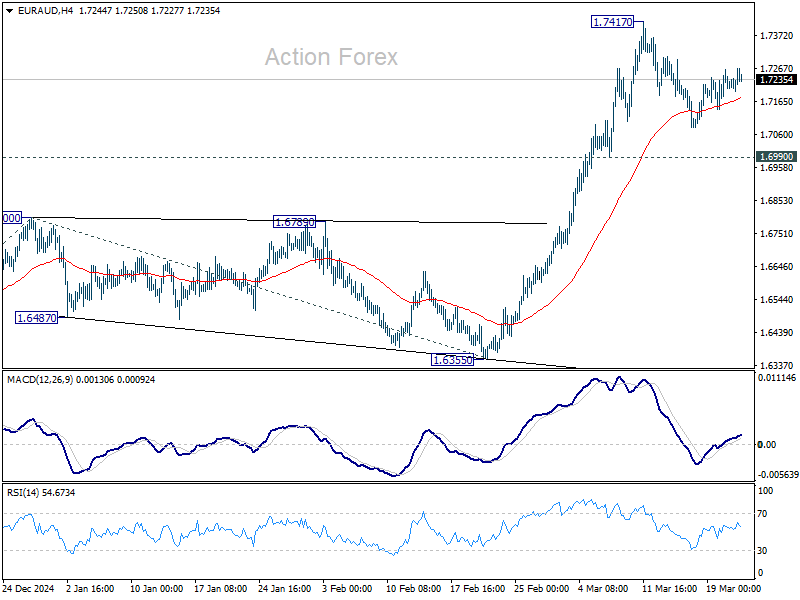
EUR/AUD stayed in consolidation below 1.7417 last week and outlook is unchanged. Initial bias remains neutral first. Downside of retreat should be contained by 0.6990 support to bring rebound. On the upside, break of 1.7417 will resume rise from 1.6335 to 161.8% projection of 1.5963 to 1.6800 from 1.6355 at 1.7709 next.
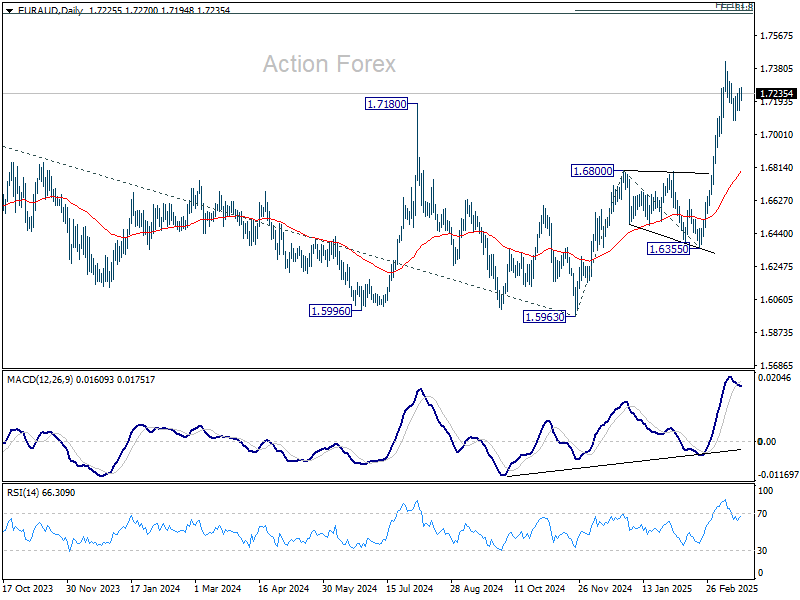
In the bigger picture, the breach of 1.7180 key resistance (2024 high) suggests that up trend from 1.4281 (2022 low) is resuming. Sustained trading above 1.7180 will confirm and target 61.8% projection of 1.4281 to 1.7062 from 1.5963 at 1.7682, which is also close to 61.8% retracement of 1.9799 (2020 high) to 1.4281 at 1.7691. For now, this will remain the favored case as long as 1.6800 resistance turned support holds, even in case of deep pullback.
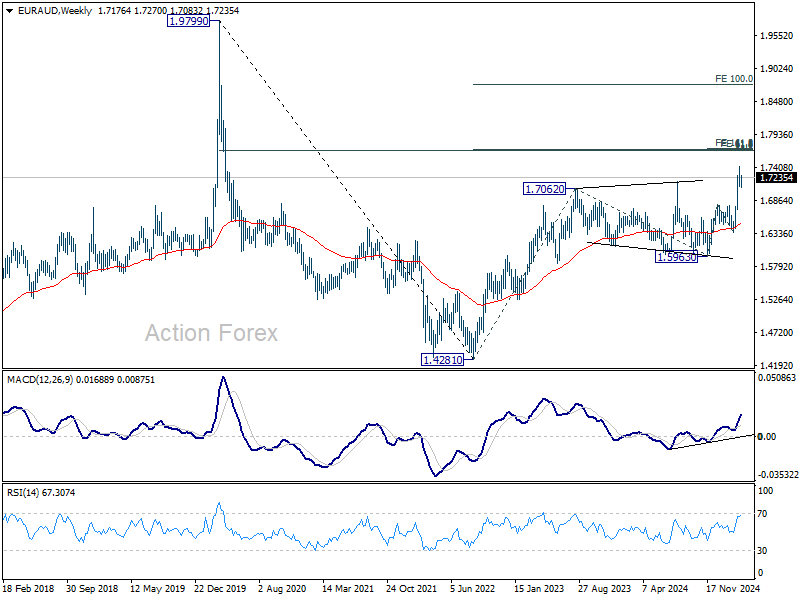
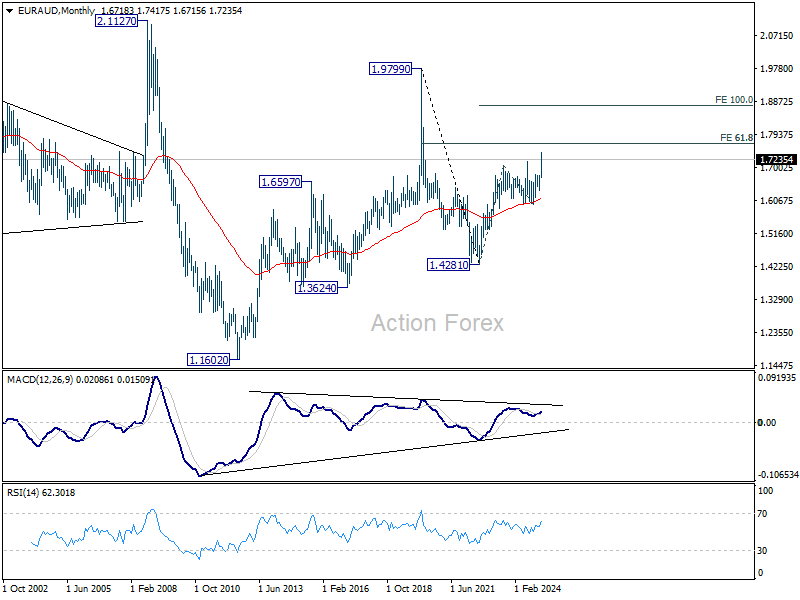
In the longer term picture, rise from 1.4281 is seen as the second leg of the pattern from 1.9799 (2020 high), which is part of the pattern from 2.1127 (2008 high). As long as 55 M EMA (now at 1.6099) holds, this second leg could still extend higher. However, sustained trading below 55 M EMA will open up the bearish case for extending the decline through 1.4281 low.
EUR/CHF Weekly Outlook
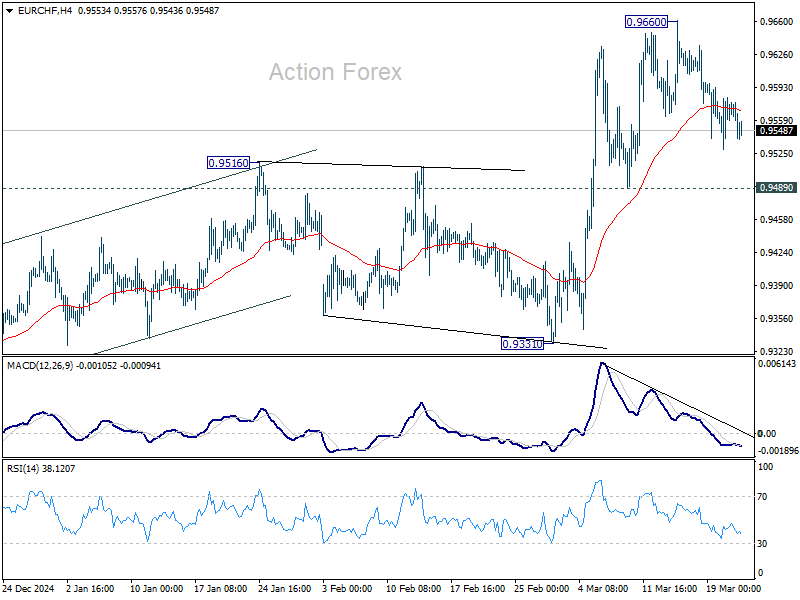
EUR/CHF continued to struggle below long term falling channel resistance last week. Initial bias stays neutral this week for more consolidation below 0.9660. But after all, further rally is expected as long as 0.9489 support holds. Break of 0.9660 will resume whole rise from 0.9204.
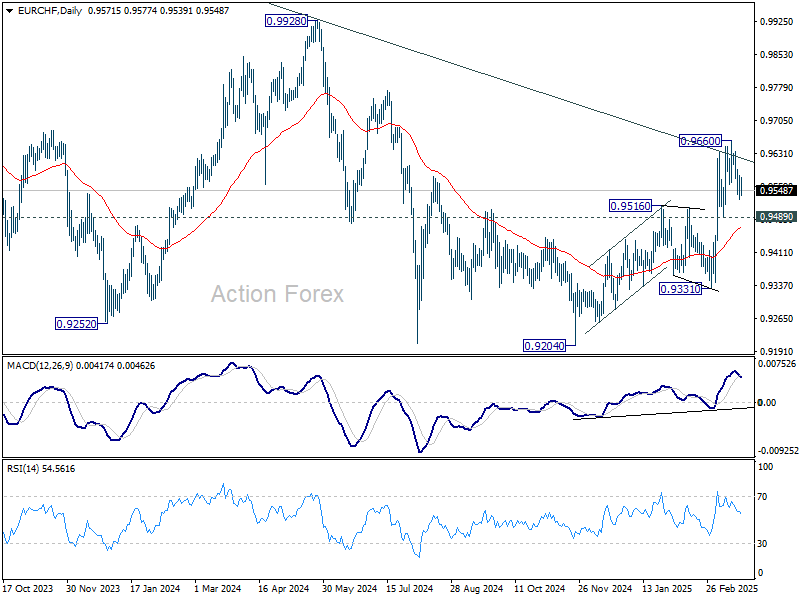
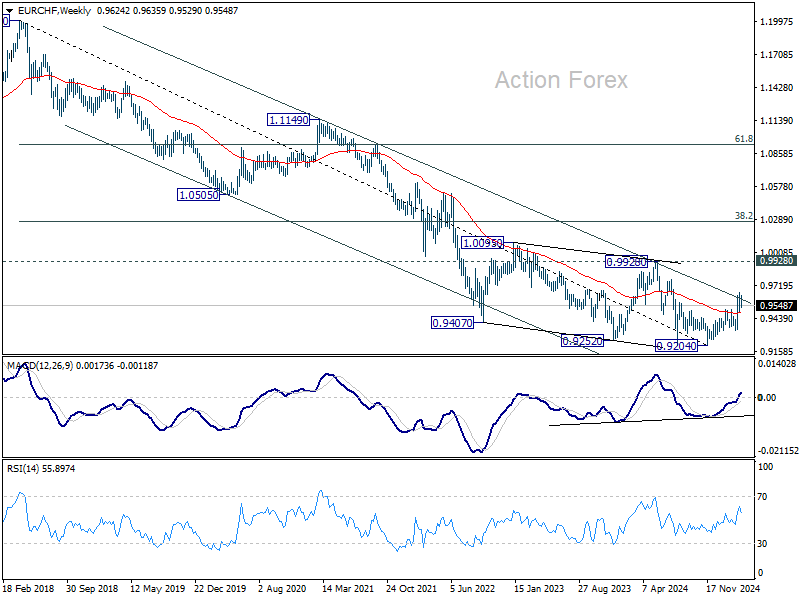
In the bigger picture, prior strong break of 55 W EMA (now at 0.9487) is a medium term bullish sign. Sustained break trading above long-term falling channel resistance (at around 0.9618) would suggest that the downtrend from 1.2004 (2018 high) has bottomed at 0.9204. Stronger rally should then be seen to 0.9928 key resistance at least.
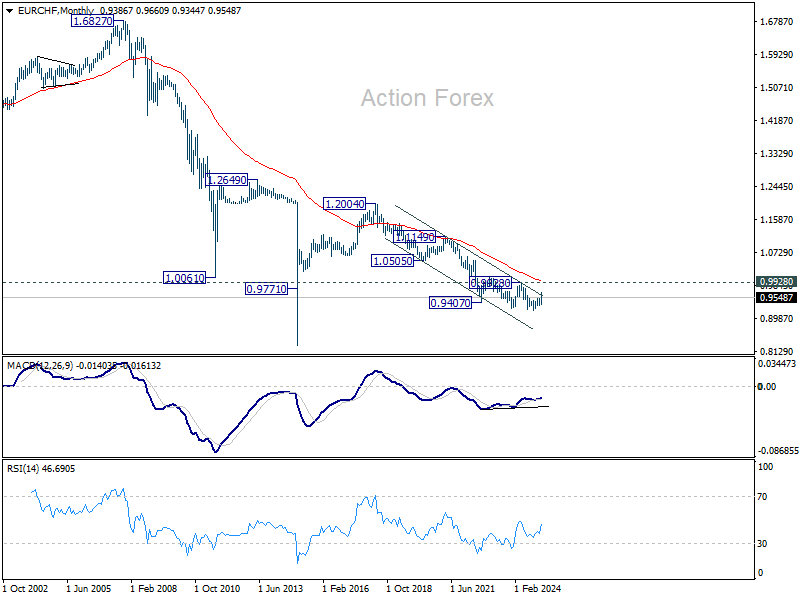
In the long term picture, bullish signs are emerging. However, the important hurdle at 0.9928 resistance, which is close to 55 M EMA (now at 0.9960), is needed to be taken out decisively before considering long term trend reversal. Otherwise, outlook is neutral at best.
Markets Weekly Outlook – US Dollar, Inflation & PMI Data Analysis
- Risk Assets continue to struggle despite some gains in the S&P 500 and Dow Jones. It highlights investor concerns about US trade policies and the Federal Reserve's stance on inflation.
- On the economic data front, we have PMI and inflation figures in the US, Europe, UK, and Asia Pacific. We also key events like Japan's CPI, China's lending rate, and the UK's spring statement.
- The US Dollar's recent rally and its break above a key resistance level are discussed. What next for the US Dollar?
Week in Review: Markets in Flux as Federal Reserve and the BoE Keep Rates on Hold
Markets have struggled once more this week as an attempt at a rebound in risk assets was met with selling pressure. The S&P 500 and the Dow Jones are both on course to end the week in the green but selling pressure remains in play.
Investors withdrew a large amount of money from global equity funds in the week leading up to March 19, due to ongoing concerns about the impact of U.S. President Donald Trump's tough trade policies on the global economy.
There was a tiny bit of optimism post the FOMC meeting, however this faded rather quickly with sellers returning en masse.
According to LSEG Lipper data, they sold a net $29.7 billion worth of global equity funds during the week, marking the biggest weekly outflow since December 18.
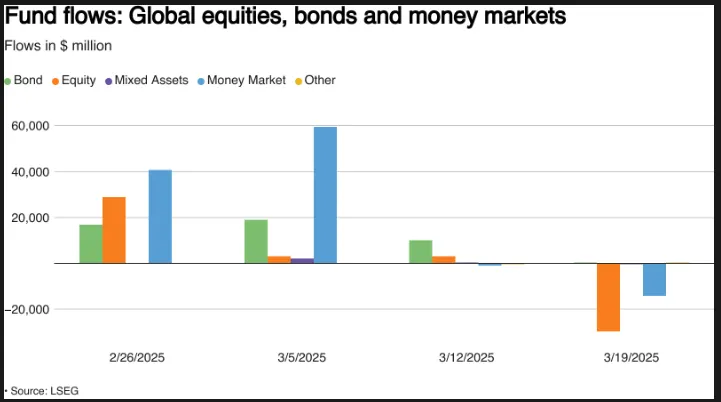
Sources: LSEG Datastream
The FOMC meeting this week saw the return of a phrase many market participants have come to ridicule, and that is ‘transitory’. This was the answer by Fed Chair Jerome Powell when quizzed on the potential of tariffs to lead to increased inflationary pressure.
This will be a key consideration as to how markets may perform this year as it will likely determine the amount of rate cuts the Central Bank is able to deliver. Looking at the Feds updated projections and it does not paint an attractive picture.
On the FX front, the US Dollar has finally rallied, breaking above a key level at 104.00. The recovery in the USD has led to declines in EUR/USD and GBP/USD. The Yen was unable to maintain its recent gains thanks to the stronger Dollar, however USD/JPY is only up around 0.23% for the week.
Gold continued its rise this week, with a fresh YTD high around the $3050/oz mark. Friday did see a slight pullback which could be down to the stronger US Dollar and potential profit taking.
Oil prices continued to rebound this week but remain confined within a tight range. Thursday looked to have set the stage for further gains after new sanctions on Iran. Friday however saw Oil falter on a stronger US Dollar after running into a key resistance level.
The Week Ahead: PMI and Inflation Data in Focus
Asia Pacific Markets
The main focus this week in the Asia Pacific region will be inflation data from Japan and the medium term lending rate from China.
Japan's Tokyo CPI and manufacturing PMI are in focus this week. On Monday, flash PMI data will be out, followed by Tokyo's CPI on Thursday. Tokyo's prices may drop slightly due to energy subsidies and stable fresh food costs, but core prices (excluding fresh food and energy) are expected to stay at 1.9%. For PMIs, services might improve due to strong wage growth, while manufacturing could decline because of US tariffs.
China is set to update its medium-term lending facility rate on Monday, with the one-year rate expected to stay at 2.0%. On Thursday, we’ll get the first industrial profits data for 2025. The key focus will be whether profits can grow again, despite tough comparisons to last year’s numbers.
Europe + UK + US
In developed markets, the US, Europe and UK will all release PMI data which markets will be keeping a close watch on given concerns about global growth. We also have the Feds preferred inflation gauge due on Friday as markets get a look at February's PCE numbers.
In the UK markets will be paying attention to the spring statement by Chancellor Rachel Reeves set for March 26. The focus will be on addressing rising debt interest costs and tight public finances. Chancellor Rachel Reeves is expected to announce spending cuts, particularly in welfare and departmental budgets, to recover the £10bn fiscal headroom lost due to higher borrowing costs. However, these cuts may only provide temporary relief, as further tax hikes are likely in the autumn.
The government is hoping that economic reforms, like changes to planning rules and closer ties with the EU, will help boost growth. However, these changes are unlikely to show quick results. With few choices left, the Treasury has tough decisions ahead, as it tries to balance spending cuts with political and economic challenges.
The U.S. will release consumer sentiment and spending data. Confidence has been dropping as people worry about job and benefit cuts from government spending reductions. Concerns over tariffs raising prices and falling stock markets are also fueling fears about the economy.
Fed Chair Powell has downplayed weak sentiment, noting it hasn’t been a reliable indicator of spending growth. February’s personal spending data will be key after January showed declines. A rebound is expected (+0.7% nominal, +0.4% volume), but overall spending may weaken further, potentially paving the way for a potential Federal Reserve rate cut in September.
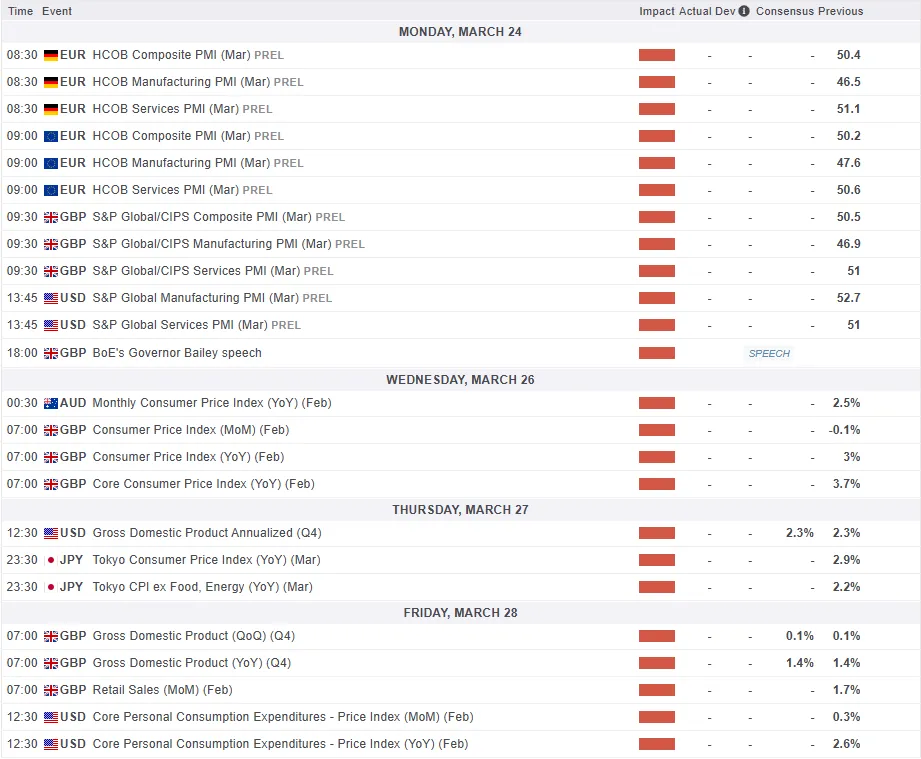
Chart of the Week - US Dollar Index (DXY)
This week's focus is back on the US Dollar Index as it looks to consolidate recent gains and push on.
The DXY has pushed above the key resistance level at 104.00 with a weekly candle close above likely to embolden bulls.
The 14-period RSI has finally left oversold territory hinting at a shift in momentum as well.
Immediate resistance rests some distance away at the psychological 105.00 which is also where the 200-day MA currently rests. This highlights how important that 105.00 handle may prove to be when the DXY makes its way to the level.
A break above 105.00 brings resistance at 105.63 and 106.13 into focus.
Support meanwhile rests at 103.65 and 103.17 respectively.
US Dollar Index (DXY) Daily Chart - March 21, 2025
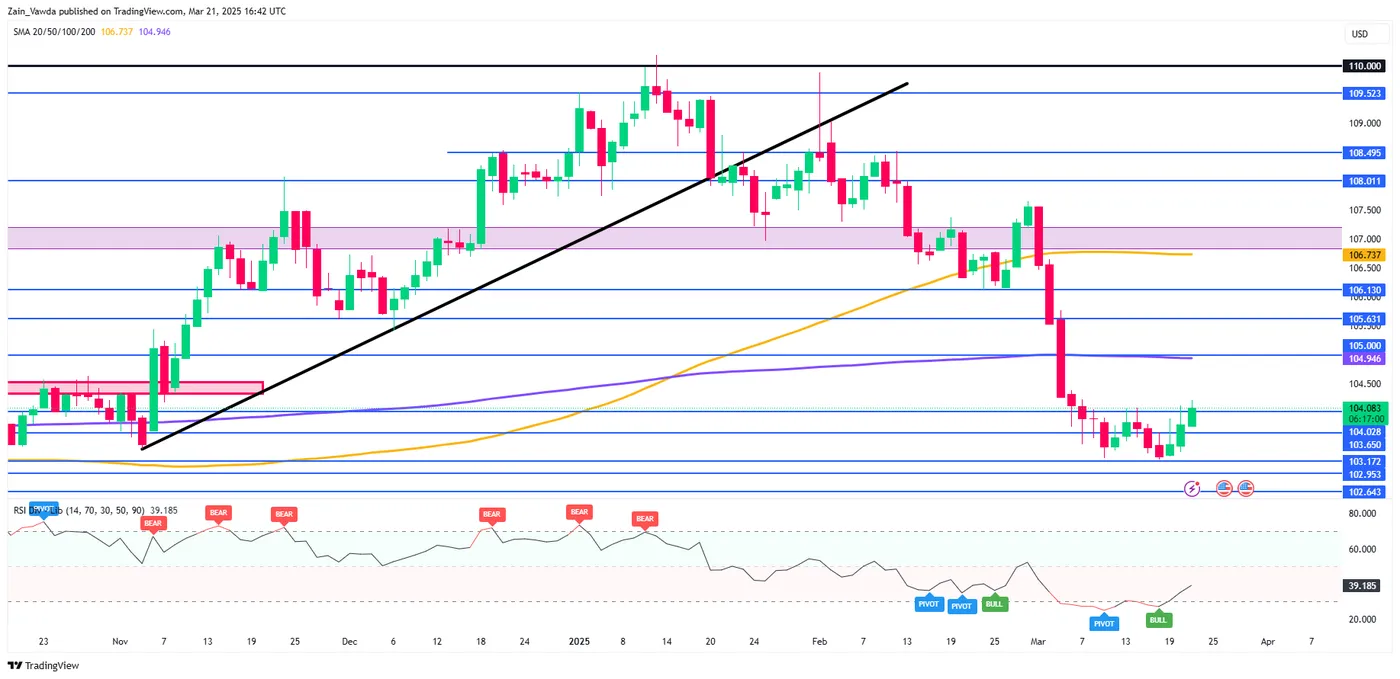
Source:TradingView.Com (click to enlarge)
Key Levels to Consider:
Support
- 103.65
- 103.17
- 102.64
Resistance
- 105.00
- 105.63
- 106.13
The Weekly Bottom Line: Uncertainty Clouding the Outlook
Canadian Highlights
- Canadian economic data are giving a glimpse of what could be in store for the rest of 2025, with weak consumer activity and higher inflation at the forefront.
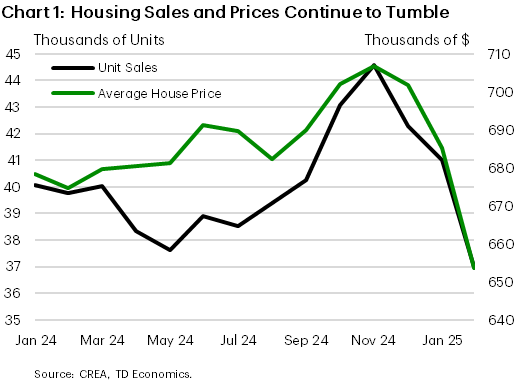
- Housing sales dropped by the largest amount since the Bank of Canada (BoC) started its aggressive rate hiking cycle in 2022. Retail sales also plunged as consumers pulled back on auto purchases.
- Inflation reared its ugly head again, as the end of the GST/HST holiday lifted headline CPI above the BoC’s 2% target.
U.S. Highlights
- The FOMC held the policy rate steady at a target range of 4.25%-4.5% for the second consecutive meeting. But, committed to slowing the pace of balance sheet runoff of its U.S. Treasury holdings.
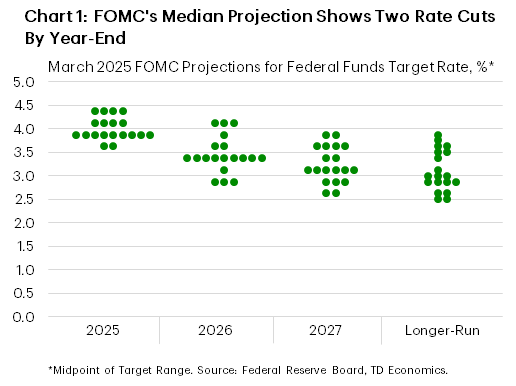
- Revised economic projections showed a small downgrade to the FOMC’s growth outlook, but a near-term upgrade to inflation. The median forecast still expects 50bps of rate cuts by year-end.
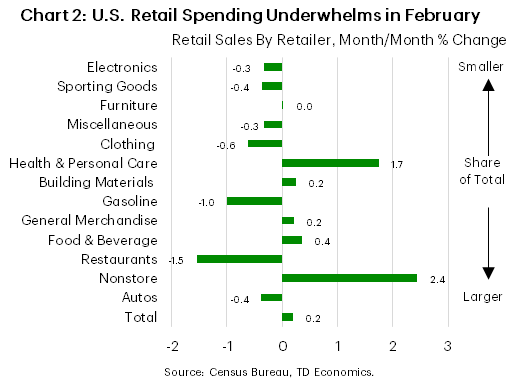
- February data out this week were mixed. Retail sales underwhelmed, while housing data rebounded from January’s weather induced slide.
Canada – Inflation Gets Hot While Real Estate Cools
Canadian economic data are giving a glimpse of what could be instore for the rest of 2025. The housing market has cooled dramatically as buyers moved to the sidelines amidst heightened uncertainty. Weak retail sales numbers have followed suit. At the same time, inflation surged higher, and it’s not just the end of the GST/HST holiday. Financial market volatility remains at the forefront, with equities struggling to bounce off the floor, and bond markets meekly pulling forward the re-start of Fed rate cuts.
This week’s real estate reports were the first hard data points (not sentiment) that reflect the impact of Trump tariffs on consumer behaviour. Existing home sales dropped a whopping 10% month-on-month (m/m) in February (Chart 1). That is the largest decline since the BoC started its rapid rate hiking cycle in the spring of 2022. There were winter storms that may have had an impact, but the decline was clear across the country (not just where storms hit). And this is with the Bank of Canada (BoC) continuing to cut its policy rate and employment/wage growth unabated. From our view, this reflects growing uncertainty amongst buyers, who logically may want to hold off on any big financial commitments. Builders got the signal and they too pulled back on housing starts for condos and single-family homes. Retail sales numbers for January also reflected hesitancy, falling 1.1% m/m in volume terms. It is still early days, but the impact of trade tariffs appears to be quickly permeating through consumer demand.
Trade tariffs will also have an impact on consumer prices. For much of the last few months, inflation was stable, even reaching below the BoC’s 2% target. Part of this was the government’s sales tax holiday, which artificially pulled down inflation. This holiday ended in mid-February and lifted February’s CPI inflation reading to 2.6% year-on-year, from 1.9% y/y in January (Chart 2). We think inflation will continue to rise in March, reflecting a full month of consumers paying taxes when they buy wine at the liquor store and eat at restaurants. Is higher inflation a sign of things to come for Canadians?
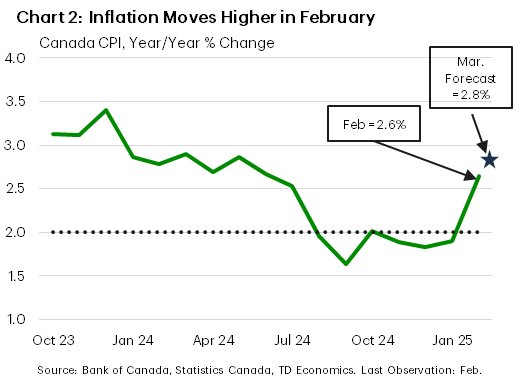
There will be a lot of moving parts in the inflation readings through spring. Tariffs are already in place for steel and aluminum, lifting the cost for intermediate goods on the margin over the coming months (beer cans for example). If more tariffs come into effect in early April alongside the increase of Canada’s retaliatory tariffs on $185 billion of U.S. goods, a host of consumer items will see significant price increases (cars/home appliances/etc). In the trade war of 2018, CPI rose by around half a percentage point (ppt) when Canada retaliated against U.S. tariffs on steel and aluminum. A bigger trade war this time around would have over a 1 ppt impact on Canadian CPI. Luckily, the cancellation of the consumer carbon tax will provide an offset. Gasoline prices should drop by about 20 cents on April 1st (not an April fool’s day joke). Other energy product prices will also come down, which would actually keep inflation stable in April even if Trump follows through on tariffs. But that would only be a reprieve should this full-blown trade war take hold. Please take a look at our Quarterly Economic Forecast published this week.
U.S. – Uncertainty Clouding the Outlook
With no new tariff announcements, trade tensions were temporarily moved to the backburner this week, allowing investors to shift the focus to the economic data calendar. February data readings out this week were mixed. Retail sales underwhelmed expectations, but both housing starts, and existing home sales largely recovered from January’s weather induced slide. Meanwhile, the Federal Reserve held the policy rate steady at a target range of 4.25%-4.5% but signaled an intention to slow the pace of balance sheet runoff for U.S. Treasury holdings starting in April. While investors were braced for a more downbeat messaging on the outlook, the Fed’s statement and Chair Powell’s press conference struck a more balanced tone. This helped to temporarily soothe unnerved financial markets, but growth fears reemerged by late-week, fueling a further sell-off. At time of writing, the S&P 500 was down 0.5%, while term yields traded lower by about 10bps, with the 10-year Treasury currently sitting at 4.22%.
The Fed’s statement included updated economic projections from FOMC members. The median GDP forecast was revised lower over the forecast, with a below-trend pace of economic growth expected in 2025 (1.7% from 2.1%), before steadying at 1.8% in 2026 (previously 2.0%) and 2027 (previously 1.9%). The unemployment rate was nudged higher by a tick this year to 4.4% but remained unchanged at 4.3% in 2026 and 2027. Core PCE inflation was also revised higher for 2025 (2.8% from 2.5%), which Chair Powell largely attributed to tariff impacts. Importantly, the revised “dot plot” still showed two 25bps rate cuts for this year. But a closer inspection of the dots shows that committee members see the balance of risks skewed towards fewer cuts, as eight officials now expect one or no cuts this year (up from four in December) (Chart 1).
During the press conference, Chair Powell characterized the economy as “strong”, but emphasized that any point forecasts remain “highly uncertain” in light of recent policy changes under the new administration. When asked about the recent pullback in business and consumer sentiment measures, Powell reiterated that the “hard data” are still showing an economy that is “solid”. He also downplayed the recent jump in inflation expectations shown in the University of Michigan survey, characterizing it as an outlier relative to most other measures.
But this week’s retail sales data suggests otherwise. Retail sales rose by just 0.2% m/m in February, after declining 1.2% in January. Only 5 of the 13 major categories (Chart 2) saw gains last month while revisions to January showed an even weaker pace of retail spending than previously reported. Moreover, spending at bars & restaurants – the only services-based metric included in the retail report – plunged by 1.5% or the largest monthly pullback in two-years. This bears close watching, as discretionary services spending has been a key driver underpinning the strength of the consumer in past years.
For now, the Fed appears comfortable to sit tight and wait for more clarity on both the policy and data front. This will not come from any one policy announcement or data reading, suggesting policymakers will remain on the sidelines for at least another few months before making their next move.
Canada’s January GDP Likely Expanded Ahead of Intensifying Trade Risks
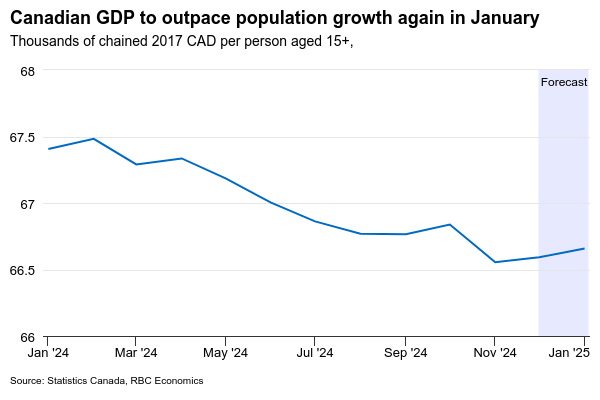
U.S. tariff risks continue to cloud the outlook for Canada, but January’s gross domestic product report should show further signs of life in an economy that broadly underperformed global peers in the previous two years.
We expect GDP increased 0.2% from December—adding to the 0.2% increase in December and slightly lower than Statistics Canada’s preliminary estimate a month ago.
Output in the transportation sector likely bounced back after the end of the labour disruptions in postal service and ports that weighed on output in earlier months. Non-conventional oil production in Alberta posted another solid 4% gain in January (by our count), following a 2% increase last month, and drilling activity picked up after declining in November and December. Wholesale sale volumes also posted an 0.8% increase.
Outside of these sectors, we expect the report will be more mixed. Retail sale volumes declined by 1.1% in January and home resales declined by 3.3%, building on a 5% drop in the prior month. We also expect manufacturing output will be little changed following declines in the previous two months. Still, the increase in overall GDP we expect would outpace population growth for a second consecutive month, and comes alongside employment growth and a lower unemployment rate in 2025.
Moving forward, these more positive but, ultimately, backward-looking data releases will continue to be overshadowed by intensifying international trade risks. By our count, the effective U.S. tariff rate on imports from Canada has increased by about 2-2 ½ percentage points (provided Canadian exporters are largely able to comply with CUSMA/USMCA rules.) But details of another round of planned U.S. tariffs in April still vague. We continue to expect the implementation of tariffs and the threat of more to come will weigh on consumer and business confidence and spending in the months ahead.
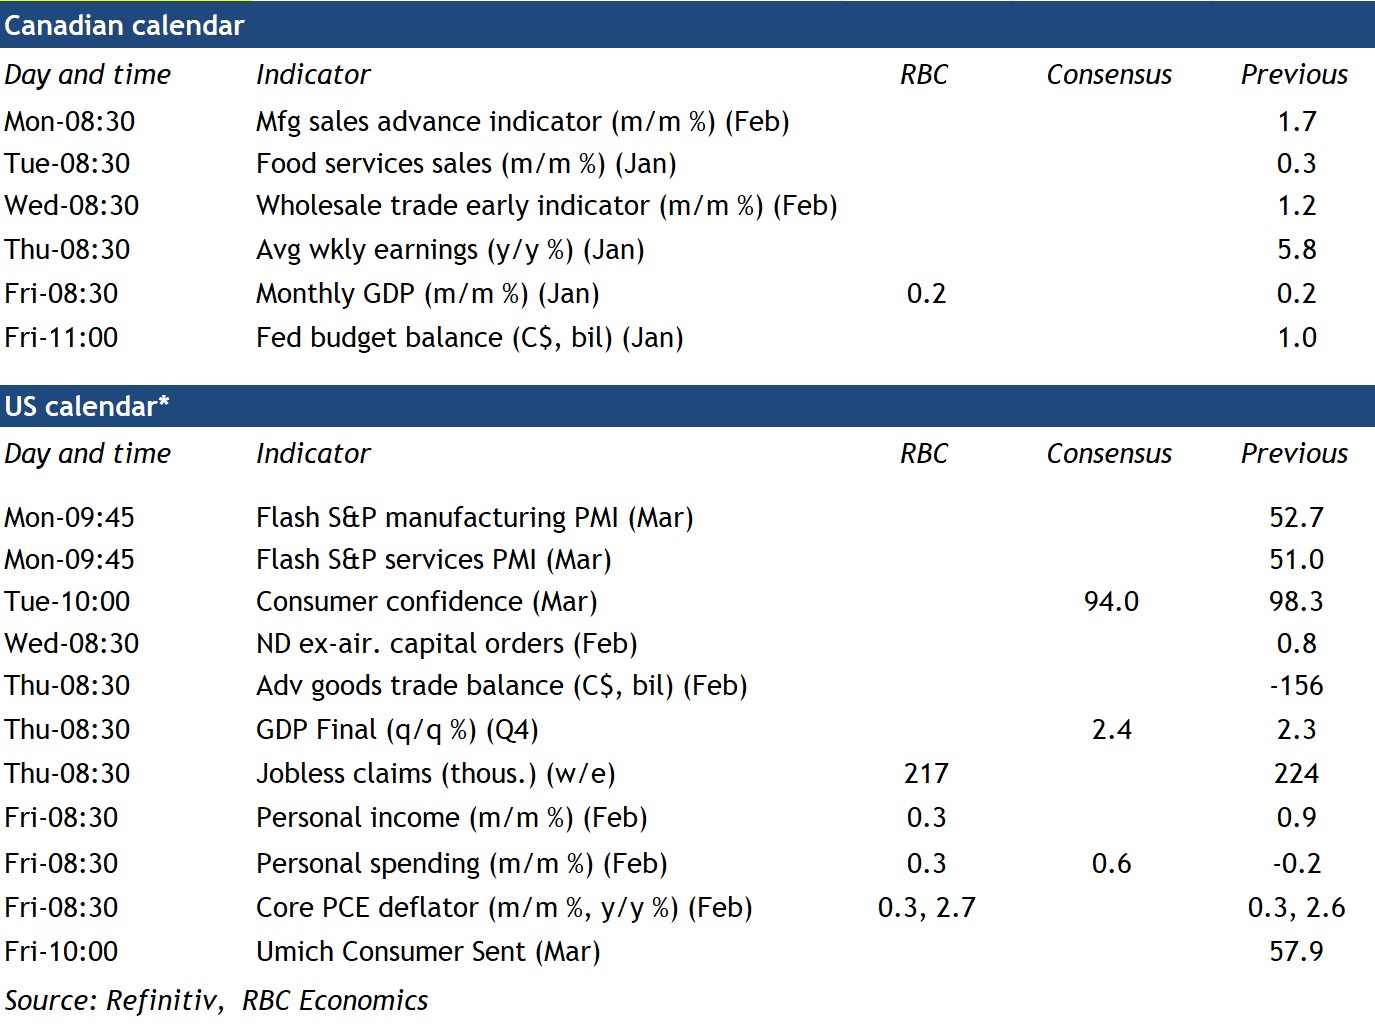
Week ahead data watch
- Job openings from the Survey of Employment, Payrolls and Hours have been declining, and we will continue to watch those closely next Thursday.
- We expect U.S. personal spending edged higher in February, consistent with an earlier reported increase in retail sales. We expect the core PCE deflator (the U.S. Federal Reserve’s preferred inflation gauge) edged up 0.3% from January and 2.7% from a year ago.
Summary 3/24 – 3/28
Monday, Mar 24, 2025
| GMT | Ccy | Events | Consensus | Previous |
|---|---|---|---|---|
| 22:00 | AUD | Manufacturing PMI Mar P | 50.4 | |
| 22:00 | AUD | Services PMI Mar P | 50.8 | |
| 00:30 | JPY | Manufacturing PMI Mar P | 49.2 | 49 |
| 00:30 | JPY | Services PMI Mar P | 53.7 | |
| 08:15 | EUR | France Manufacturing PMI Mar P | 46.2 | 45.8 |
| 08:15 | EUR | France Services PMI Mar P | 46.3 | 45.3 |
| 08:30 | EUR | Germany Manufacturing PMI Mar P | 47.7 | 46.5 |
| 08:30 | EUR | Germany Services PMI Mar P | 52.3 | 51.1 |
| 09:00 | EUR | Eurozone Manufacturing PMI Mar P | 48.3 | 47.6 |
| 09:00 | EUR | Eurozone Services PMI Mar P | 51.2 | 50.6 |
| 09:30 | GBP | Manufacturing PMI Mar P | 47.3 | 46.9 |
| 09:30 | GBP | Services PMI Mar P | 51.2 | 51 |
| 13:45 | USD | Manufacturing PMI Mar P | 51.9 | 52.7 |
| 13:45 | USD | Services PMI Mar P | 51.2 | 51 |
| 23:50 | JPY | BoJ Minutes |
| GMT | Ccy | Events | |
|---|---|---|---|
| 22:00 | AUD | Manufacturing PMI Mar P | |
| Forecast: | Previous: 50.4 | ||
| 22:00 | AUD | Services PMI Mar P | |
| Forecast: | Previous: 50.8 | ||
| 00:30 | JPY | Manufacturing PMI Mar P | |
| Forecast: 49.2 | Previous: 49 | ||
| 00:30 | JPY | Services PMI Mar P | |
| Forecast: | Previous: 53.7 | ||
| 08:15 | EUR | France Manufacturing PMI Mar P | |
| Forecast: 46.2 | Previous: 45.8 | ||
| 08:15 | EUR | France Services PMI Mar P | |
| Forecast: 46.3 | Previous: 45.3 | ||
| 08:30 | EUR | Germany Manufacturing PMI Mar P | |
| Forecast: 47.7 | Previous: 46.5 | ||
| 08:30 | EUR | Germany Services PMI Mar P | |
| Forecast: 52.3 | Previous: 51.1 | ||
| 09:00 | EUR | Eurozone Manufacturing PMI Mar P | |
| Forecast: 48.3 | Previous: 47.6 | ||
| 09:00 | EUR | Eurozone Services PMI Mar P | |
| Forecast: 51.2 | Previous: 50.6 | ||
| 09:30 | GBP | Manufacturing PMI Mar P | |
| Forecast: 47.3 | Previous: 46.9 | ||
| 09:30 | GBP | Services PMI Mar P | |
| Forecast: 51.2 | Previous: 51 | ||
| 13:45 | USD | Manufacturing PMI Mar P | |
| Forecast: 51.9 | Previous: 52.7 | ||
| 13:45 | USD | Services PMI Mar P | |
| Forecast: 51.2 | Previous: 51 | ||
| 23:50 | JPY | BoJ Minutes | |
| Forecast: | Previous: | ||
Tuesday, Mar 25, 2025
| GMT | Ccy | Events | Consensus | Previous |
|---|---|---|---|---|
| 09:00 | EUR | Germany IFO Business Climate Mar | 87 | 85.2 |
| 09:00 | EUR | Germany IFO Current Assessment Mar | 85 | |
| 09:00 | EUR | Germany IFO Expectations Mar | 85.4 | |
| 13:00 | USD | S&P/CS Composite-20 HPI Y/Y Jan | 4.60% | 4.50% |
| 13:00 | USD | Housing Price Index M/M Jan | 0.20% | 0.40% |
| 14:00 | USD | Consumer Confidence Mar | 94.2 | 98.3 |
| 14:00 | USD | New Home Sales Feb | 682K | 657K |
| GMT | Ccy | Events | |
|---|---|---|---|
| 09:00 | EUR | Germany IFO Business Climate Mar | |
| Forecast: 87 | Previous: 85.2 | ||
| 09:00 | EUR | Germany IFO Current Assessment Mar | |
| Forecast: | Previous: 85 | ||
| 09:00 | EUR | Germany IFO Expectations Mar | |
| Forecast: | Previous: 85.4 | ||
| 13:00 | USD | S&P/CS Composite-20 HPI Y/Y Jan | |
| Forecast: 4.60% | Previous: 4.50% | ||
| 13:00 | USD | Housing Price Index M/M Jan | |
| Forecast: 0.20% | Previous: 0.40% | ||
| 14:00 | USD | Consumer Confidence Mar | |
| Forecast: 94.2 | Previous: 98.3 | ||
| 14:00 | USD | New Home Sales Feb | |
| Forecast: 682K | Previous: 657K | ||
Wednesday, Mar 26, 2025
| GMT | Ccy | Events | Consensus | Previous |
|---|---|---|---|---|
| 00:30 | AUD | Monthly CPI Y/Y Feb | 2.50% | 2.50% |
| 07:00 | GBP | CPI M/M Feb | -0.10% | |
| 07:00 | GBP | CPI Y/Y Feb | 2.90% | 3% |
| 07:00 | GBP | Core CPI Y/Y Feb | 3.60% | 3.70% |
| 07:00 | GBP | RPI M/M Feb | -0.10% | |
| 07:00 | GBP | RPI Y/Y Feb | 3.60% | 3.60% |
| 09:00 | CHF | UBS Economic Expectations Mar | 3.4 | |
| 12:30 | USD | Durable Goods Orders Feb | -0.70% | 3.20% |
| 12:30 | USD | Durable Goods Orders ex Transportation Feb | 0.40% | 0% |
| 14:30 | USD | Crude Oil Inventories | 1.7M |
| GMT | Ccy | Events | |
|---|---|---|---|
| 00:30 | AUD | Monthly CPI Y/Y Feb | |
| Forecast: 2.50% | Previous: 2.50% | ||
| 07:00 | GBP | CPI M/M Feb | |
| Forecast: | Previous: -0.10% | ||
| 07:00 | GBP | CPI Y/Y Feb | |
| Forecast: 2.90% | Previous: 3% | ||
| 07:00 | GBP | Core CPI Y/Y Feb | |
| Forecast: 3.60% | Previous: 3.70% | ||
| 07:00 | GBP | RPI M/M Feb | |
| Forecast: | Previous: -0.10% | ||
| 07:00 | GBP | RPI Y/Y Feb | |
| Forecast: 3.60% | Previous: 3.60% | ||
| 09:00 | CHF | UBS Economic Expectations Mar | |
| Forecast: | Previous: 3.4 | ||
| 12:30 | USD | Durable Goods Orders Feb | |
| Forecast: -0.70% | Previous: 3.20% | ||
| 12:30 | USD | Durable Goods Orders ex Transportation Feb | |
| Forecast: 0.40% | Previous: 0% | ||
| 14:30 | USD | Crude Oil Inventories | |
| Forecast: | Previous: 1.7M | ||
Thursday, Mar 27, 2025
| GMT | Ccy | Events | Consensus | Previous |
|---|---|---|---|---|
| 09:00 | EUR | Eurozone M3 Money Supply Y/Y Feb | 3.80% | 3.60% |
| 12:30 | USD | Initial Jobless Claims (Mar 21) | 225K | 223K |
| 12:30 | USD | GDP Annualized Q4 F | 2.30% | 2.30% |
| 12:30 | USD | GDP Price Index Q4 F | 2.40% | 2.40% |
| 12:30 | USD | Goods Trade Balance (USD) Feb P | -134.6B | -155.6B |
| 12:30 | USD | Wholesale Inventories Feb P | 0.80% | |
| 14:00 | USD | Pending Home Sales M/M Feb | -4.60% | |
| 14:30 | USD | Natural Gas Storage | 9B | |
| 23:30 | JPY | Tokyo CPI Y/Y Mar | 2.90% | |
| 23:30 | JPY | Tokyo CPI Core Y/Y Mar | 2.20% | 2.20% |
| 23:30 | JPY | Tokyo CPI Core-Core Y/Y Mar | 2.20% | |
| 23:50 | JPY | BoJ Summary of Opinions |
| GMT | Ccy | Events | |
|---|---|---|---|
| 09:00 | EUR | Eurozone M3 Money Supply Y/Y Feb | |
| Forecast: 3.80% | Previous: 3.60% | ||
| 12:30 | USD | Initial Jobless Claims (Mar 21) | |
| Forecast: 225K | Previous: 223K | ||
| 12:30 | USD | GDP Annualized Q4 F | |
| Forecast: 2.30% | Previous: 2.30% | ||
| 12:30 | USD | GDP Price Index Q4 F | |
| Forecast: 2.40% | Previous: 2.40% | ||
| 12:30 | USD | Goods Trade Balance (USD) Feb P | |
| Forecast: -134.6B | Previous: -155.6B | ||
| 12:30 | USD | Wholesale Inventories Feb P | |
| Forecast: | Previous: 0.80% | ||
| 14:00 | USD | Pending Home Sales M/M Feb | |
| Forecast: | Previous: -4.60% | ||
| 14:30 | USD | Natural Gas Storage | |
| Forecast: | Previous: 9B | ||
| 23:30 | JPY | Tokyo CPI Y/Y Mar | |
| Forecast: | Previous: 2.90% | ||
| 23:30 | JPY | Tokyo CPI Core Y/Y Mar | |
| Forecast: 2.20% | Previous: 2.20% | ||
| 23:30 | JPY | Tokyo CPI Core-Core Y/Y Mar | |
| Forecast: | Previous: 2.20% | ||
| 23:50 | JPY | BoJ Summary of Opinions | |
| Forecast: | Previous: | ||
Friday, Mar 28, 2025
| GMT | Ccy | Events | Consensus | Previous |
|---|---|---|---|---|
| 07:00 | EUR | Germany GfK Consumer Confidence Apr | -22.2 | -24.7 |
| 07:00 | GBP | Retail Sales M/M Feb | -0.30% | 1.70% |
| 07:00 | GBP | Goods Trade Balance (GBP) Jan | -16.8B | -17.4B |
| 07:00 | GBP | GDP Q/Q Q4 F | 0.10% | 0.10% |
| 07:00 | GBP | Current Account (GBP) Q4 | -16.7B | -18.1B |
| 08:00 | CHF | KOF Economic Barometer Mar | 102.6 | 101.7 |
| 08:55 | EUR | Germany Unemployment Change Feb | 10K | 5K |
| 08:55 | EUR | Germany Unemployment Rate Feb | 6.20% | |
| 10:00 | EUR | Eurozone Economic Sentiment Indicator Mar | 96.3 | |
| 10:00 | EUR | Eurozone Industrial Confidence Mar | -11.4 | |
| 10:00 | EUR | Eurozone Services Sentiment Mar | 6.2 | |
| 10:00 | EUR | Eurozone Consumer Confidence Mar F | -14.5 | |
| 12:30 | CAD | GDP M/M Jan | 0.20% | |
| 12:30 | USD | Personal Income Feb | 0.40% | 0.90% |
| 12:30 | USD | Personal Spending Feb | 0.60% | -0.20% |
| 12:30 | USD | PCE Price Index M/M Feb | 0.30% | |
| 12:30 | USD | PCE Price Index Y/Y Feb | 2.50% | |
| 12:30 | USD | Core PCE Price Index M/M Feb | 0.30% | |
| 12:30 | USD | Core PCE Price Index Y/Y Feb | 2.60% | |
| 14:00 | USD | Michigan Consumer Sentiment Index Mar F | 57.9 | 57.9 |
| GMT | Ccy | Events | |
|---|---|---|---|
| 07:00 | EUR | Germany GfK Consumer Confidence Apr | |
| Forecast: -22.2 | Previous: -24.7 | ||
| 07:00 | GBP | Retail Sales M/M Feb | |
| Forecast: -0.30% | Previous: 1.70% | ||
| 07:00 | GBP | Goods Trade Balance (GBP) Jan | |
| Forecast: -16.8B | Previous: -17.4B | ||
| 07:00 | GBP | GDP Q/Q Q4 F | |
| Forecast: 0.10% | Previous: 0.10% | ||
| 07:00 | GBP | Current Account (GBP) Q4 | |
| Forecast: -16.7B | Previous: -18.1B | ||
| 08:00 | CHF | KOF Economic Barometer Mar | |
| Forecast: 102.6 | Previous: 101.7 | ||
| 08:55 | EUR | Germany Unemployment Change Feb | |
| Forecast: 10K | Previous: 5K | ||
| 08:55 | EUR | Germany Unemployment Rate Feb | |
| Forecast: | Previous: 6.20% | ||
| 10:00 | EUR | Eurozone Economic Sentiment Indicator Mar | |
| Forecast: | Previous: 96.3 | ||
| 10:00 | EUR | Eurozone Industrial Confidence Mar | |
| Forecast: | Previous: -11.4 | ||
| 10:00 | EUR | Eurozone Services Sentiment Mar | |
| Forecast: | Previous: 6.2 | ||
| 10:00 | EUR | Eurozone Consumer Confidence Mar F | |
| Forecast: | Previous: -14.5 | ||
| 12:30 | CAD | GDP M/M Jan | |
| Forecast: | Previous: 0.20% | ||
| 12:30 | USD | Personal Income Feb | |
| Forecast: 0.40% | Previous: 0.90% | ||
| 12:30 | USD | Personal Spending Feb | |
| Forecast: 0.60% | Previous: -0.20% | ||
| 12:30 | USD | PCE Price Index M/M Feb | |
| Forecast: | Previous: 0.30% | ||
| 12:30 | USD | PCE Price Index Y/Y Feb | |
| Forecast: | Previous: 2.50% | ||
| 12:30 | USD | Core PCE Price Index M/M Feb | |
| Forecast: | Previous: 0.30% | ||
| 12:30 | USD | Core PCE Price Index Y/Y Feb | |
| Forecast: | Previous: 2.60% | ||
| 14:00 | USD | Michigan Consumer Sentiment Index Mar F | |
| Forecast: 57.9 | Previous: 57.9 | ||