
Sample Category Title
EUR/JPY Daily Outlook
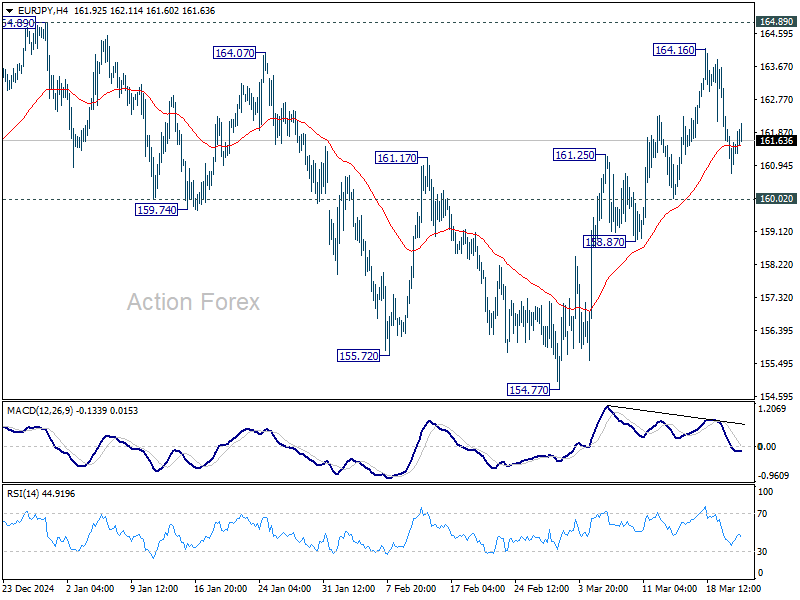
Daily Pivots: (S1) 160.71; (P) 161.52; (R1) 162.30; More...
Intraday bias in EUR/JPY remains neutral at this point. For now, further rally is expected as long as 160.02 support holds. Above 164.16 will target 164.89 resistance. However, break of 160.02 will indicate short term topping, and turn bias back to the downside. Overall, sideway consolidation pattern from 154.40 is still extending.
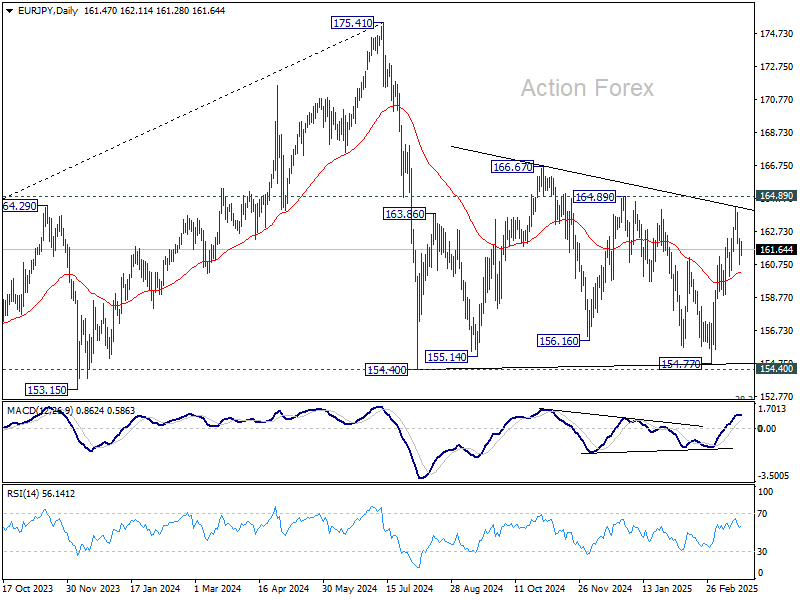
In the bigger picture, price actions from 175.41 are seen as correction to rally from 114.42 (2020 low). Strong support should be seen from 38.2% retracement of 114.42 to 175.41 at 152.11 to contain downside. However, sustained break of 152.11 will bring deeper fall even still as a correction.
EUR/GBP Daily Outlook
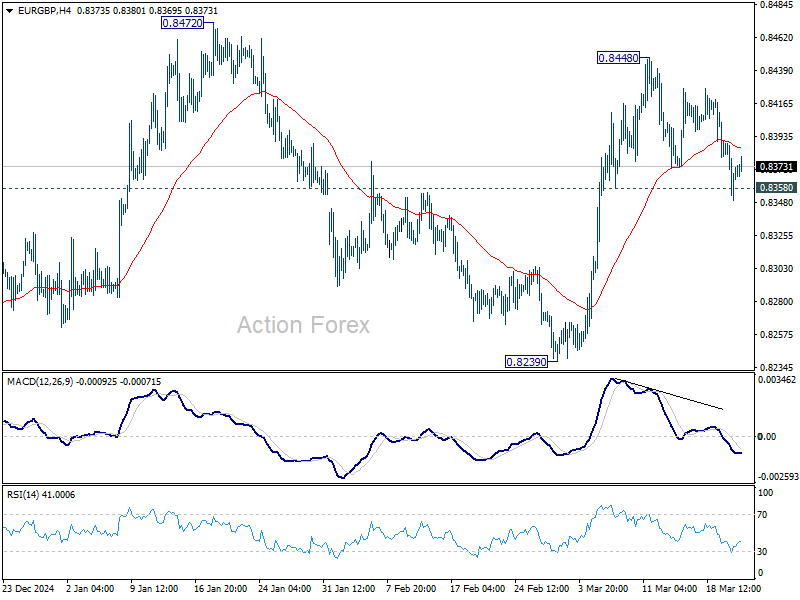
Daily Pivots: (S1) 0.8349; (P) 0.8372; (R1) 0.8393; More...
Intraday bias in EUR/GBP stays neutral at this point. Further rally is expected as long as 0.8358 minor support holds. On the upside, break of 0.8448 will target 0.8472 resistance first. Firm break there will resume whole rebound from 0.8221 to medium term falling channel resistance (now at 0.8504). Nevertheless, break of 0.8358 will suggest that rise from 0.8239 has completed and turn bias back to the downside instead.
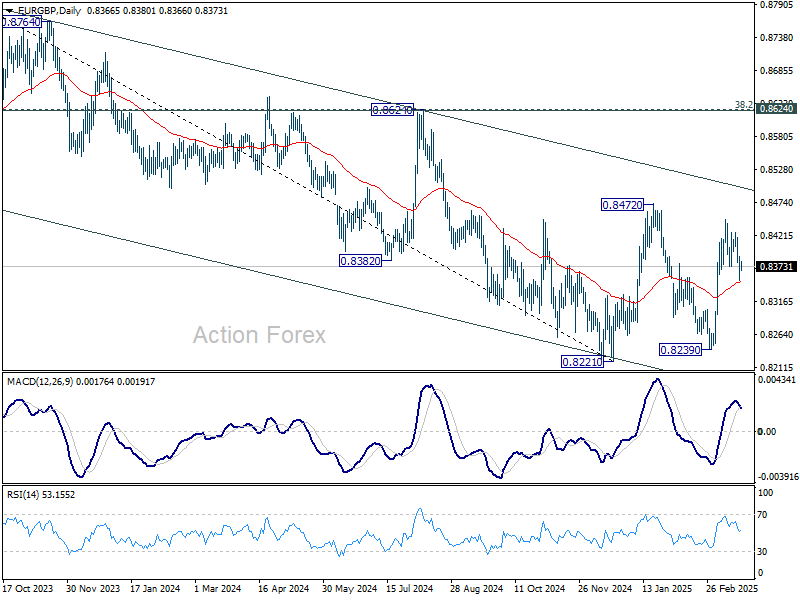
In the bigger picture, EUR/GBP is still bounded inside medium term falling channel. While rebound from 0.8221 might extend higher, it could still develop into a corrective pattern. Overall outlook will be neutral at best and down trend from 0.9267 (2022 high) could extend, at least until decisive break of channel resistance (now at 0.8508).
EUR/AUD Daily Outlook
Daily Pivots: (S1) 1.7153; (P) 1.7211; (R1) 1.7277; More...
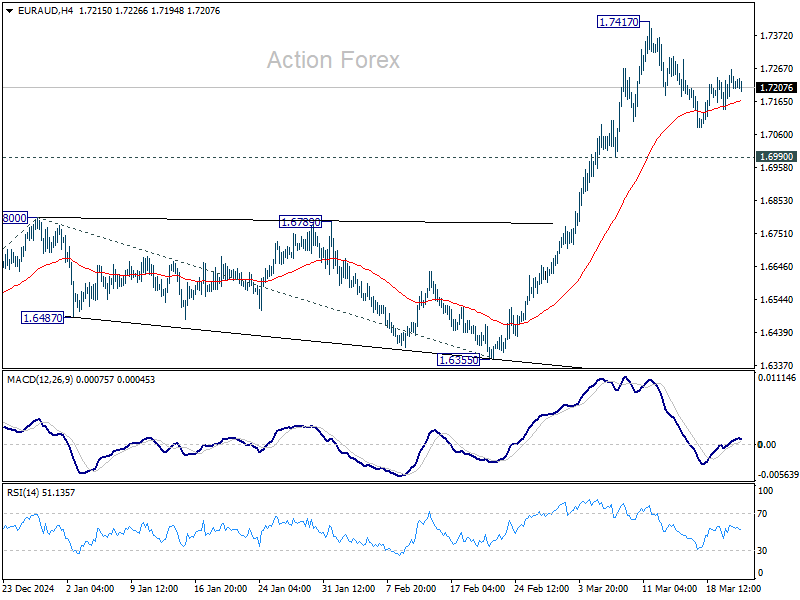
EUR/AUD is extending consolidations below 1.7417 and intraday bias remains neutral. Downside of retreat should be contained by 0.6990 support to bring rebound. On the upside, break of 1.7417 will resume rise from 1.6335 to 161.8% projection of 1.5963 to 1.6800 from 1.6355 at 1.7709 next.
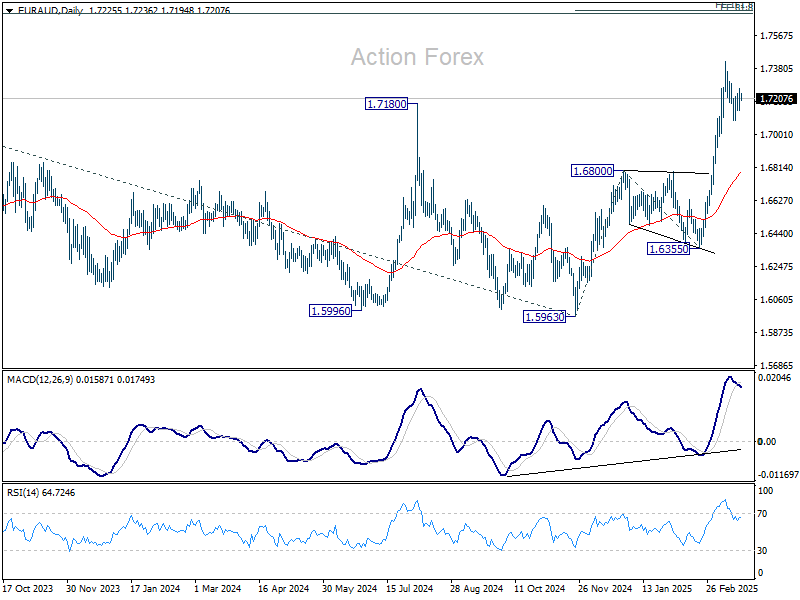
In the bigger picture, the breach of 1.7180 key resistance (2024 high) suggests that up trend from 1.4281 (2022 low) is resuming. Sustained trading above 1.7180 will confirm and target 61.8% projection of 1.4281 to 1.7062 from 1.5963 at 1.7682, which is also close to 61.8% retracement of 1.9799 (2020 high) to 1.4281 at 1.7691. For now, this will remain the favored case as long as 1.6800 resistance turned support holds, even in case of deep pullback.
EUR/CHF Daily Outlook
Daily Pivots: (S1) 0.9539; (P) 0.9562; (R1) 0.9593; More....
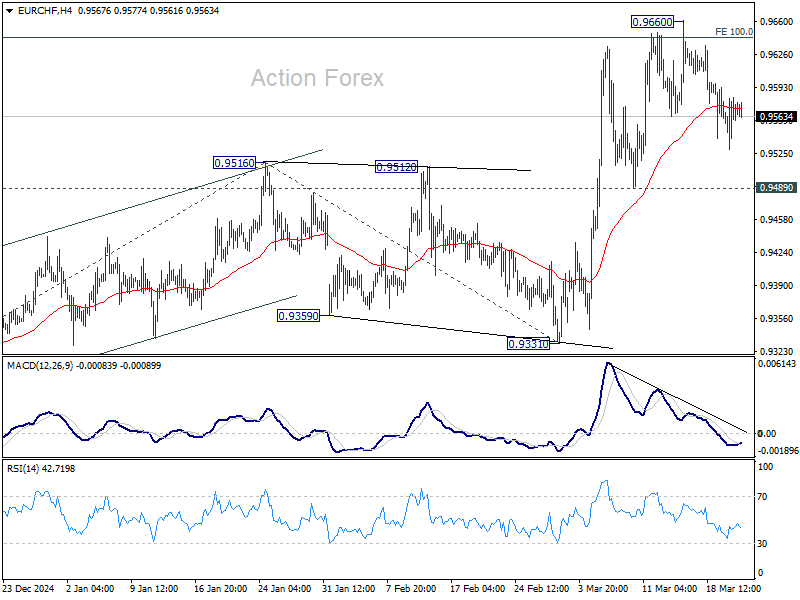
Intraday bias in EUR/CHF remains neutral as consolidations continue below 0.9660. Further rally is expected as long as 0.9489 support holds. Sustained trading above 100% projection of 0.9204 to 0.9516 from 0.9331 at 0.9643 will pave the way to 161.8% projection at 0.9836 next.
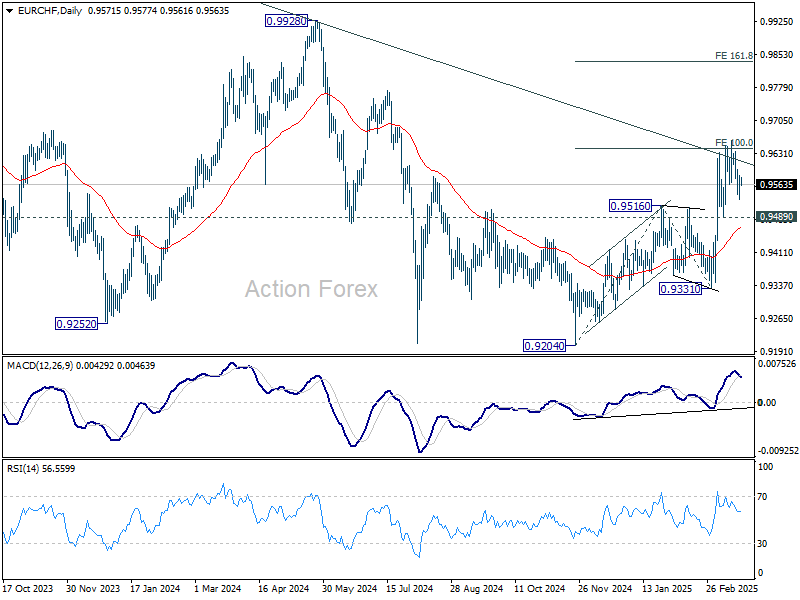
In the bigger picture, prior strong break of 55 W EMA (now at 0.9487) is a medium term bullish sign. Sustained break trading above long-term falling channel resistance (at around 0.9620) would suggest that the downtrend from 1.2004 (2018 high) has bottomed at 0.9204. Stronger rally should then be see to 0.9928 key resistance at least.
EUR/USD Daily Outlook
Daily Pivots: (S1) 1.0806; (P) 1.0862; (R1) 1.0908; More...
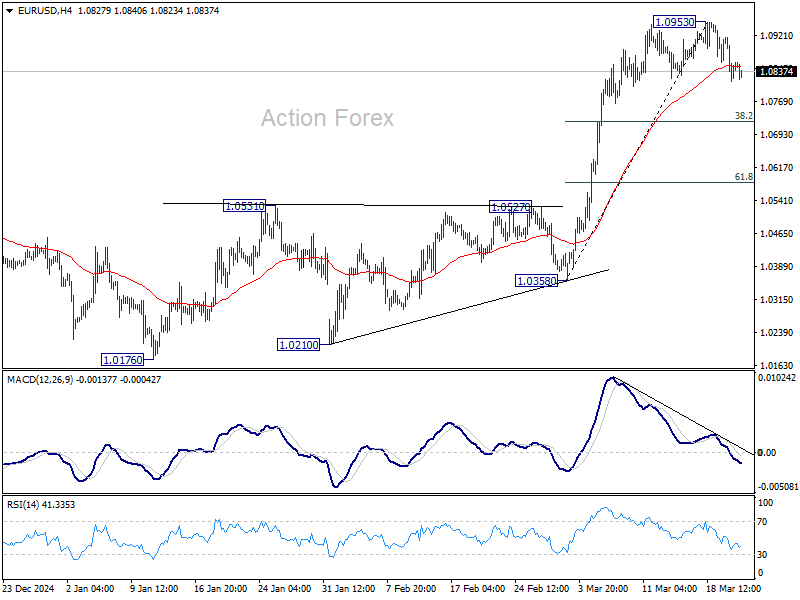
Intraday bias in EUR/USD is mildly on the downside. Pull back from 1.0953 short term top would extend to 38.2% retracement of 1.0358 to 1.0953 at 1.0726. Strong support should be seen there to bring rebound. Meanwhile, break of 1.0953 will resume the rally from 1.0176 towards 1.1274 key resistance.
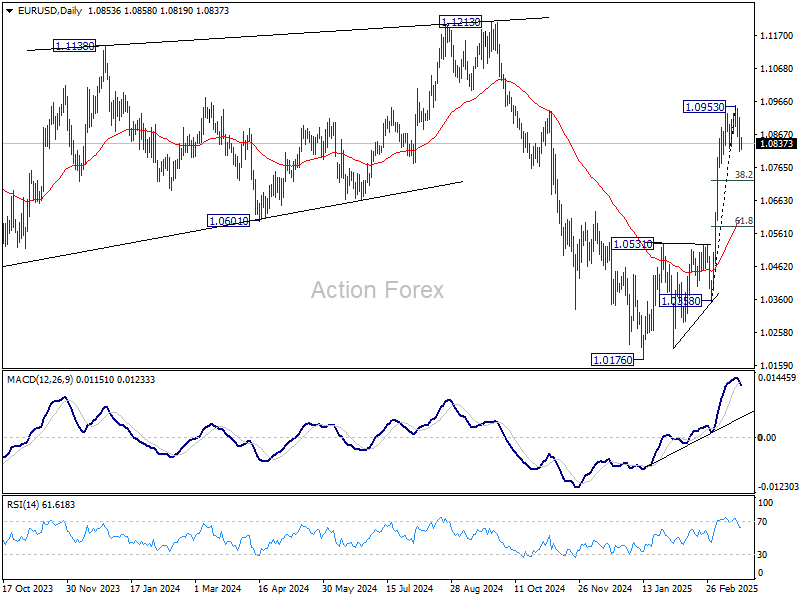
In the bigger picture, prior strong break of 55 W EMA (now at 1.0675) suggests that fall from 1.1274 (2024 high) has completed as a three wave correction to 1.0176. Rise from 0.9534 is still intact, and might be ready to resume. Decisive break of 1.1274 will target 100% projection of 0.9534 to 1.1274 from 1.0176 at 1.1916. Also, that will send EUR/USD through a multi-decade channel resistance will carries larger bullish implication. This will now be the favored case as long as 1.0531 resistance turned support holds.
GBP/USD Daily Outlook
Daily Pivots: (S1) 1.2930; (P) 1.2973; (R1) 1.3009; More...
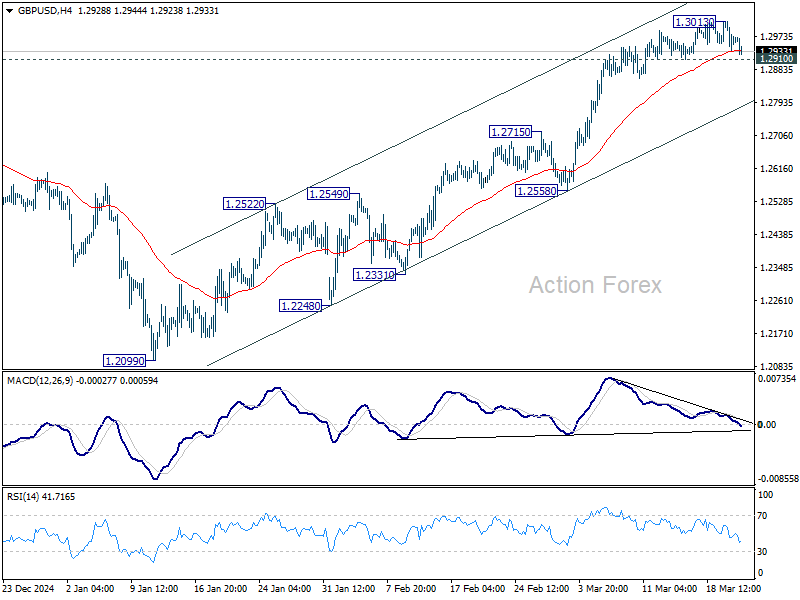
Intraday bias in GBP/USD remains neutral for the moment. On the downside, firm break of 1.2910 support should confirm short term topping, on bearish divergence condition in 4H MACD. In this case, intraday bias will be back on the downside for near term channel support (now at 1.2786). On the upside, though, above 1.3013 will resume the rally from 1.2099 towards 1.3433 high.
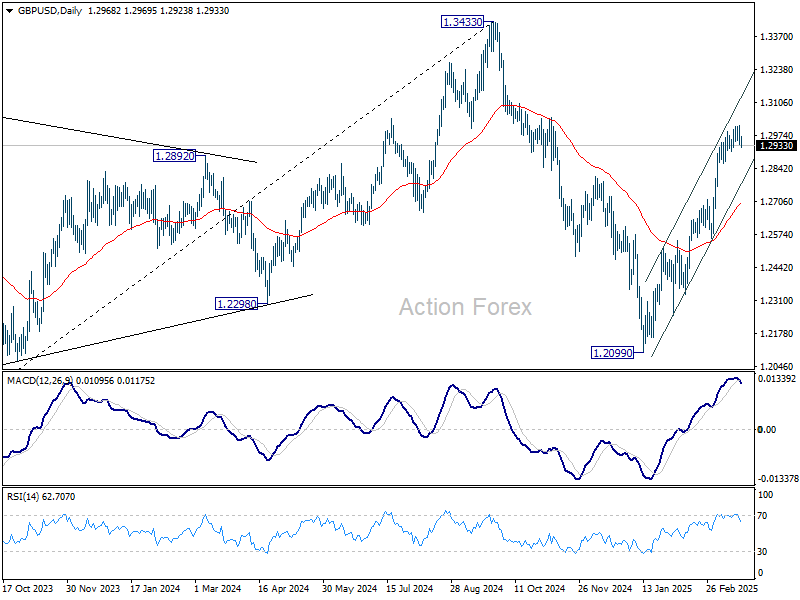
In the bigger picture, up trend from 1.3051 (2022 low) is not completed. Resumption is expected after corrective pattern from 1.3433 completes. Next target will be 1.4248 key resistance. This will now remain the favored case as long as 1.2099 support holds.
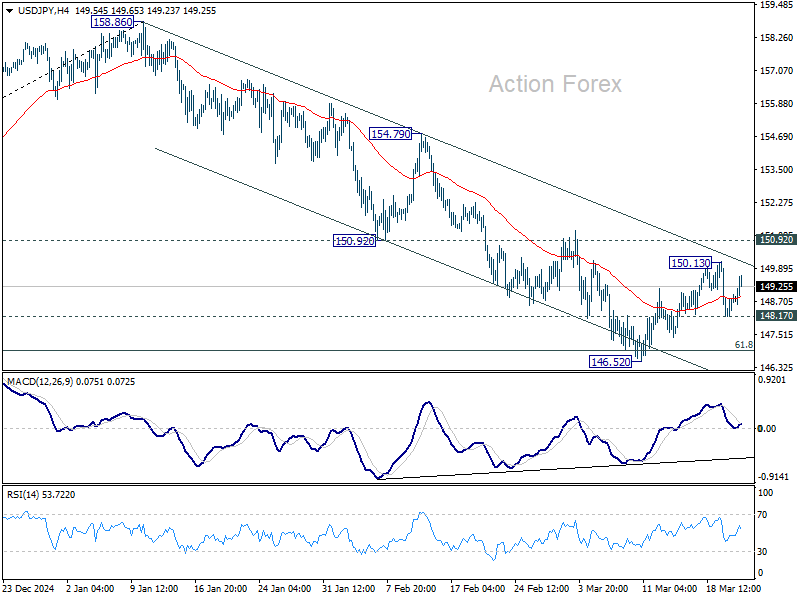
USD/JPY Daily Outlook
Daily Pivots: (S1) 148.32; (P) 148.64; (R1) 149.10; More...
USD/JPY's corrective pattern from 146.52 is still extending and intraday bias stays neutral. In case of stronger recovery, upside should be limited by 150.92 support turned resistance. On the downside, firm break of 148.17 support will bring retest of 146.52 first. Sustained trading below 61.8% retracement of 139.57 to 158.86 at 146.32 will resume the fall from 158.86 to 139.57 support.
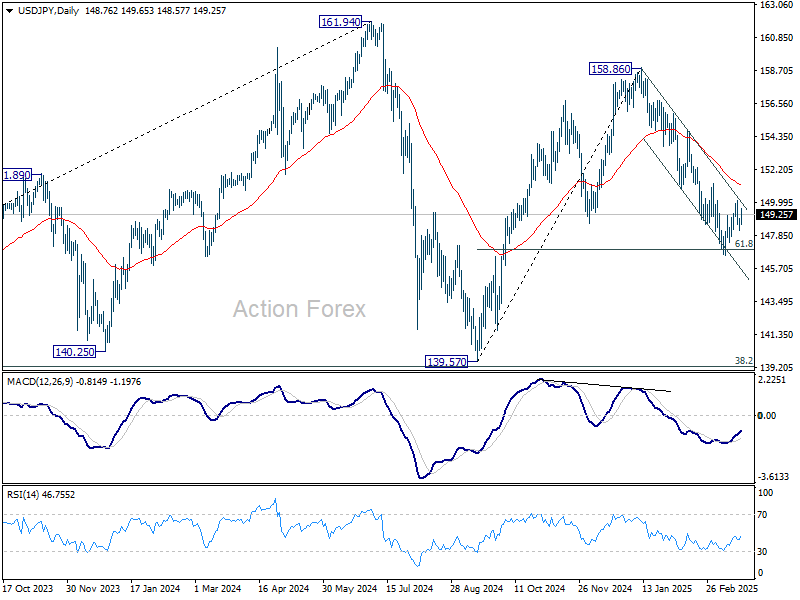
In the bigger picture, price actions from 161.94 are seen as a corrective pattern to rise from 102.58 (2021 low), with fall from 158.86 as the third leg. Strong support should be seen from 38.2% retracement of 102.58 to 161.94 at 139.26 to bring rebound. However, sustained break of 139.26 would open up deeper medium term decline to 61.8% retracement at 125.25.
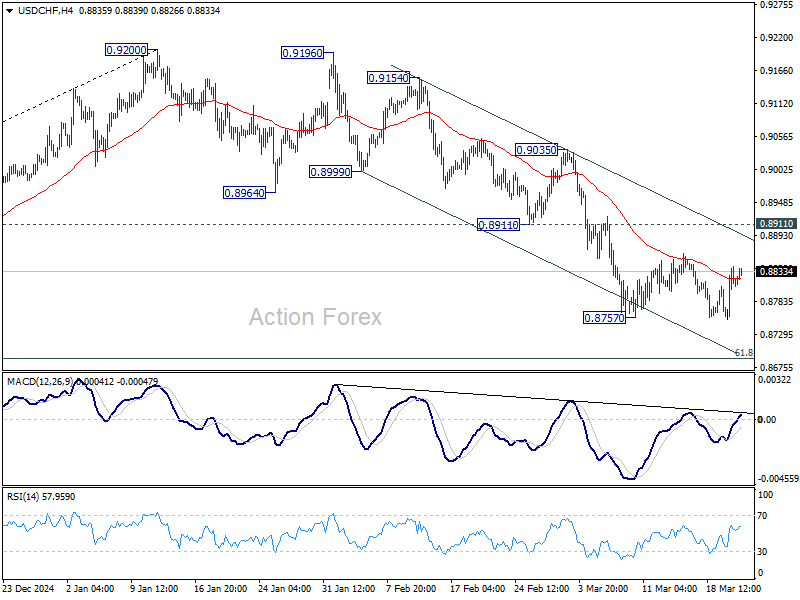
USD/CHF Daily Outlook
Daily Pivots: (S1) 0.8768; (P) 0.8806; (R1) 0.8855; More…
Range trading continues in USD/CHF and intraday bias remains neutral. While stronger recovery cannot be ruled out, upside should be limited by 0.8911 support turned resistance. On the downside, break of 0.8757 will resume the fall from 0.9200 to 61.8% retracement of 0.8374 to 0.9200 at 0.8690. Sustained break there will pave the way back to 0.8374 support.
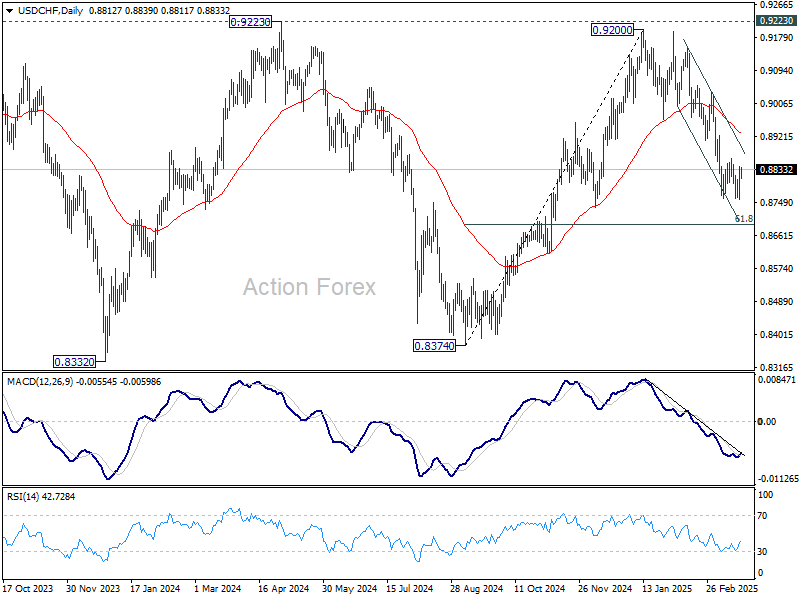
In the bigger picture, rejection by 0.9223 key resistance keep medium term outlook bearish. That is, larger fall from 1.0342 (2017 high) is not completed yet. Firm break of 0.8332 (2023 low) will confirm down trend resumption.
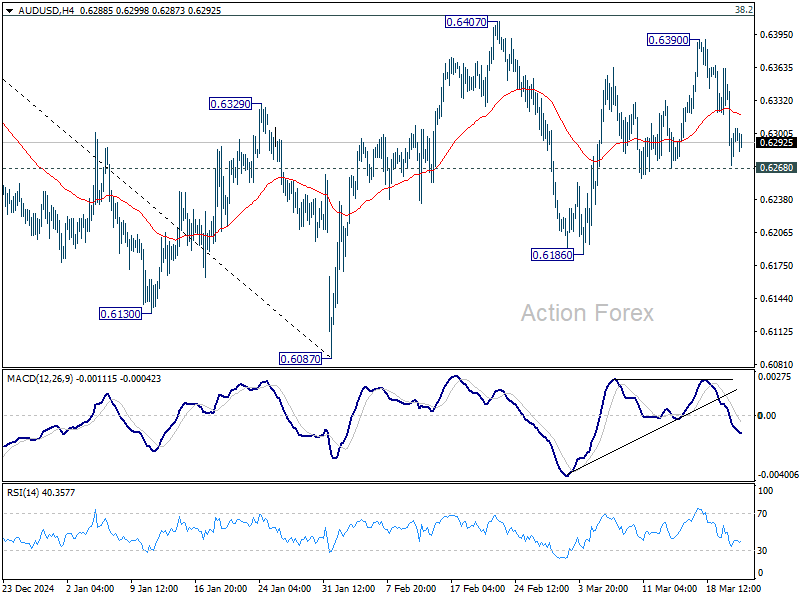
AUD/USD Daily Report
Daily Pivots: (S1) 0.6261; (P) 0.6313; (R1) 0.6354; More...
No change in AUD//USD outlook and intraday bias stays neutral. On the downside, break of 0.6268 will bring deeper fall to 0.6186 support. Firm break there will target a retest on 0.6807 low. On the upside, firm break of 0.6407 will resume the rebound from 0.6087.
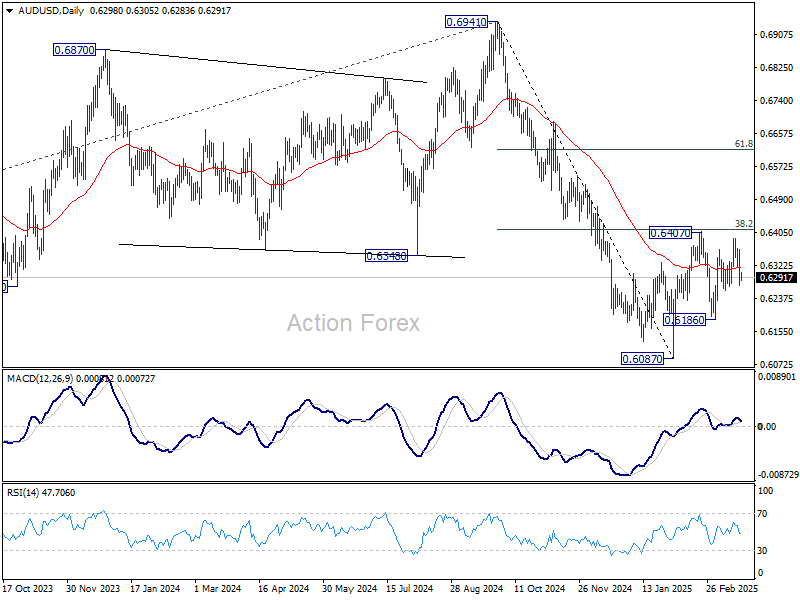
In the bigger picture, fall from 0.6941 (2024 high) is seen as part of the down trend from 0.8006 (2021 high). Next medium term target is 61.8% projection of 0.8006 to 0.6169 from 0.6941 at 0.5806. In any case, outlook will stay bearish as long as 55 W EMA (now at 0.6482) holds.
EUR/USD Correcting Lower for a Third Day
Markets
European markets unlike their US counterpart had a pessimistic view on the Fed’s policy decision. While the latter took comfort from chair Powell’s reassuring message during the presser, the former seem to eye the stagflationary risks in the updated forecasts. Stocks, core bond yields and the euro dropped. Sentiment then took a turn for the better around the start of US dealings. News of the EU delaying retaliatory tariffs until mid-April (from April 1) to allow for dialogue helped the turnaround, as did way stronger than expected housing data a bit later. Equities in Europe bottomed though still finished 1% lower in the close. WS shrugged off most of the initial contagion losses during the US session. European yields cut their previous losses in half, ending around 2-3 bps lower in a daily perspective. US rates (almost) fully wiped out declines of up to 7 bps. EUR/USD bounced off 1.082 to close at 1.085. Sterling rose as high as EUR/GBP 0.835 before paring some of those gains to 0.837. The labour market report was a tad better than anticipated and the Bank of England held rates steady. A deeper dive in the 8-1 split vote (one member voting for a cut) showed two policymakers who voted for cuts at all three previous meetings taking a cautious turn by supporting the rates hold. UK money markets pared some of the easing bets from more than to slightly below two rate cuts this year.
Asian (and more specially Chinese) risk-off is set to spillover in some degree to Europe with stock futures pointing at a 0.4% lower open. Risk sentiment will probably remain key for markets in absence of an inspiring economic calendar and ahead of the weekend. We expect technical trading in FX and FI markets. The dollar is trying to build on a bottoming out process with DXY attacking the 104 resistance area. EUR/USD is correcting lower for a third day but should find support around 1.08. The US 10-yr yield holds tight in a narrow sideways trading range while the 10-yr EU swap grinds lower. The January high at 2.63% serves as a strong support. The unpredictable tariff narrative appears to gain some traction again as the April 2 reciprocal date draws closer. The EU’s olive branch yesterday was answered by White House press secretary Leavitt with renewed “big tariff” threats. Yesterday’s EU summit revealed some divisions, first and foremost with Hungary again opposing the €5bn in Ukrainian aid. Southern countries are seeking a broader definition in terms of what to include under “defense spending”, which is exempted for 1.5% of GDP from the deficit rules. French president Macron late yesterday announced a new summit in Paris next week during which he is looking for a coalition of the willing.
News & Views
In a speech in Calgary yesterday, Tiff Macklem elaborated on the difficult context that the central bank is facing due to uncertainty surrounding US tariffs on Canadian imports. The Bank of Canada governor indicated that it could be appropriate for the bank consider a range of economic estimates rather than one single forecast. He also pointed to the dangers of adjusting policy too quickly based on an uncertain outlook. In the current environment policy should be less forward looking until the situation is clearer and then act more quickly ‘when things crystallize’. This at least suggest the BOC is moving to a wait-and-see approach. Macklem nonetheless indicated that there should be no doubt that the BOC stays committed to low inflation. The Bank wants to avoid that higher import costs due to the deprecation of the currency and retaliatory tariffs will spread to consumer prices and affect the anchoring of inflation expectations. The impact of the tariffs war limits the Banks’ room to support the economy. The market currently only sees about a 35% for an additional 25 bps BOC rate cut next month.
British consumers’ moral in March turned slightly more positive for the third consecutive month. The GFK consumer confidence index improved from -20 to -19 to be compared to short-term low of -22 in January. Even so, the indicator remains well below the long-term average near -10. Consumers turned slightly more optimistic about the economic situation, both in the last 12 months (-42 from -44- and also for the next 12 months (-29 from –31). At the same time consumer again turned less positive on their personal finances. "The current stability is to be welcomed but it won't take much to upset the fragile consumer mood," Neil Bellamy, consumer insights director at GfK was quoted.