Sample Category Title
XAU/USD Analysis: Forms Symmetrical Triangle
Even though the US House and Senate came to agreement on tax reform while the Census Bureau showed an increase in the Core Retail Sales, the exchange rate did not even pass the 1,250.00 mark. From technical point of view, yesterday’s movement revealed that the pair is moving simultaneously in junior ascending and descending channels that are located within the three-week long channel down. For this reason, the rate is expected to continue paving path to the north despite the hindrance set up by the 200-hour SMA and the weekly PP. In support of this, an absolute majority of pending orders in 500-pip range are set to buy. However, there is a high chance that this target will not be achieved today due to empty economic calendar and traditionally low trading activity.
EUR/USD: US Retail Sales
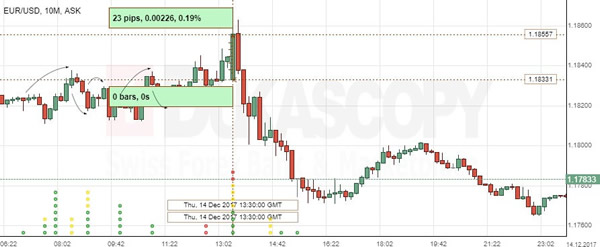
The US Dollar touched its weakest point against the Euro, following the stronger-than-expected retail sales report. The EUR/USD exchange rate rose 23 base points to the 1.1855 area, but reversed an upward trend to be seen trading below the 1.1800 mark.
The US retail sales expended more than anticipated in November, amid the brisk start of holiday season, suggesting that sustained economic strength could set the stage for further Fed’s rate hikes in 2018. The Commerce Department stated that the country’s retail sales increased 0.8% in November, following an upwardly revised 0.5% gain in the prior month, as households bought range of goods, while cutting motor purchases.
GBP/USD: BoE Interest Rate Decision
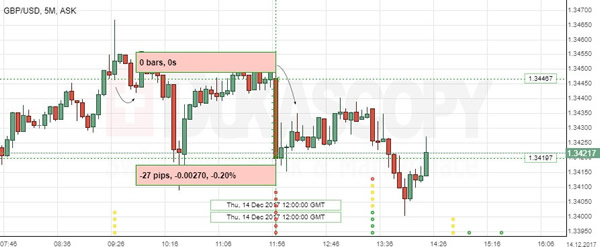
The British Pound fell sharply against the US Dollar, as the Bank of England announced its rate decision on Thursday. The GBP/USD exchange rate depreciated 27 base points or 0.20% to the 1.3419 mark, but managed to keep the position nearing the 1.3440.
A breakthrough in Brexit negotiations diminished the risk of a disordelry Britain’s quit from the EU and is likely to encourage corporate and household confidence, the Bank of England stated. The Central Bank’s policymakers voted to keep interest rates unchanged at 0.50%, in line with expectations, after raising them last month, as inflation growth reached its strongest level in almost six years, while unemployment rate remained very low.
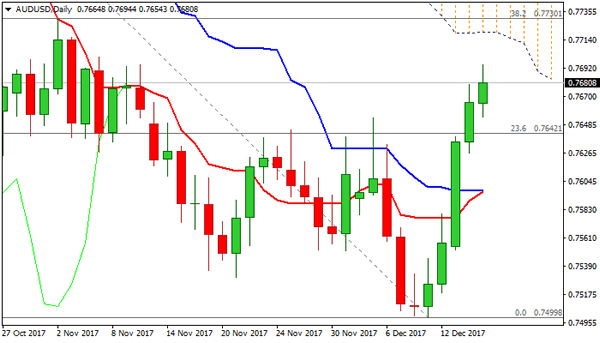
Technical Outlook: AUDUSD – Bulls Extend Into Fifth Straight Day And Look For Attack At Daily Cloud Base
The Aussie dollar holds in green for the fifth consecutive day and fresh extension on Friday cracks 200SMA barrier at 0.7691.
Daily studies are turning into full bullish setup and support further advance, as US dollar's sentiment remains weak after Fed's disappointment.
Converged 10/20SMA's and daily Tenkan-sen / Kijun-sen are attempting to form bullish crosses and further underpin bulls.
Break above 200SMA will open way for attack at key barriers at 0.7719/29 (base of thick falling daily cloud / 02 Nov high), break of which would generate another strong bullish signal.
Full retracement of 0.7729/0.7499 downleg would signal further correction of larger downtrend from 0.8102 (20 Sep high) as 0.7729 barrier is also Fibo 38.2% of 0.8102/0.7499 descend.
Broken 30SMA (0.7603) is expected to keep the downside protected.
Res: 0.7694, 0.7719, 0.7729, 0.7800
Sup: 0.7654, 0.7626, 0.7603, 0.7584
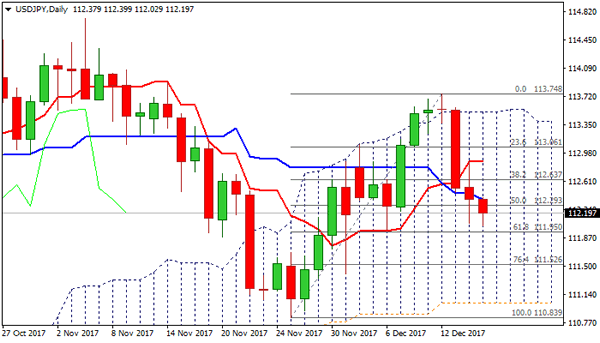
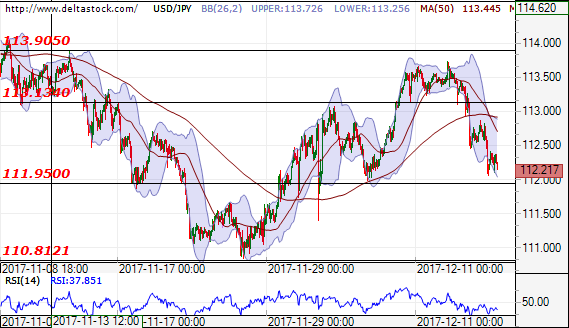
Technical Outlook: USDJPY – Bears Pressure Pivotal Fibo Support At 111.95
The pair remains in red for the third straight day and hit marginally lower low on Friday at 112.02, pressuring strong support at 111.95 (Fibo 61.8% of 110.83/113.74 / 06 Dec low).
Break and close below 111.95 would generate bearish signal for further weakness towards next targets at 111.69/62 (100/200SMA’s) and would look for test of key supports at 111.02 (daily cloud base) and 110.83 (27 Nov low) in extension.
Wednesday’s long bearish candle continues to weigh, along with dovish Fed, keeping bias with bears.
Broken daily Kijun-sen which caps today’s action, marks initial resistance at 112.37, with extended upticks expected to remain under converged 10/55SMA’s at 112.80/84.
Res: 112.37, 112.66, 112.84, 113.09
Sup: 111.95, 111.62, 111.52, 111.02
European Futures Lower | Investors Digest Fed And ECB Message
US tax overhaul bill threatened by Republican Senator
Investors diogest Federal Reserve and ECB events
US consumers assured about their spending
European futures are trading lower and failed to pick up the momentum from Wall Street. Thanks to Republican Senator, Rubio, who threatened not to back the tax overhaul bill. He wants the Senate leaders to provide more child tax credits. Investors are digesting this message along with the new development from the Federal Reserve. Combination of these two factors are having an adverse impact on the sentiment among traders today. If there was one theme which remained prominent and helped the US Markets to post record highs throughout this year, it was the hopes around the US tax overhaul. Investors pilled their bullish bets on the hopes that it will help the US economy to grow.
However, as we move closer to 2018, traders aren’t really that optimistic and a decent majority could start to take their profits off the table. We have seen eight years of the bull rally since the financial crisis and this very fact is going to keep them in their cautionary mode.
US Data
The strong US retail sales number has confirmed that the US consumers are a lot more assured about their spending habit. We have not seen this strong pace of strength for the US retail sales data since 2012. Of course, Black Friday offers has a lot to do with the US retail sales data, but it is the moderate growth in the wage growth which is fuelling the retail sales. Improving retail sales number along with US tax overhaul would help Wall Street major indices to post another record highs.
ECB
No bang, no drama from the ECB today. Traders have shown no reaction and all eyes will be on Draghi’s speech, because it is only his press conference which can bring some life to ECB’s event. The ECB’s staff forecast and what exactly the ECB is thinking could be judged by this press conference. Eurozone’s economy has been on fire since this year and especially this is true when you see countries like Greece posting positive GDP. Thus, there is less incentive for the ECB to stay overly dovish with their approach.
Draghi’s overall tone was more optimistic today and this has helped to the Euro. He increased the growth forecast for 2018 to 2.3% which was well above the previous number of 1.8%. Anything below 1.8% or at the same level would have sent the message that the bank is not confident but the number of 2.3% sends the signal that things are on fire. However, on balance you could say that Draghi wasn’t overly dovish and this really pays the way for the euro and ECB’s monetary policy.
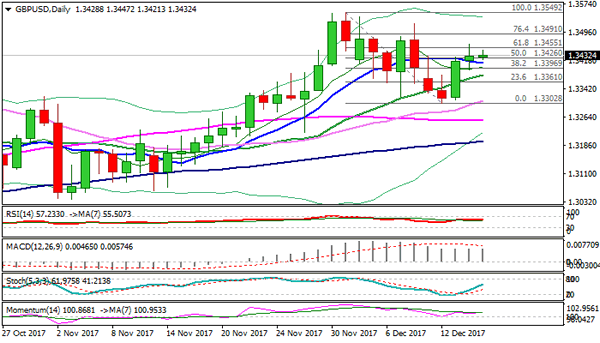
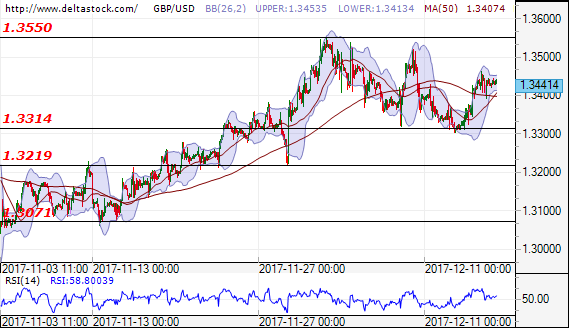
Technical Outlook: GBPUSD – Bulls Are Taking A Break But Focus Remains At The Upside
Cable is holding within narrow consolidation in early Friday's trading after strong rally in past two days which peaked at 1.3464. Thursday's long-legged daily candle suggests bulls might be running out of steam, but overall structure remains firm. Consolidation is expected to hold above 10SMA (1.3412) to keep bullish bias intact for fresh upside towards 1.3500+. Conversely, loss of 10 SMA handle would weaken near-term structure with extension below rising 20SMA (1.3380) to signal reversal.
Res: 1.3447, 1.3464, 1.3491, 1.3520
Sup: 1.3412, 1.3380, 1.3364, 1.3305
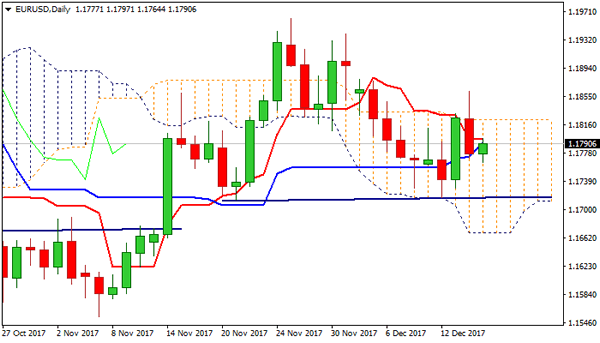
Technical Outlook: EURUSD – Bearish N/T Bias While The Price Stays Within Daily Cloud
The Euro bounced to1.1800 zone after hitting new low at 1.1764 in Friday's Asian session trading. Bearish close on Thursday left long red candle with long upper shadow which weighs on near-term action. Euro's near-term sentiment remains fragile after Fed's decision on Wednesday boosted the greenback and the ECB kept monetary policy on hold on Thursday's meeting, but warned about persisting low inflation. Fresh concerns over US tax reform pressured dollar on Friday and may delay Euro's near-term bears, but downside risk is expected to remain in play while the price holds in the daily cloud. Recovery attempts should be ideally caped at 1.1800 resistance zone to keep key barriers at 1.1819/23 (20SMA/daily cloud top) intact. On the downside, 55 SMA which lies at 1.1759 (just under session low) marks initial support, ahead of pivots at 1.1718/09 (daily H&S pattern neckline/Fibo 61.8% of 1.1553/1.1961 rally) break of which would confirm bearish continuation for attack at daily cloud base at 1.1669.
Res: 1.1800, 1.1823, 1.1862, 1.1878
Sup: 1.1759, 1.1718, 1.1709, 1.1669
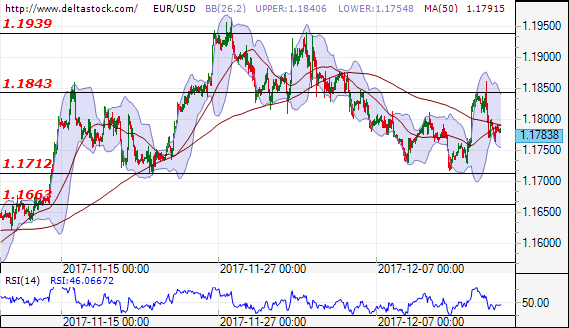
Forex Technical Analysis: EUR/USD, USD/JPY, GBP/USD
EUR/USD
Current level - 1.1783
The outlook is negative for test of the support level at 1.1712. Successful breakthrough of that level may lead to the next support level at 1.1663. In positive direction after a breakthrough of the resistance level at 1.1843, we may expect test of the next resistance at 1.1939.
| Resistance | Support | ||
| intraday | intraweek | intraday | intraweek |
| 1.1843 | 1.1939 | 1.1712 | 1.1690 |
| 1.1939 | 1.2090 | 1.1712 | 1.1550 |
USD/JPY
Current level - 112.21
The outlook is negative again for test of the support level at 111.95 and after that at 110.80.
| Resistance | Support | ||
| intraday | intraweek | intraday | intraweek |
| 113.13 | 113.90 | 111.90 | 109.50 |
| 113.90 | 114.50 | 110.80 | 107.30 |
GBP/USD
Current level - 1.3441
The forecast is positive for test of the resistance level at 1.3550. In negative direction only a breakthrough of the support at 1.3314, may lead to test of the next support at 1.3219.
| Resistance | Support | ||
| intraday | intraweek | intraday | intraweek |
| 1.3550 | 1.3660 | 1.3310 | 1.3220 |
| 1.3550 | 1.3660 | 1.3220 | 1.3070 |
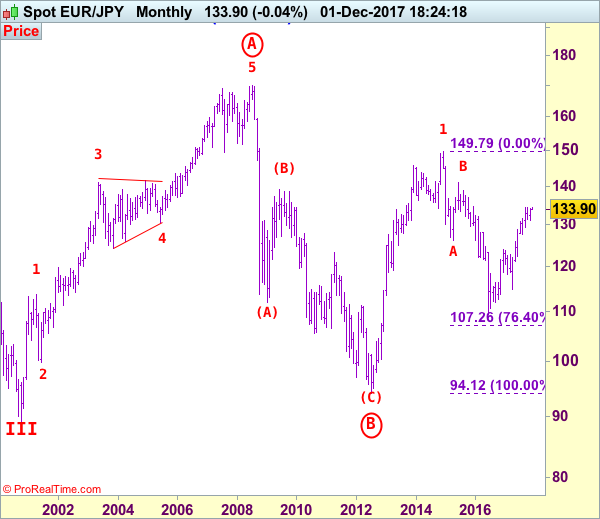
EUR/JPY Elliott Wave Analysis
EUR/JPY - 133.28
Despite this week’s initial marginal gain to 133.89, renewed selling interest emerged there and the pair has dropped sharply from there, price broke below previous support at 132.26, dampening our bullishness and signaling the retreat from 134.38 is still in progress, hence weakness to 131.72 support cannot be ruled out, however, as broad outlook remains consolidative, reckon downside would be limited and support at 131.17 should remain intact, bring another rebound later. Only below said support at 132.26 would abort and signal the rebound from 131.17 has ended, bring weakness to support at 131.72, then towards 131.17. Once this support is penetrated, this would suggest a temporary top is formed, bring retracement of recent rise to previous support at 130.62, then towards 130.00 later.
The daily chart is labeled as attached, early selloff from 169.97 (July 2008) to 112.08 is wave (A) of B instead of end of entire wave B and then the rebound from there to 139.26 is wave (B), hence, wave (C) has possibly ended at 94.12 with a diagonal triangle as labeled in the daily chart, hence upside bias is seen for further gain. Recent rally above indicated retracement level at 116.69 (50% Fibonacci retracement of the intermediate fall from 139.26-94.12) adds credence to this view and signal major reversal has commenced but first leg of this wave C has possibly ended at 149.79, hence wave 2 has commenced with wave A ended at 126.09, followed by wave B at 141.06, wave C commenced and could have ended at 109.49, indicated upside targets at 126.00 and 130.00 had been met and further gain to 135.00 would follow.
On the upside, whilst recovery to 132.50-60 cannot be ruled out, previous support at 132.85 should turn into resistance and limit euro’s upside, bring another decline later. A daily close above this level would prolong consolidation and bring another rebound to 133.40-50 but said resistance at 133.89 (this week’s high) should remain intact. Only a break above this level would revive bullishness and bring test of 134.38-50 resistance area, once this barrier is penetrated, this would confirm medium term upmove has resumed and extend gain to 135.00, and then 135.50-60.
Recommendation: Stand aside for this week.
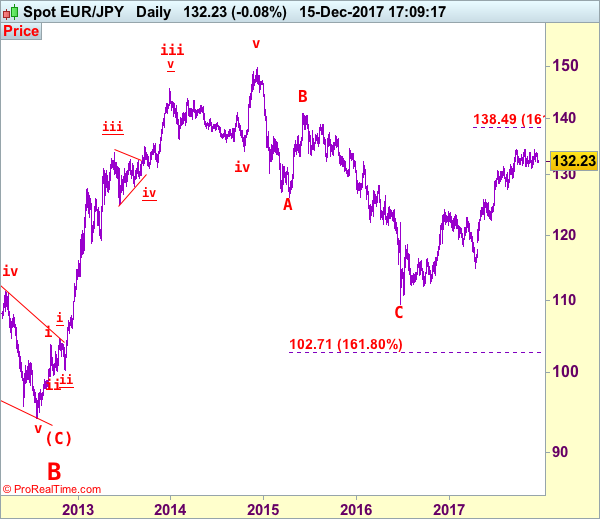
To re-cap the corrective upmove from the record low of 88.93 (18 Oct 2000), the wave A from there is subdivided as: 1:88.93-113.72, 2:99.88 (1 Jun 2001), 3:140.91 (30 May 2003), 4:124.17 (10 Nov 2003) and 5 ended at record high of 169.97 (21 Jul 2008). The brief but sharp selloff to 112.08 is viewed as a-b-c x a-b-c wave (A) of B. The subsequent rebound to 139.26 is (B) of B and (C) of (B) has possibly ended at 94.12 and in any case price should stay well above previous chart support at 88.93, bring rally in larger degree wave C towards 150.00.