
Sample Category Title
AUD/USD Daily Outlook
Daily Pivots: (S1) 0.7494; (P) 0.7514; (R1) 0.7526; More...
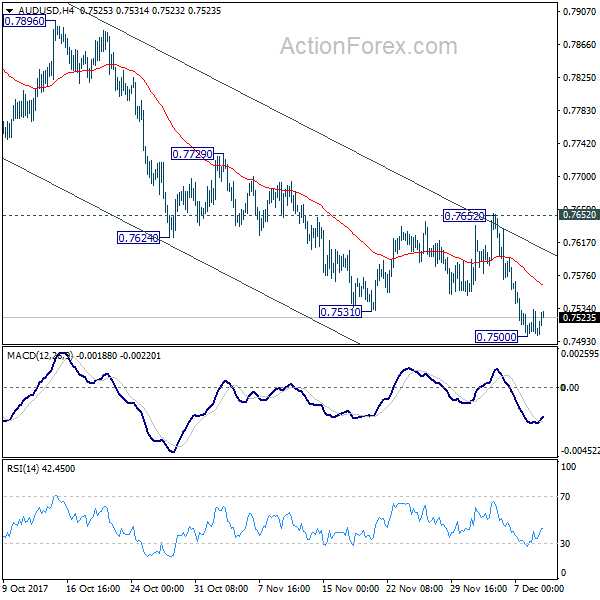
With 4 hour MACD crossed above signal line, a temporary low is formed at 0.7500. Intraday bias is turned neutral for some consolidations. Upside of recovery should be limited below 0.7652 resistance to bring fall resumption. Break of 0.7500 will extend the fall from 0.8124 and target 0.7322/8 cluster support next.
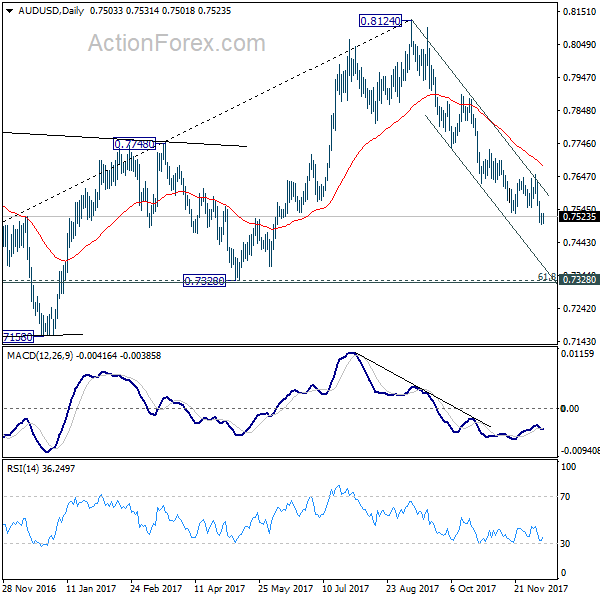
In the bigger picture, corrective rise from 0.6826 medium term bottom is likely completed at 0.8124, after hitting 55 month EMA (now at 0.8029). Decisive break of 0.7328 key cluster support (61.8% retracement 0.6826 to 0.8124 at 0.7322) will confirm. And in that case, long term down trend from 1.1079 (2011 high) will likely be resuming. Break of 0.6826 will target 61.8% projection of 1.1079 to 0.6826 from 0.8124 at 0.5496. This will now be the favored case as long as 0.7732 near term resistance holds.
USD/CAD Daily Outlook
Daily Pivots: (S1) 1.2804; (P) 1.2842; (R1) 1.2880; More....
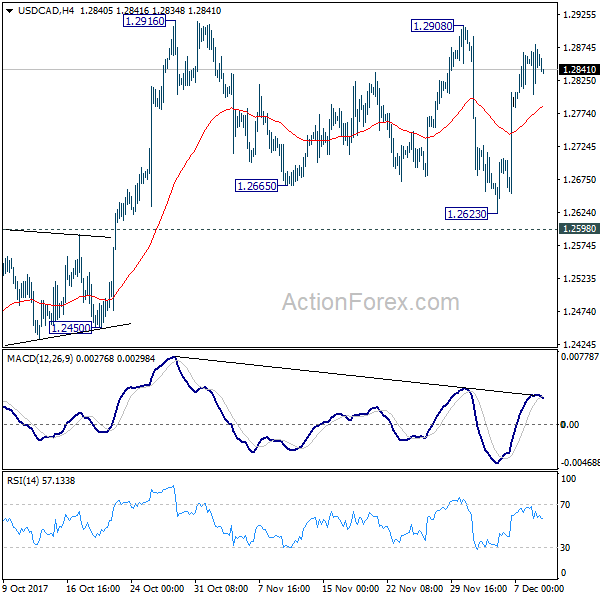
Intraday bias in USD/CAD remains neutral as it lost momentum ahead of 1.2916 key near term resistance. On the upside, firm break of 1.2916 will resume whole rally from 1.2061 and target 1.3065 medium term fibonacci level next. In case of another fall, we'd expect strong support from 1.2598 to contain downside and bring rebound. However, sustained break of 1.2598 will argue that rebound from 1.2061 has completed after hitting 55 week EMA (now at 1.2888). Near term outlook will be turned bearish in this case.
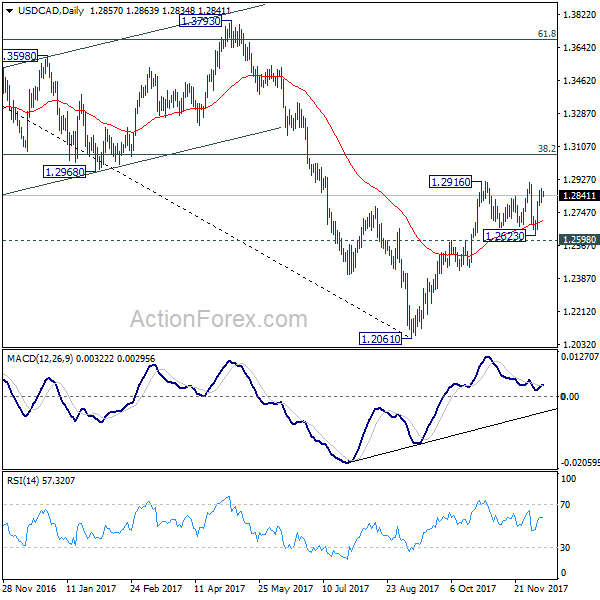
In the bigger picture, USD/CAD should have defended 50% retracement of 0.9406 (2011 low) to 1.4689 (2016 high) at 1.2048. And with 1.2048 intact, we'd favor the case that fall from 1.4689 is a correction. Rise from 1.2061 medium term bottom should now target 38.2% retracement of 1.4689 to 1.2061 at 1.3065. Firm break there will target 1.3793 key resistance next (61.8% retracement at 1.3685). We'll now hold on to this bullish view as long as 1.2450 support holds.
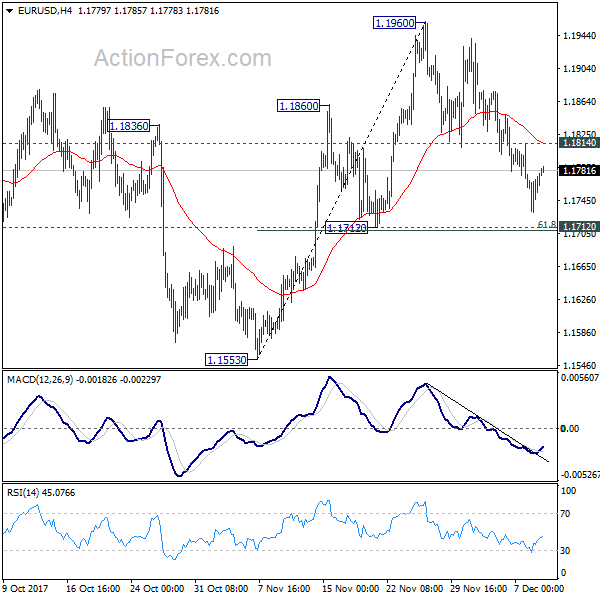
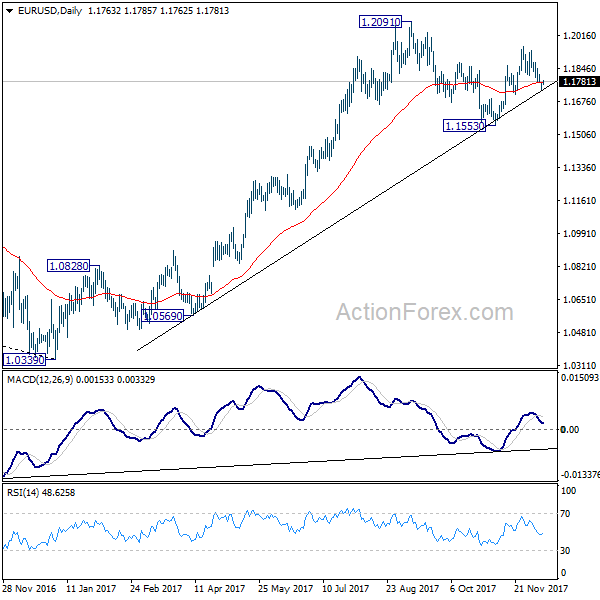
EUR/USD Daily Outlook
Daily Pivots: (S1) 1.1739; (P) 1.1758 (R1) 1.1786; More....
Intraday bias in EUR/USD is neutral for the moment with focus on 1.1712 cluster support (61.8% retracement of 1.1553 to 1.1960 at 1.1708). Decisive break there will indicate that rebound from 1.1553 has completed at 1.1960. In that case, deeper fall would be seen to 1.1553 and possibly below to extend the decline from 1.2091. Meanwhile, with 1.1712 support intact, break of 1.1814 minor resistance will retain near term bullishness. And in that case, intraday bias will be turned back to the upside for 1.1960. Break will target 1.2091 high.
In the bigger picture, rise from 1.0339 medium term bottom is seen as a corrective move for the moment. Therefore, in case of another rally, we'd be expect 38.2% retracement of 1.6039 (2008 high) to 1.0339 (2017 low) at 1.2516 to limit upside and bring reversal. Meanwhile, sustained trading below 55 week EMA (now at 1.1423) will suggest that such medium term rebound is completed and could then bring retest of 1.0339 low.
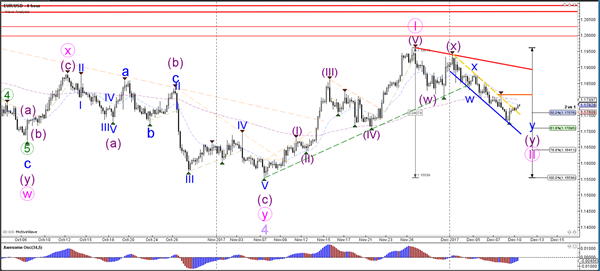
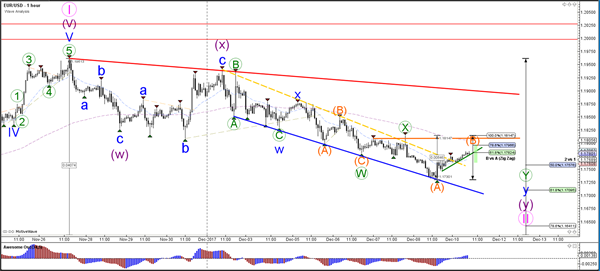
Daily Wave Analysis: EUR/USD Break Of Bearish Channel Signals End Of Wave 2
Currency pair EUR/USD
The EUR/USD broke above the resistance of the bearish trend channel (dotted yellow) but still has horizontal resistance (orange) nearby. A bearish bounce at that resistance could indicate a continuation of the wave 1-2 (pink) whereas a bullish breakout could indicate that wave 2 (pink) is completed.
The EUR/USD has bounced at the 50% Fibonacci level of wave 2 vs 1 but is now approaching a potential resistance zone with the Fibonacci levels of wave B vs A (orange).
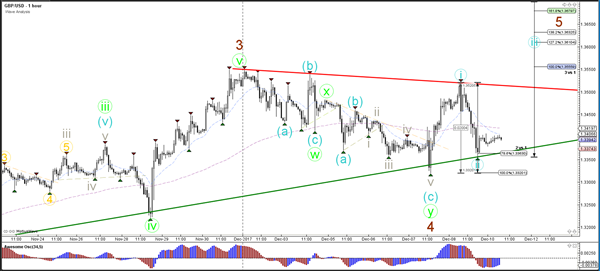
Currency pair GBP/USD
The GBP/USD bounced at the Fibonacci levels of wave 4 vs 3 (brown) and the support trend line (green) but was not able to break above the resistance trend line (red). A break below the current support (green) could still belong to a wave 4 (brown) as long as price does not break below the top of wave 1 (blue line).The GBP/USD could be building a wave 1-2 (blue) if price stays above the 100% Fibonacci level of wave 2 vs 1.
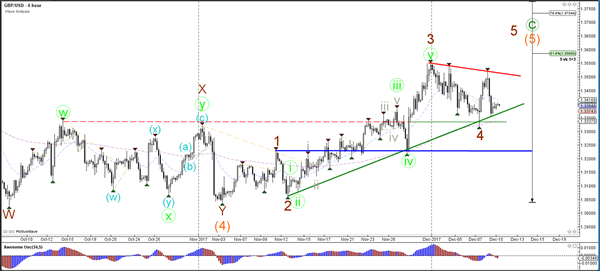
The GBP/USD could be building a wave 1-2 (blue) if price stays above the 100% Fibonacci level of wave 2 vs 1.
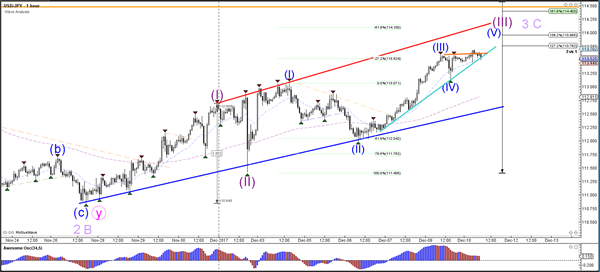
Currency pair USD/JPY
The USD/JPY broke above the resistance trend line (dotted orange) and is building bullish momentum towards the wave 3 (purple) Fibonacci targets.
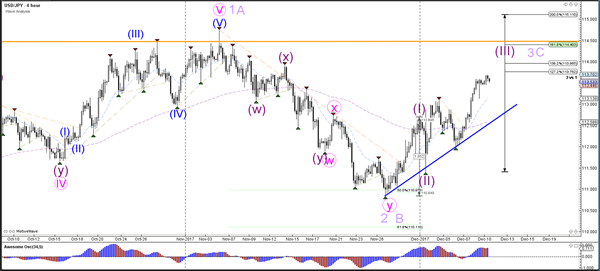
The USD/JPY showed a bullish bounce as a part of a potential wave 4 (blue). Price could break above the resistance (orange) as part of the uptrend continuation or challenge the bottom of wave 4 (blue).
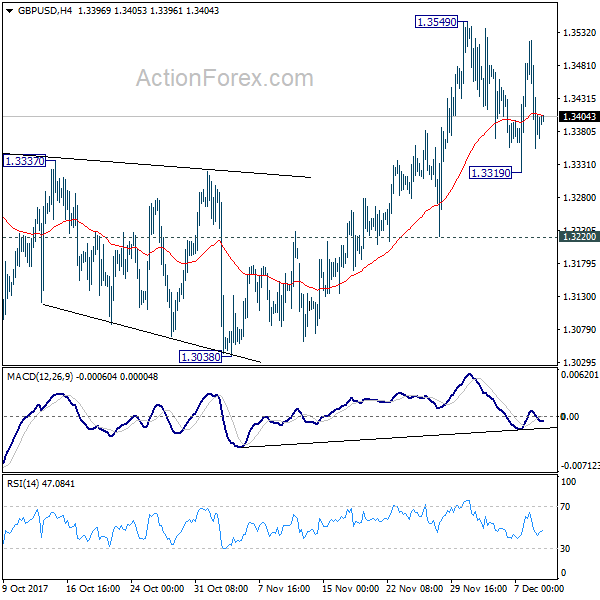
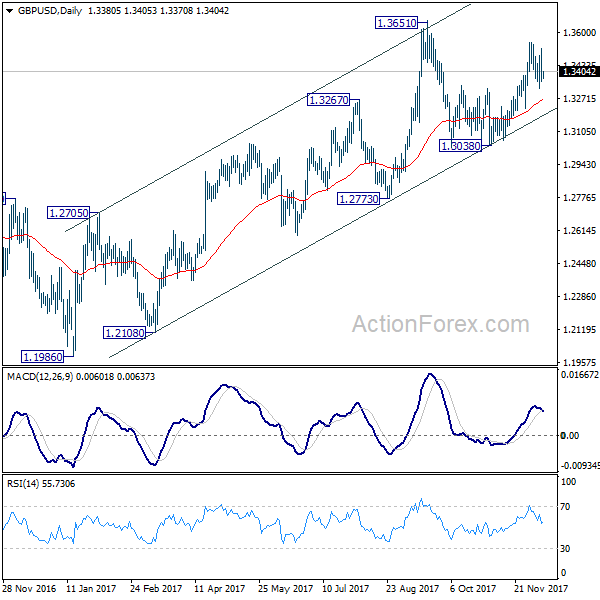
GBP/USD Daily Outlook
Daily Pivots: (S1) 1.3314; (P) 1.3417; (R1) 1.3480; More....
Intraday bias in GBP/USD remains neutral for the moment. We'll slightly favor another rise as long as 1.3220 support holds. Break of 1.3549 will target 1.3651 high next. However, firm break of 1.3220 will turn near term outlook bearish for 1.3038 key support level.
In the bigger picture, while the medium term rebound from 1.1946 low was strong, it's limited below 1.3835 key support turned resistance. As long as 1.3835 holds, we'd view such rebound as a correction. That is, we'd expect another leg in the long term down trend through 1.1946 low. However, sustained break of 1.3835 should at least send GBP/USD to 38.2% retracement of 2.1161 (2007 high) to 1.1946 (2016 low) at 1.5466.
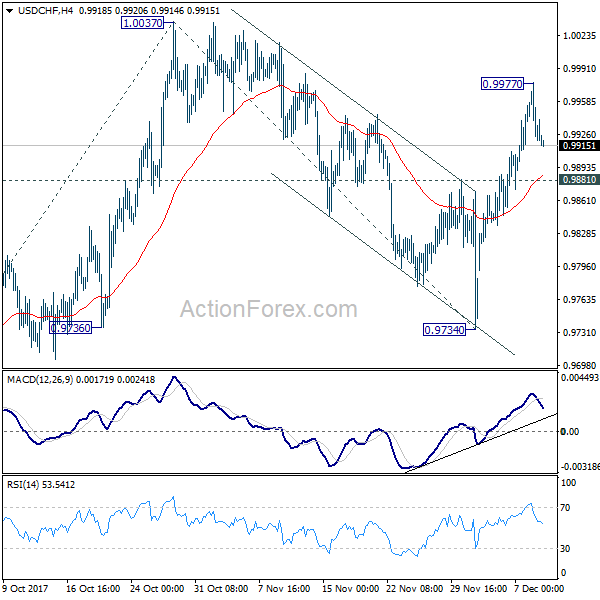
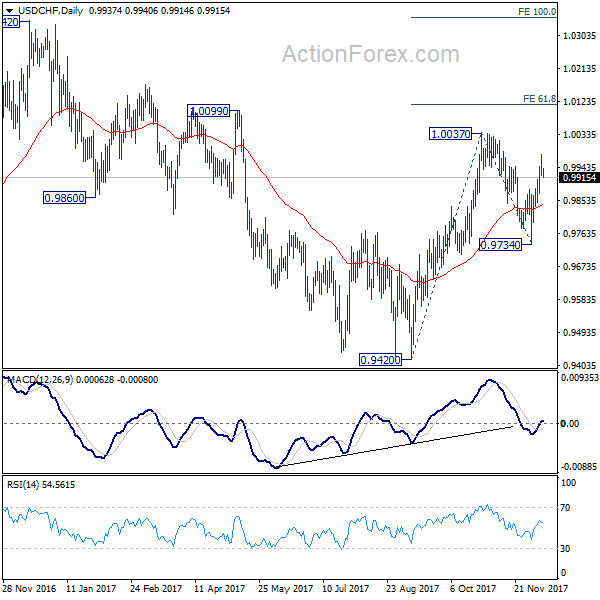
USD/CHF Daily Outlook
Daily Pivots: (S1) 0.9901; (P) 0.9939; (R1) 0.9958; More....
Intraday bias in USD/CHF remains neutral for consolidation below 0.9977 temporary top. As noted before, current development argues that correction from 1.0037 has completed at 0.9734 already. Also, rise from 0.9420 might be resuming. On the upside, above 0.9977 will target 1.0037 high first. Break will extend the rise from 0.9420 to 61.8% projection of 0.9420 to 0.9734 from 1.0047 at 1.0115 next. Nevertheless, firm break of 0.9881 support will dampen this immediate bullish case and turn bias to the downside for 0.9734 instead.
In the bigger picture, range trading continues between 0.9420/1.0342. At this point, 0.9420 appears to be a strong support level. Therefore, in case of decline attempt, we don't expect a firm break of this level. Nonetheless, strong break of 1.0342 is also needed to confirm upside momentum. Otherwise, medium term outlook will stay neutral.
Aussie Trading On A Stronger Footing This Morning
For the 24 hours to 23:00 GMT, the AUD declined 0.07% against the USD and closed at 0.7507 on Friday.
LME Copper prices rose 0.1% or $8.0/MT to $6538.5/MT. Aluminium prices declined 0.1% or $2.0/MT to $1992.0/MT.
In the Asian session, at GMT0400, the pair is trading at 0.7521, with the AUD trading 0.19% higher against the USD from Friday’s close.
Over the weekend, data revealed that in China, Australia’s largest trading partner, the consumer price index (CPI) rose 1.7% on a yearly basis in November, falling short of market expectations for a rise of 1.8% and compared to a gain of 1.9% in the prior month. Moreover, the nation’s producer price index (PPI) climbed 5.8% on an annual basis in November, meeting market consensus and compared to a rise of 6.9% in the prior month.
The pair is expected to find support at 0.7504, and a fall through could take it to the next support level of 0.7487. The pair is expected to find its first resistance at 0.7536, and a rise through could take it to the next resistance level of 0.7551.
Moving ahead, Australia’s NAB business confidence index for November, scheduled to release overnight, will be on investors’ radar.
The currency pair is trading above its 20 Hr moving average and showing convergence with its 50 Hr moving average.

Germany’s Trade Surplus Sharply Narrowed In October
For the 24 hours to 23:00 GMT, the EUR declined 0.07% against the USD and closed at 1.1768 on Friday, after Germany's seasonally adjusted trade surplus narrowed more-than-expected to €18.9 billion in October, as exports recorded a surprise fall, while imports jumped. Markets had anticipated the nation to post a trade surplus of €21.9 billion, compared to a surplus of €24.1 billion in the previous month.
The US Dollar advanced against its key counterparts on Friday, after the latest jobs data boosted optimism over the health of the US labour market. However, gains were capped as investors were disappointed with weak wage growth data.
Non-farm payrolls in the US rose more-than-anticipated by 228.0K in November, suggesting that the nation's labour market continues to develop in a positive way and cementing expectations of a Federal Reserve (Fed) interest rate hike later this week. In the preceding month, non-farm payrolls had registered a revised increase of 244.0K, while investors had envisaged for a rise of 195.0K. Additionally, the nation's unemployment rate remained unchanged at a 17-year low of 4.1% in November, meeting market expectations.
However, the nation's average hourly earnings of all employees rebounded less-than-expected by 0.2% MoM in November, thus hinting that inflationary pressures will likely remain subdued. Average hourly earnings of all employees recorded a revised drop of 0.1% in the previous month, while markets were expecting for a gain of 0.3%.
Other data indicated that the flash Reuters/Michigan consumer sentiment index in the US registered an unexpected fall to a level of 96.8 in December, declining to a three-month low and confounding market expectations of an advance to a level of 99.0. In the previous month, the index had registered a reading of 98.5.
In the Asian session, at GMT0400, the pair is trading at 1.1780, with the EUR trading 0.1% higher against the USD from Friday's close.
The pair is expected to find support at 1.1745, and a fall through could take it to the next support level of 1.1711. The pair is expected to find its first resistance at 1.1799, and a rise through could take it to the next resistance level of 1.1819.
Amid a lack of any key economic releases in the Euro-zone today, investors will look forward to the US JOLTs job openings data for October, due to release later in the day.
The currency pair is trading above its 20 Hr moving average and showing convergence with its 50 Hr moving average.

UK And The EU Clinched A Brexit Deal
For the 24 hours to 23:00 GMT, the GBP declined 0.63% against the USD and closed at 1.3395 on Friday.
The Pound surged earlier in the session, on news that the UK and the European Union (EU), after weeks of negotiations, have reached a Brexit deal that allows arduous negotiations to move to the next stage.
On the macro front, UK's manufacturing production surprisingly climbed 0.1% on a monthly basis in October, against market expectations for a flat reading. In the previous month, manufacturing production had recorded a rise of 0.7%. Meanwhile, the nation's industrial production remained flat on a monthly basis in October, meeting market expectations. Industrial production had recorded a rise of 0.7% in the previous month. On the other hand, the nation's construction output unexpectedly eased 1.7% MoM in October, dipping by the most since March 2016, highlighting that the sector, increasingly bogged-down by Brexit worries, is losing momentum. Markets had anticipated construction output to rise 0.1%, after recording a fall of 1.6% in the previous month.
Another set of data indicated that the NIESR, leading think tanker, estimated that UK's gross domestic product (GDP) climbed more-than-anticipated by 0.5% in the September-November period, following a similar rise in the prior month. Meanwhile, the nation's total trade deficit slightly widened to £1.41 billion in October, while investors had envisaged for a deficit of £3.0 billion. In the previous month, the nation had posted a revised total trade deficit of £1.14 billion.
In the Asian session, at GMT0400, the pair is trading at 1.3397, with the GBP trading marginally higher against the USD from Friday's close.
Overnight data revealed that UK's Rightmove house price index eased 2.6% MoM in December. The index had registered a drop of 0.8% in the previous month.
The pair is expected to find support at 1.3329, and a fall through could take it to the next support level of 1.3260. The pair is expected to find its first resistance at 1.3493, and a rise through could take it to the next resistance level of 1.3588.
The currency pair is trading below its 20 Hr and 50 Hr moving averages.

Japan’s Large Manufacturers’ Mood Improved Less-Than-Expected In 4Q 2017
For the 24 hours to 23:00 GMT, the USD rose 0.37% against the JPY and closed at 113.51 on Friday.
In the Asian session, at GMT0400, the pair is trading at 113.58, with the USD trading 0.06% higher against the JPY from Friday's close.
Overnight data indicated that Japan's business survey index (BSI) of large manufacturing industries advanced less-than-expected by 9.7% on a quarterly basis in the fourth quarter of 2017, compared to market expectations for a rise of 10.0%. The index had recorded a rise of 9.4% in the previous quarter.
The pair is expected to find support at 113.24, and a fall through could take it to the next support level of 112.91. The pair is expected to find its first resistance at 113.8, and a rise through could take it to the next resistance level of 114.03.
Going ahead, Japan's tertiary industry index for October, scheduled to release tomorrow, will be eyed by traders.
The currency pair is showing convergence with its 20 Hr moving average and trading above its 50 Hr moving average.
