Sample Category Title
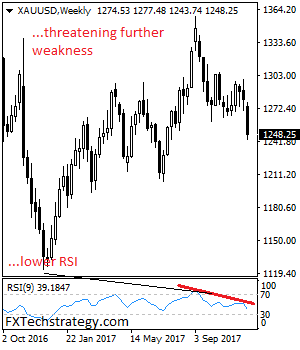
GOLD – Risk Remains To The Downside
GOLD - The commodity looks to extend its downside pressure as it continues to retain its downside pressure. On the downside, support comes in at the 1,240.00 level where a break will turn attention to the 1,230.00 level. Further down, a cut through here will open the door for a move lower towards the 1,220.00 level. Below here if seen could trigger further downside pressure towards the 1,210.00 level. Conversely, resistance resides at the 1,260.00 level where a break will aim at the 1,270.00 level. A turn above there will expose the 1,280.00 level. Further out, resistance stands at the 1,290.00 level. All in all, GOLD looks to weaken further on correction.
ECB Preview: On Autopilot for Now
Summary: ECB on autopilot for now
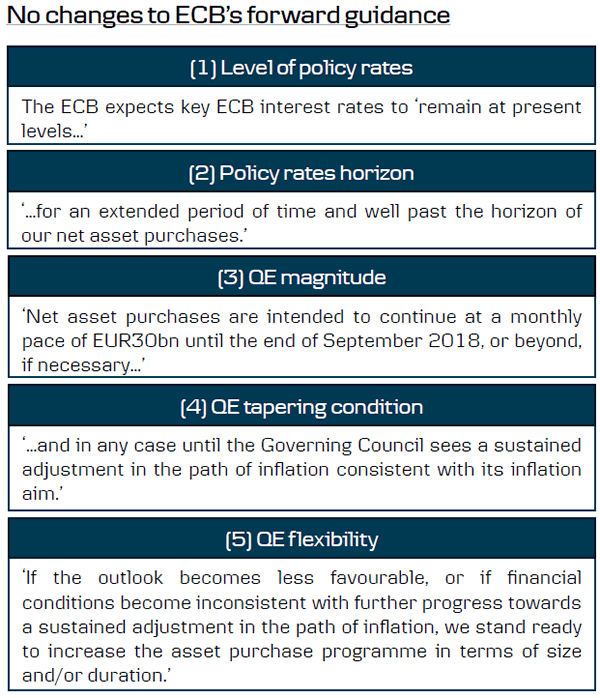
Following the decision to extend the QE programme for another nine months in 2018, we do not expect the ECB to make any changes to its policy stance at its upcoming meeting. Instead, we think policymakers will put off any substantial discussion about the next move or changes to the forward guidance until well into 2018.
Activity Indicators have remained strong and we expect the ECB to revise its growth and inflation forecasts upward in light of the ongoing strong economic momentum.
Consensus seems to be growing in the Governing Council that the October QE extension was the last one, as the ECB is increasingly shifting towards a more holistic view of the economy and inflation. Based on this, we think it is important to watch developments in 'supercore' inflation.
Other topics that could come up during the Q&A include the recent volatility in the Eonia fixing and the repo market over year end.
We think it is likely that the corporate bond and covered bond purchase programmes' share of QE will be increased from January 2018.
In our view, it is too early for the ECB to spur the next 'wave of normalisation' pricing just yet, so we project EUR/USD with in a 1.17-1.20 range near term.
We expect the trend for tighter spreads and flatter curves in the euro fixed income market to continue.
FOMC Preview: Third Hike and Unchanged Dot Signals
- We expect the Fed to hike the target range to 1.25-1.50% at next week's meeting and to continue signalling three hikes in 2018 and 2019.
- The tax reform is moving closer, but we do not expect the Fed to change its overall strategy of waiting for its approval before taking it fully into account in the projections.
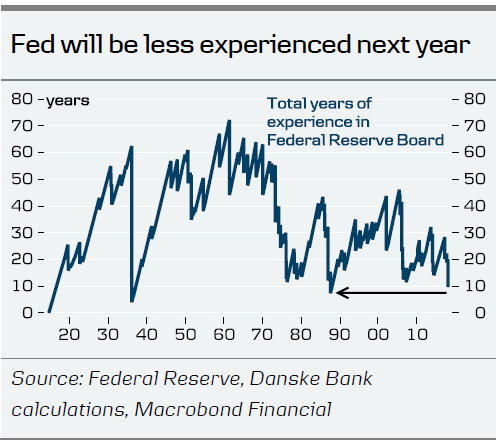
- Jerome Powell is going to stick to the current policy strategy but the FOMC will be less experienced next year, which may be a problem if the economy is hit by a shock.
- We expect the US yield curve to flatten further next year, as the short end is pushed up by Fed hikes and the long run is held down by (among other things) a low R-star.
- We see EUR/USD staying roughly within the 1.17-1.20 range ahead of year-end but still call for a higher EUR/USD next year.
Fed is set to hike and keep dots unchanged
We expect the Fed to raise the Fed funds target range to 1.25-1.50% at next week's meeting, in line with market pricing and other analysts. As a rate hike is fully priced in, it is by itself not a market mover and focus is on the updated projections and Janet Yellen's press conference for more information about the director for next year.
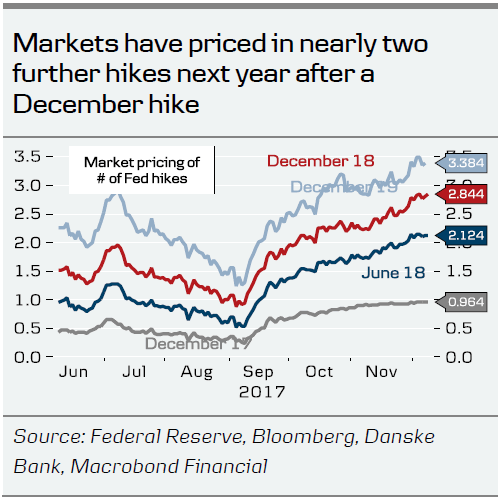
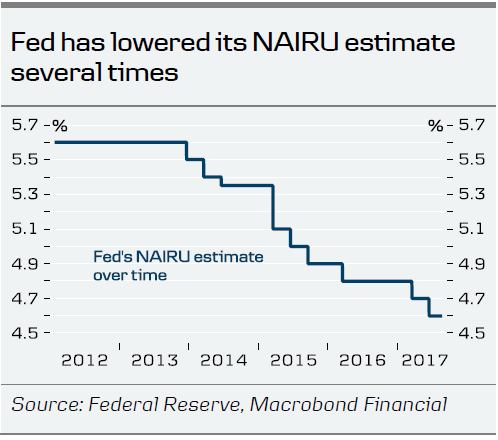
Right now, it seems like the Fed is on autopilot although it has become slightly more concerned about the persistent low inflation. Hence, we do not expect any major changes to the 'dots' for next year, which are likely to continue signalling three hikes. We also believe the 2019 median dot to be unchanged at three additional hikes although this is more uncertain. Usually, the market reaction to changes to dots further out is more limited than changes to the near term. The projections for inflation, growth and unemployment are usually less important, which we expect to be broadly unchanged, except for unemployment, which will be revised down, as the current rate of 4.1% is what the FOMC thought would be the level by year-end 2018. We may see a further decline in the Fed's NAIRU estimate, which is currently 4.6%.
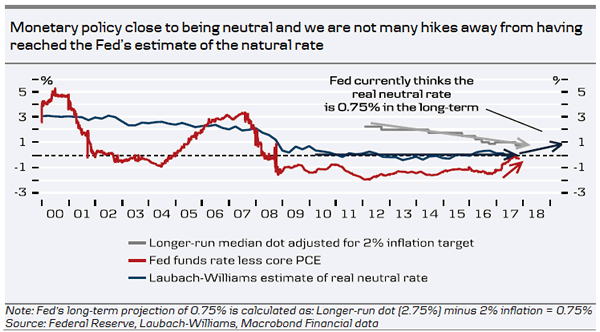
Another question for next year is whether we will see further downward revisions to the longer-run dot (which is the Fed's median estimate of the natural rate). Yellen has indicated she believes monetary policy is not far from being neutral at the moment and that further hikes are dependent on an increase in the natural rate driven by higher trend growth. As we are not many hikes away from the current level of the longer-run dot of 2.75%, the theme about the end of the Fed's hiking cycle becomes increasingly important. Right now, the markets are buying into the idea of further hikes next year (now almost two hikes are priced in) but markets expect the hiking cycle to end earlier than the Fed indicates currently.
Also, the Fed's view on the tax reform may attract attention. So far, the Fed's strategy has been to wait for the tax reform to pass Congress before taking it into account (although a few FOMC members have already) but Fed Chair Yellen is likely to be asked about it at the ensuing press conference.
Powell to stick to current policy strategy near term
In terms of the dots, it is of course important to stress that uncertainty about monetary policy next year is higher than usual as the Fed will undergo big changes in terms of voting FOMC members. In our view, Fed Chair nominee Powell's approval in the Senate will be 'plain sailing' but there are still four empty seats in the Board of Governors (Trump has nominated one more, Marvin Goodfriend, just recently). Also, voting rights among regional Fed presidents will change in the New Year.
Powell will most likely stick to the Fed's existing tightening strategy by continuing the gradual hiking cycle. Therefore, short term, the chances are that the Fed will be governed much like under Yellen. What will be more interesting will be how Powell will react should the economy or financial markets be hit by a shock in either direction. Powell is less qualified than Yellen (in terms of academic credentials) and the Fed will be less experienced (Yellen, Tarullo and Fischer had a lot of experience. For more information on Fed composition, see FX Edge - inexperienced Fed to be a drag on USD, 30 November).
We expect the US yield curve to flatten further
In the fixed income market, the big market theme this year has been the continued flattening of the US yield curve, where for example the 2Y10Y Treasury-curve has flattened more than 70bp in 2017 despite the Fed hiking 'three times' after the December meeting. We argue that two of the reasons have been the consistent focus on R-star and the downward revisions to longer-run dots. If we see the dots unchanged for 2018/19 and a further downward revision to the longer-run dot, we would expect the flattening to accelerate. We are positioned for a 2Y10Y 1Y forward flattener in our Danske Bank 2018 FI Top Trades, 6 December. See also FI Strategy:'Bond yield conundrum vol. 2, 30 November.
December hike will not move USD much
We do not think the Fed will move the USD much with the December hike, albeit the kneejerk reaction could be for a slightly lower EUR/USD if the dots remain unchanged. We see EUR/USD staying roughly within the 1.17-1.20 range ahead of year-end. The Fed's balance sheet reduction (aka tighter USD liquidity) and/or a positive surprise on the US tax reform could drag the cross slightly lower in Q1, but for 2018 as a whole, we stress that any USD support from Fed hikes will be likely to be dominated by other (EUR-positive) factors. See FX Top Trades 2018, 6 December.
EUR/USD Weekly Outlook
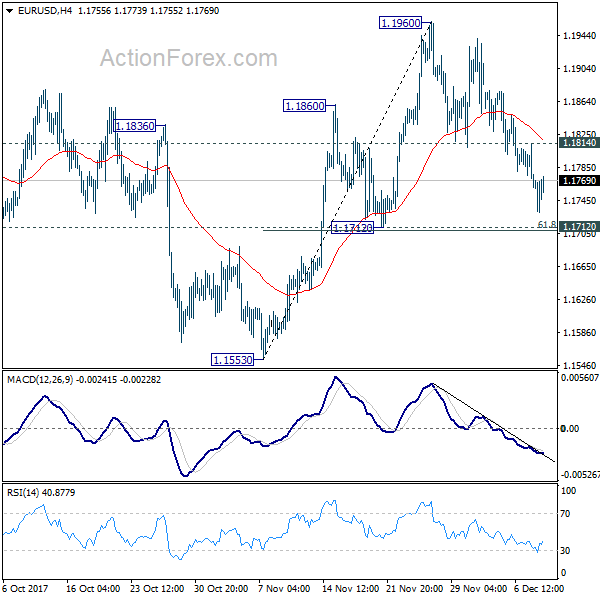
EUR/USD's decline from 1.1960 extended lower last week but downside was contained above 1.1712 cluster support so far (61.8% retracement of 1.1553 to 1.1960 at 1.1708). Focus will stays on 1.1708/12 initially this week. Decisive break there will indicate that rebound from 1.1553 has completed at 1.1960. In that case, deeper fall would be seen to 1.1553 and possibly below to extend the decline from 1.2091. Meanwhile, with 1.1712 support intact, break of 1.1814 minor resistance will retain near term bullishness. And in that case, intraday bias will be turned back to the upside for 1.1960. Break will target 1.2091 high.
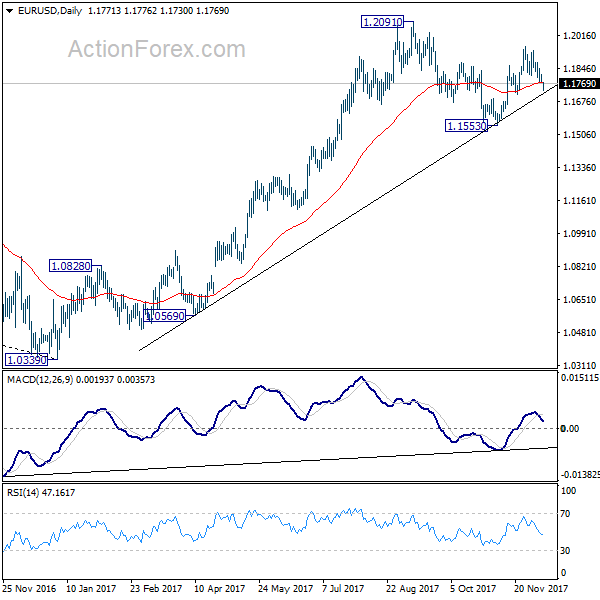
In the bigger picture, rise from 1.0339 medium term bottom is seen as a corrective move for the moment. Therefore, in case of another rally, we'd be expect 38.2% retracement of 1.6039 (2008 high) to 1.0339 (2017 low) at 1.2516 to limit upside and bring reversal. Meanwhile, sustained trading below 55 week EMA (now at 1.1423) will suggest that such medium term rebound is completed and could then bring retest of 1.0339 low.
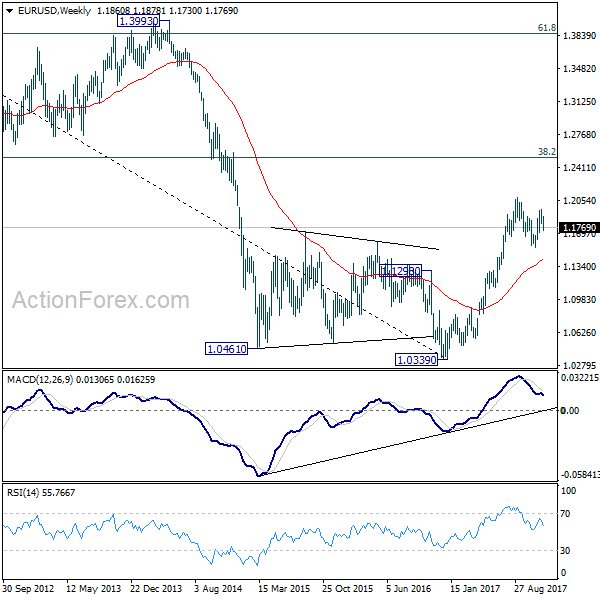
In the long term picture, 1.0339 is now seen as an important bottom as the down trend from 1.6039 (2008 high) could have completed. It's still early to decide whether price action form 1.0339 is developing into a corrective or impulsive move. On the upside, strong resistance could be seen from 38.2% retracement of 1.6039 to 1.0339 at 1.2516. On the downside, we're not anticipating a break of 1.0339 in medium term.
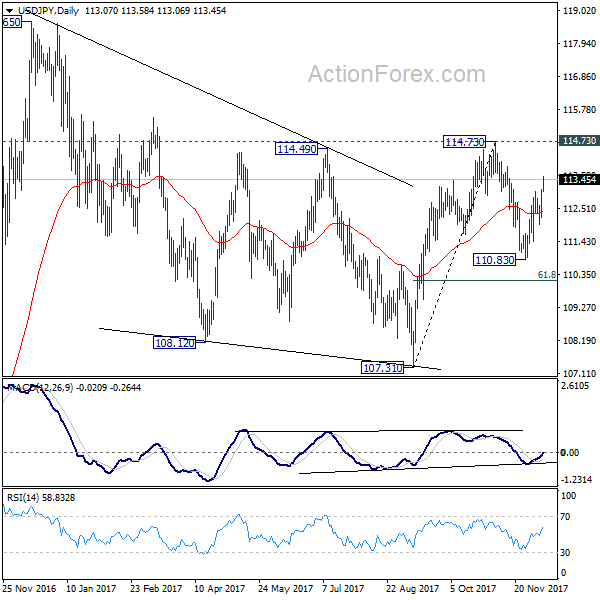
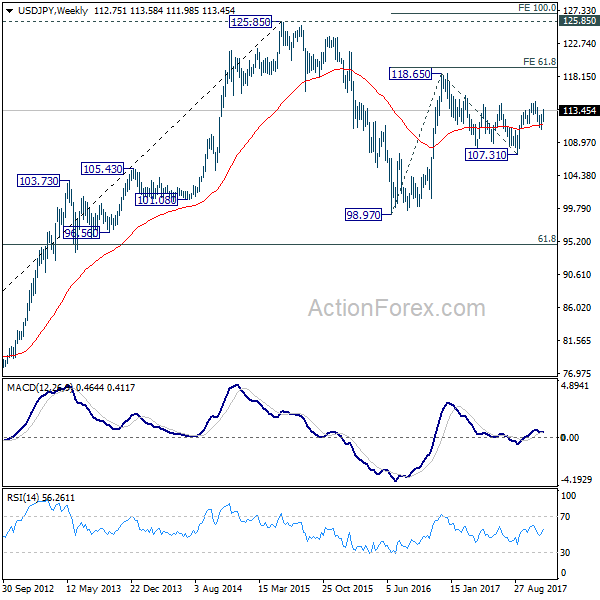
USD/JPY Weekly Outlook
USD/JPY's rally last week suggests that pull back from 114.73 has completed at 110.83 already. Initial bias stays on the upside this week for 114.73 key resistance. Decisive break there will resume whole rise form 107.31. More importantly, that will confirm completion of medium term correction from 118.65 at 107.31. In that case, retest of 118.65 should be seen next. However, break of 111.98 will extend the correction from 114.73 with another fall, possibly to 61.8% retracement of 107.31 to 114.73 at 110.14 before completion.
In the bigger picture, we're holding on to the view that correction from 118.65 is completed a 107.31. And medium term rise from 98.97 (2016 low) is resuming. Sustained break of 114.73 should affirm our view and send USD/JPY through 118.65. However, break of 107.31 will dampen this will and extend the medium term fall back to 98.97 low.
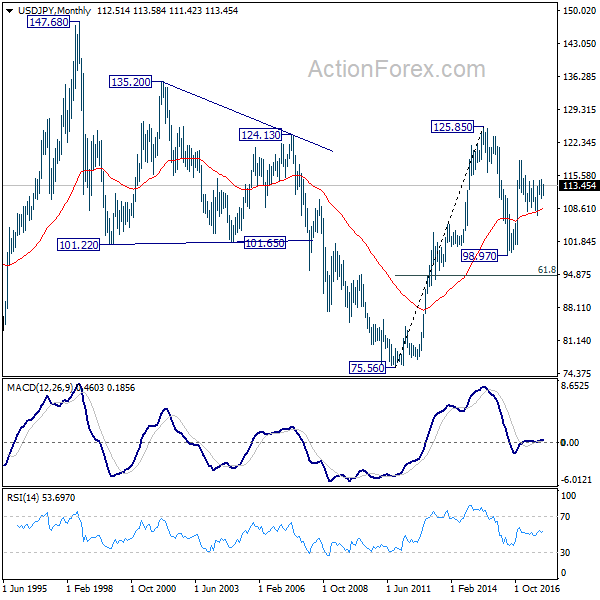
In the long term picture, the rise from 75.56 (2011 low) long term bottom to 125.85 top is viewed as an impulsive move, no change in this view. Price actions from 125.85 are seen as a corrective move which could still extend. In case of deeper fall, downside should be contained by 61.8% retracement of 75.56 to 125.85 at 94.77. Up trend from 75.56 is expected to resume at a later stage for above 135.20/147.68 resistance zone.

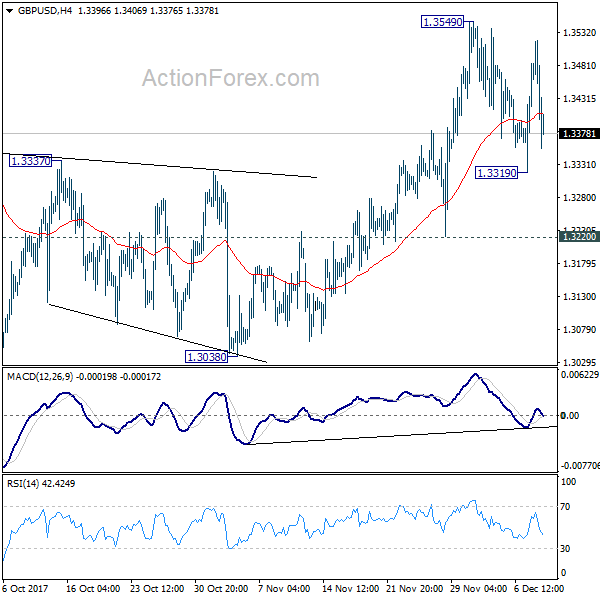
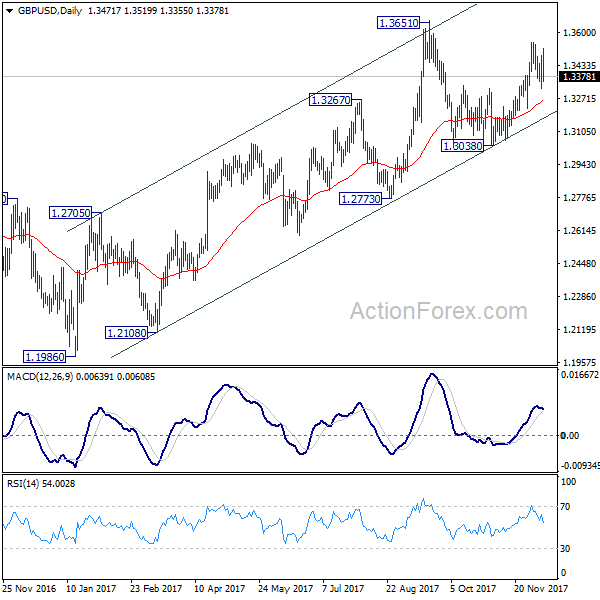
GBP/USD Weekly Outlook
GBP/USD dipped to 1.3319 last week but quickly recovered. Nonetheless as upside is limited below 1.3549 so far, initial bias remains neutral tis week first. We'll slightly favor another rise as long as 1.3220 support holds. Break of 1.3549 will target 1.3651 high next. However, firm break of 1.3220 will turn near term outlook bearish for 1.3038 key support level.
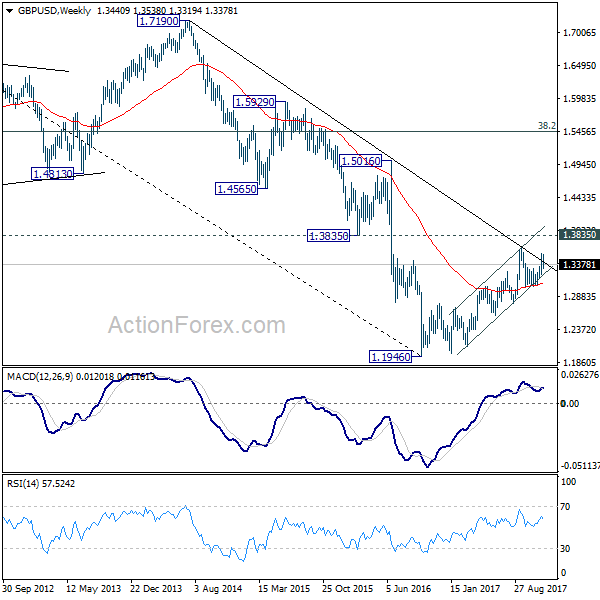
In the bigger picture, while the medium term rebound from 1.1946 low was strong, it's limited below 1.3835 key support turned resistance. As long as 1.3835 holds, we'd view such rebound as a correction. That is, we'd expect another leg in the long term down trend through 1.1946 low. However, sustained break of 1.3835 should at least send GBP/USD to 38.2% retracement of 2.1161 (2007 high) to 1.1946 (2016 low) at 1.5466.
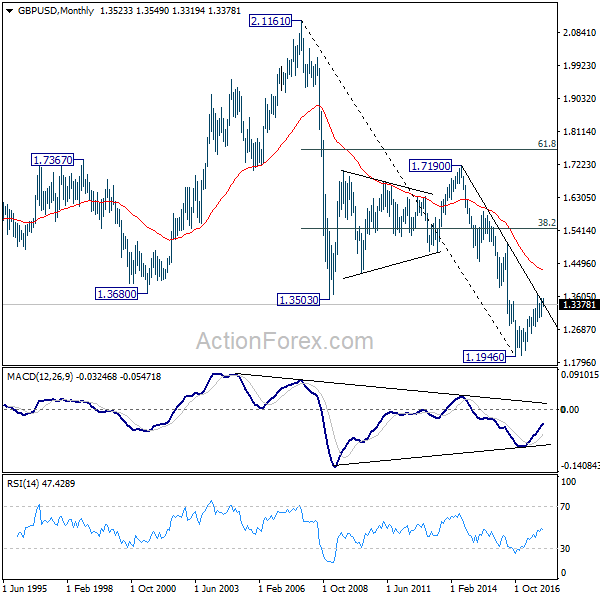
In the longer term picture, long the outlook is turned a bit mixed as GBP/USD failed to sustain above long term falling tend line resistance, nor 1.3835 key resistance. We'll stay neutral first and assess the outlook again and price actions unfold.
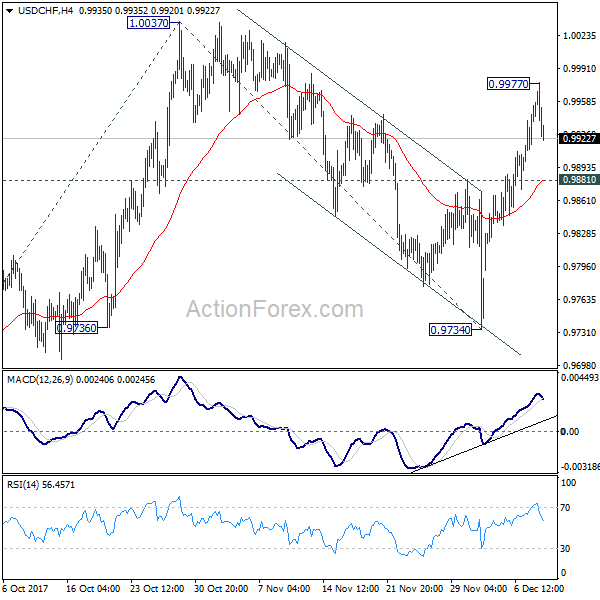
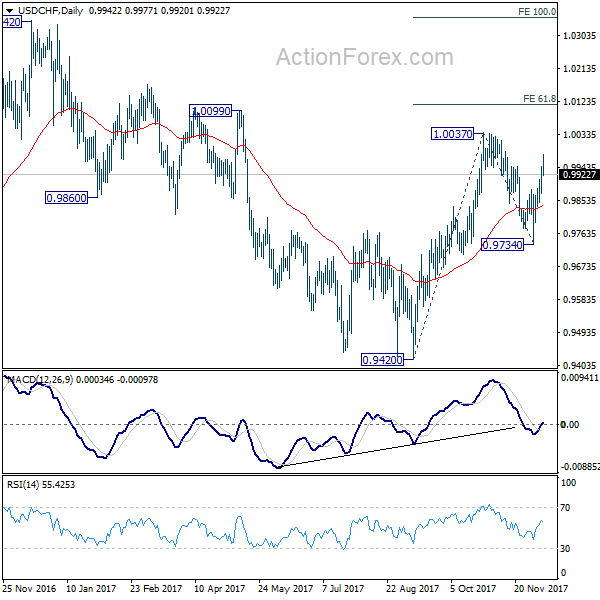
USD/CHF Weekly Outlook
USD/CHF rose to as high as 0.9977 last week and formed a temporary top there. Initial bias is neutral this week for consolidations first. Current development suggests that corrective pull back from 1.0037 has completed at 0.9734 already. And rise from 0.9420 is possibly resuming. Above 0.9977 will target 1.0037 high first. Break will extend the rise from 0.9420 to 61.8% projection of 0.9420 to 0.9734 from 1.0047 at 1.0115 next. Nevertheless, firm break of 0.9881 support will dampen this immediate bullish case and turn bias to the downside for 0.9734 instead.
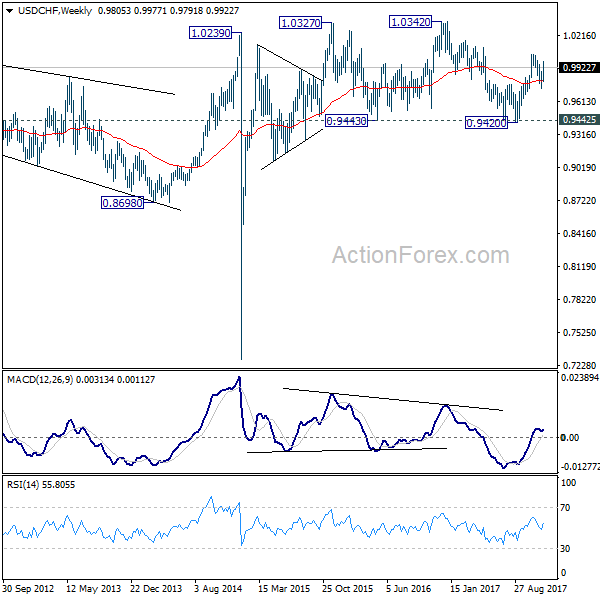
In the bigger picture, range trading continues between 0.9420/1.0342. At this point, 0.9420 appears to be a strong support level. Therefore, in case of decline attempt, we don't expect a firm break of this level. Nonetheless, strong break of 1.0342 is also needed to confirm upside momentum. Otherwise, medium term outlook will stay neutral.
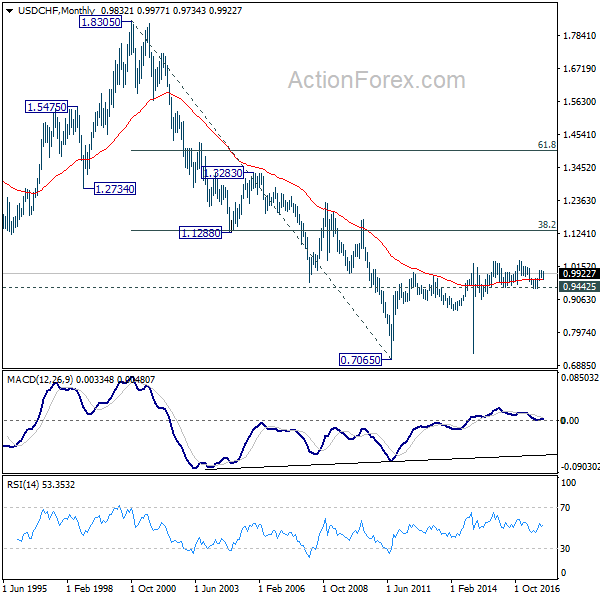
In the long term picture, while upside momentum is unconvincing, with 0.9443 key support intact, rise from 0.7065 (2011 low) is still expected to continue. Break of 1.0342 will target 38.2% retracement of 1.8305 (2000 high) to 0.7065 at 1.1359.
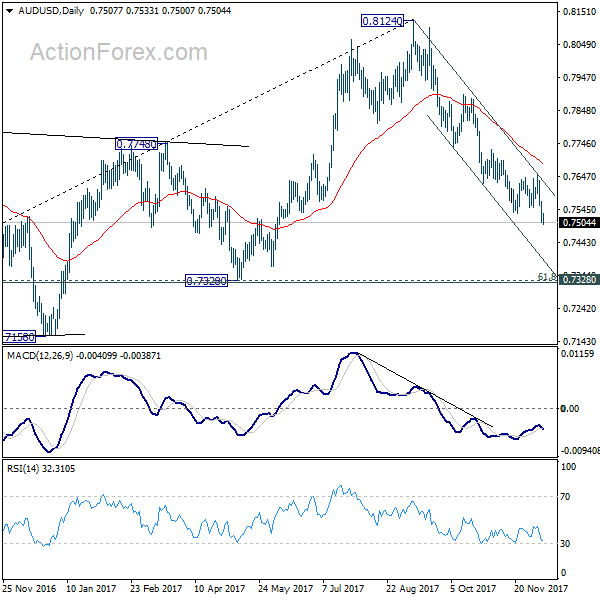
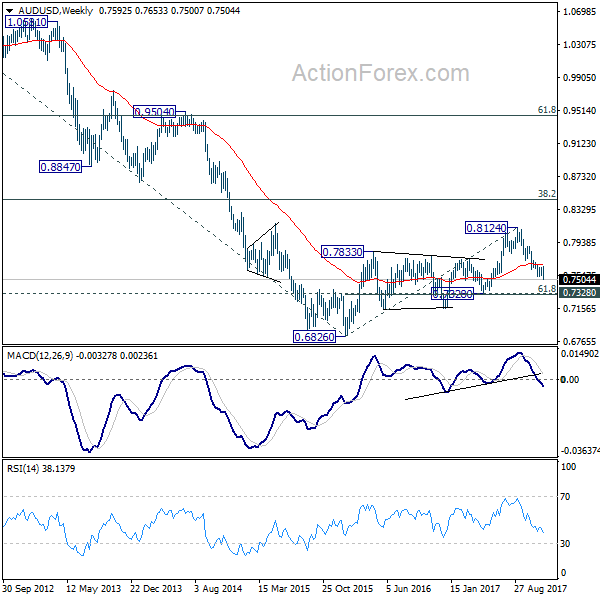
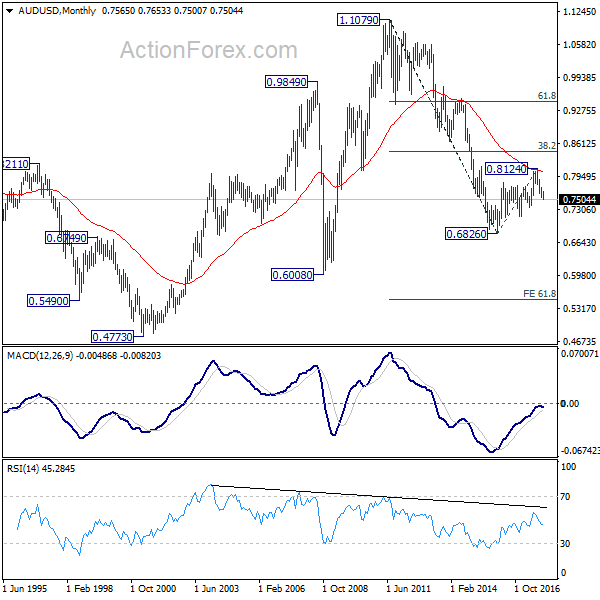
AUD/USD Weekly Outlook
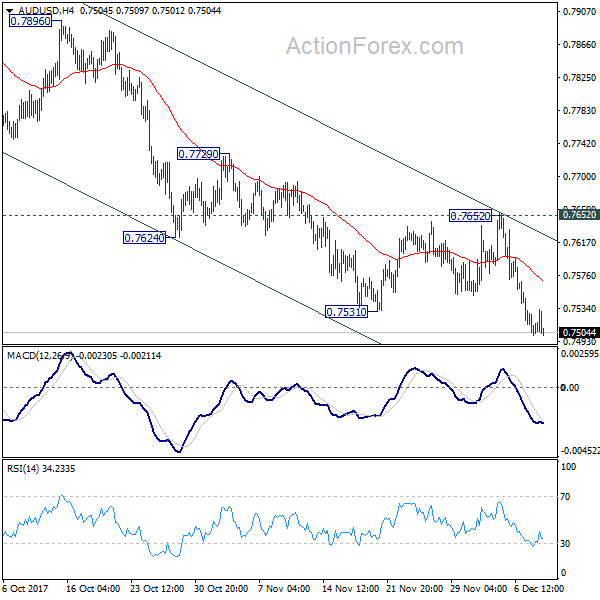
AUD/USD's decline from 0.8124 resumed last week and reached as low as 0.7500. Initial bias remains on the downside this week. AUD/USD should target 0.7322/8 cluster support next. On the upside, break of 0.7652 resistance is needed to indicate short term bottoming. Otherwise, outlook will remain bearish in case of recovery.
In the bigger picture, corrective rise from 0.6826 medium term bottom is likely completed at 0.8124, after hitting 55 month EMA (now at 0.8029). Decisive break of 0.7328 key cluster support (61.8% retracement 0.6826 to 0.8124 at 0.7322) will confirm. And in that case, long term down trend from 1.1079 (2011 high) will likely be resuming. Break of 0.6826 will target 61.8% projection of 1.1079 to 0.6826 from 0.8124 at 0.5496. This will now be the favored case as long as 0.7732 near term resistance holds.
In the longer term picture, 0.6826 is seen as a long term bottom. Rise from there could either reverse the down trend from 1.1079, or just develop into a corrective pattern. At this point, we're favoring the latter. And, as long as 38.2% retracement of 1.1079 to 0.6826 at 0.8451 holds, we'd anticipate another decline through 0.6826 at a later stage. But strong support should be seen between 0.4773 (2001 low) and 0.6008 (2008 low).
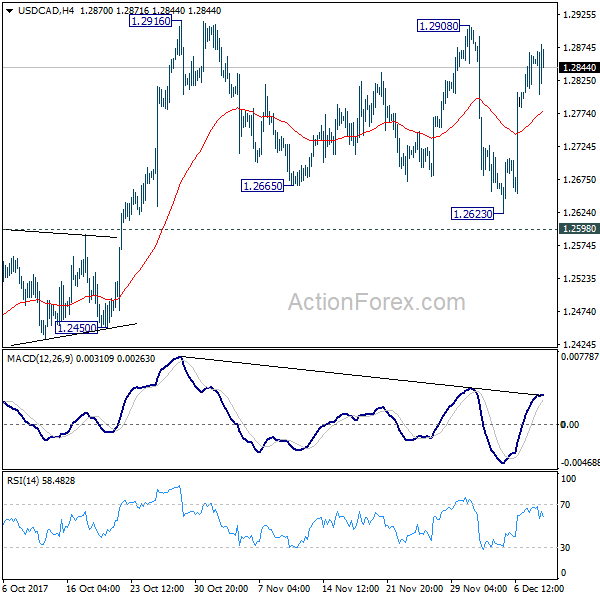
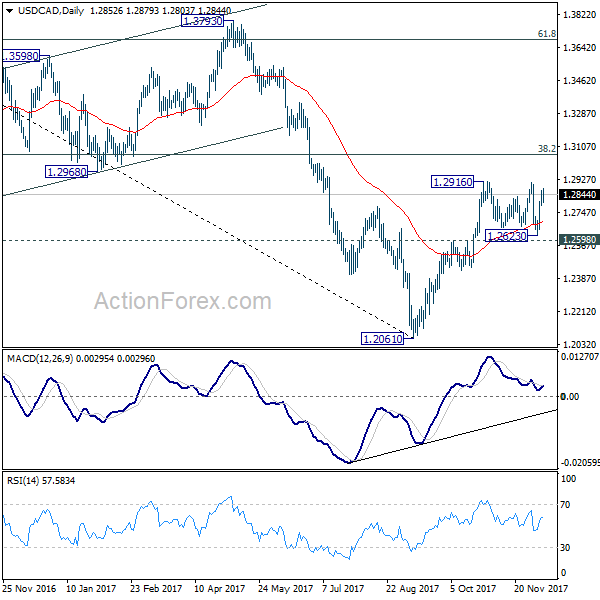
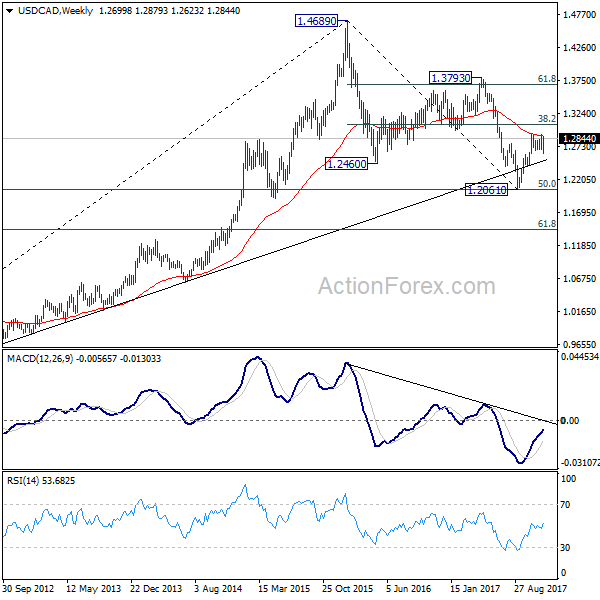
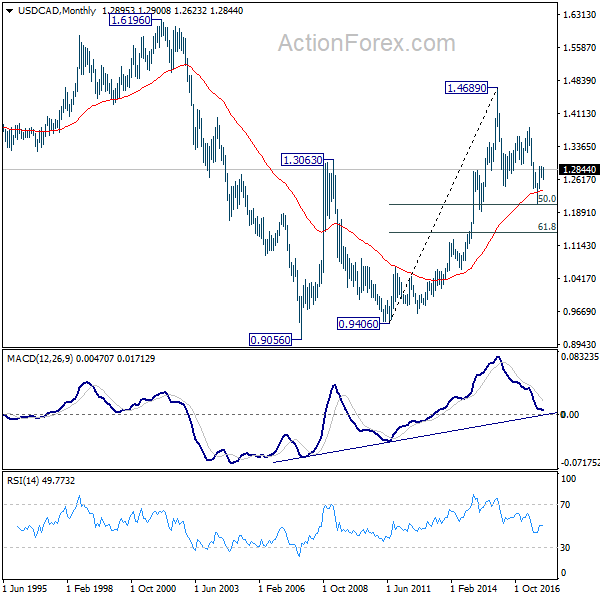
USD/CAD Weekly Outlook
USD/CAD dipped to 1.2623 last week but rebounded ahead of 1.2598 resistance. Upside is limited below 1.2916 resistance so far. Initial bias remains neutral this week first. In case consolidation from 1.2916 extends, downside should be contained by 1.2598 to bring rise resumption. Break of 1.2916 will resume whole rally from 1.2061 and target 1.3065 medium term fibonacci level next. However, sustained break of 1.2598 will argue that rebound from 1.2061 has completed after hitting 55 week EMA (now at 1.2888). Near term outlook will be turned bearish in this case.
In the bigger picture, USD/CAD should have defended 50% retracement of 0.9406 (2011 low) to 1.4689 (2016 high) at 1.2048. And with 1.2048 intact, we'd favor the case that fall from 1.4689 is a correction. Rise from 1.2061 medium term bottom should now target 38.2% retracement of 1.4689 to 1.2061 at 1.3065. Firm break there will target 1.3793 key resistance next (61.8% retracement at 1.3685). We'll now hold on to this bullish view as long as 1.2450 support holds.
In the longer term picture, current development argues that correction from 1.4689 has completed with three waves down to 1.2061 already. And larger up trend from 0.9056 (2007 low) is still in progress. Firm break of 1.3793 resistance should now indicate up trend resumption through 1.4689 high.
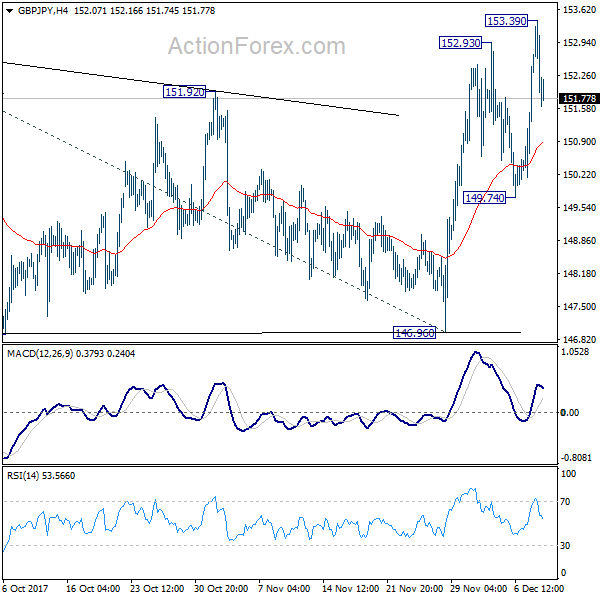
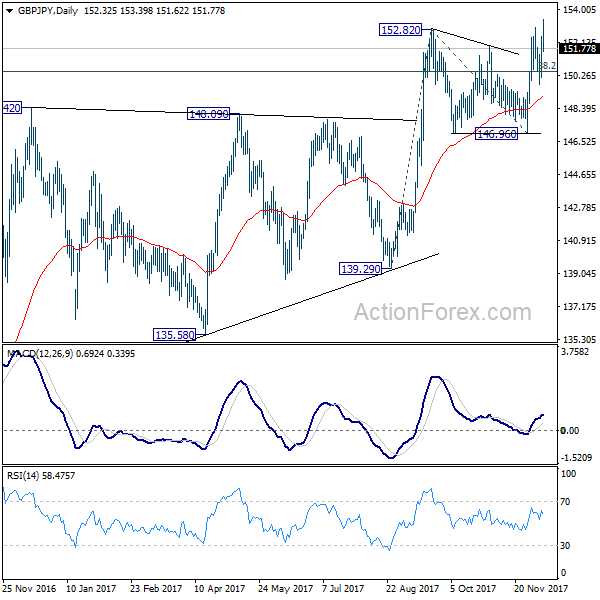
GBP/JPY Weekly Outlook
GBP/JPY rose to as high as 153.39 but formed a temporary top there and retreated. Initial bias is neutral this week. Prior break of 152.82 resistance suggests up trend resumption. Further rise is expected as long as 149.74 support holds. Break of 153.39 will target 61.8% projection of 139.29 to 152.82 from 146.96 at 155.32. However, break of 149.74 will dampen our bullish view and turn bias back to the downside for 146.96 key support instead.
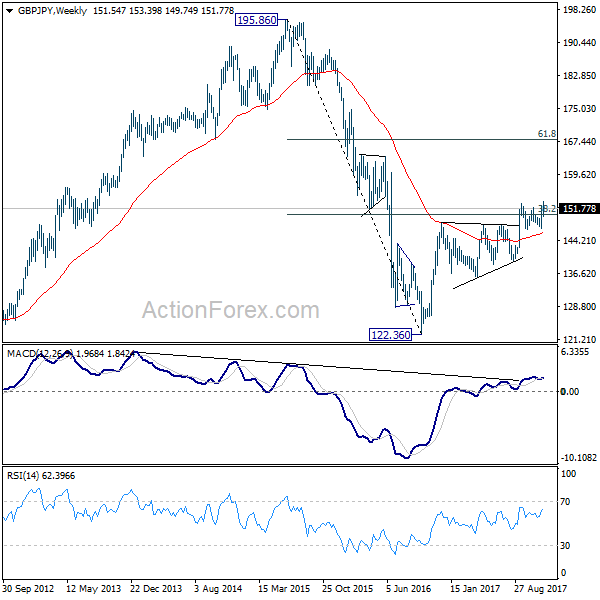
In the bigger picture, current development suggests that medium term rise from 122.36 is resuming. Sustained trading above 38.2% retracement of 196.85 to 122.36 at 150.43 will carry long term bullish implications. In that case, GBP/JPY could target 61.8% retracement at 167.78. However, break of 146.96 support will indicate rejection from 150.43 key fibonacci level. And the three wave corrective structure of rebound from 122.36 will argue that larger down trend is resuming for a new low below 122.26.
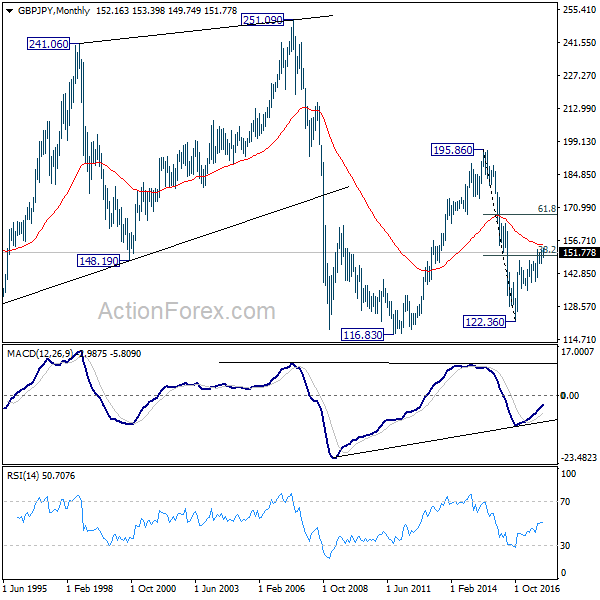
In the longer term picture, current rebound argues that the down trend from 195.86 (2015 high) has already completed at 122.36. Focus is now on 55 month EMA (now at 154.89). Firm break there will suggest that rise form 122.36 is developing into a long term move that target 195.86 again. And, price actions from 116.83 (2011 low) is indeed a sideway pattern that could last more than a decade. However, firm break of 139.29 will suggests that the long term down trend is still in progress and could break 116.83 low ahead.