Sample Category Title
Elliott Wave analysis: USDCAD and DAX Update
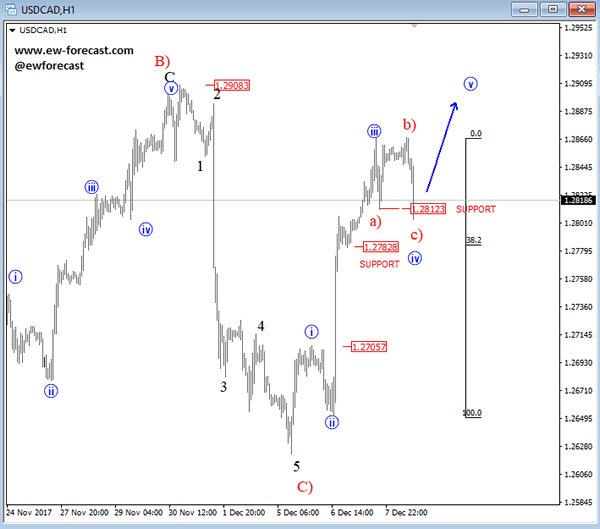
USDCAD came lower and is now testing a support level at 1.2812 from where we may see a new turn up if we consider the shape of an expanded flat formation in four. If we get a deeper pullback, then keep an eye on 1.2782 level.
USDCAD
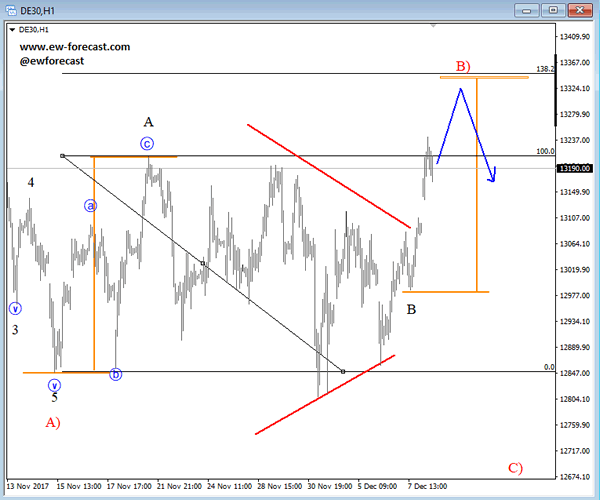
DAX did not respond much to NFP figures; we see slow price move here around 13200 so it can be just a small and minor pause within uptrend that may continue up to around 13300 or even to 13350 area from where we will expect a turn lower next week.
Dax, 1h
Canada: Housing Starts Robust in November
Canadian builders broke ground on 252k (SAAR) housing units in November, 13% higher than October and marking a very robust level of activity. The 6-month moving average rose to 226k from 217k during the month.
Starts in the volatile multi-family segment drove the headline increase, advancing 16.5% in the month. Meanwhile, housing construction increased by 5.9% in the single-detached market.
Provincially, starts were up in 6 of 10 provinces, led by Ontario were starts increased by a whopping 38k to 98k units - marking the highest pace of construction since January. Starts were also higher in Manitoba (+1.5k to 6.9k units) and Alberta (+5k to 34k units) with the pace of homebuilding in the latter market the highest since March. New home construction also increased in all of the Atlantic Provinces except New Brunswick. In B.C., starts moderated slightly from the multi-decade high reached in October, though the level was nonetheless solid at 48k.
Starts in the closely watched Toronto market increased to 45k from 28k in October. However, they have slowed so far in Q4 versus Q3's robust pace. Homebuilding activity in Vancouver dropped by 3k to 32k in the month. However, this follows a surge in October, leaving starts at a very healthy level. A similar story emerged in Montreal, with starts falling to 26k (down 15k) retracing some of the strong gain in October.
Key Implications
Homebuilding activity was extremely solid in November, rising to its highest level since April 2012. Housing construction has remained resilient this year despite the 'one-two punch' of regulatory measures aimed at cooling housing demand and rising mortgage rates. Ultimately, a healthy economic backdrop and firm population growth have provided support to homebuilding activity nationally.
In particular, Ontario's sizzling monthly gain provides some evidence that market has so far been able to shake off the impacts of the Fair Housing Plan, which slowed sales and building activity earlier in the year.
Despite today's blowout report we expect homebuilding to ease to a sub-200k pace in 2018, as higher mortgage rates and updated B20 regulations from OSFI weighing on housing starts, with disproportional impact on the Toronto and Vancouver markets where housing affordability remains highly stretched. Recent building permit data supports this view, with a softening trend in construction intentions in recent months pointing to a cool-off of starts activity in coming quarters.
U.S. Economy Churns Out Another Solid Job Report in November
The U.S. economy churned out a solid 228k new jobs in November, better than markets were expecting. The unemployment rate held steady at 4.1%, a 17-year low.
The details of the report were solid. Employment growth on the goods side of the economy accelerated (+62k) on gains in construction (+24k) and manufacturing (+31k). The services sector posted a solid 159k new positions led by education & health (+54k) and business services (+46k).
The fact that the unemployment rate held steady is impressive, given last month's drop to 4.1% was driven by a sizeable drop in the labor force (-765k). In November growth in the labor force roughly kept pace with job creation. The overall participation rate was unchanged at 62.7%. The employment to population ratio fell slightly to 60.1%, but is still higher than a year ago.
One small cloud in the report was a modest gain in average hourly earnings (+0.2% m/m). On a year-on-year basis wage gains are up a 2.5%. That pace is faster than inflation, but is increasingly looking like a puzzle in a labor market where the pool of unemployed and discouraged workers is below its pre-recession levels.
Key Implications
The U.S. job market continued its impressive performance in November. The Fed is well justified in classifying the U.S. at full employment.
Modest wage gains are a little perplexing, but they are likely to pick up in the months ahead. Other measures of wage growth show healthier increases. The Atlanta Fed wage tracker has been hovering round 3.5% year-on-year over the past two years.
As Republicans in Washington work feverishly to finalize a tax plan, the tight labor market increasingly looks to be a constraint that will limit the impact on economic growth. As workers become harder to find, this may be the impetus that sparks the much-anticipated acceleration in wage growth.
It is all systems go for a rate hike next week by the FOMC. While there may be some on the Fed who express concerns about the modest pace of core inflation, we have seen some progress on that score. Continued progress in the labor market should see the Fed continue to raise rates at a gradual pace.
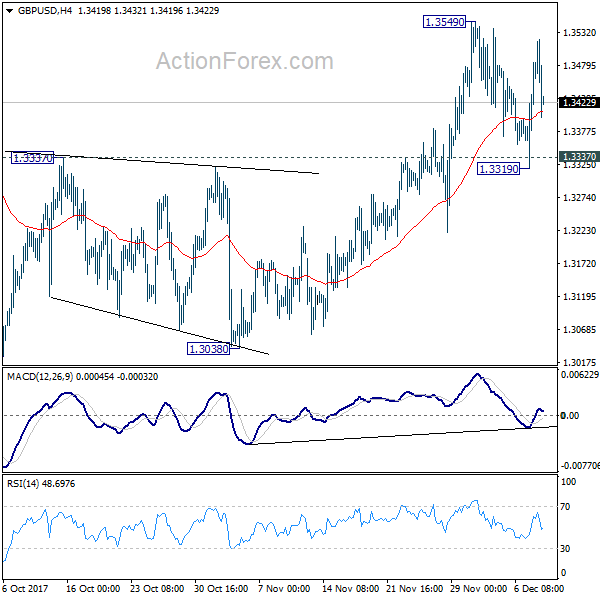
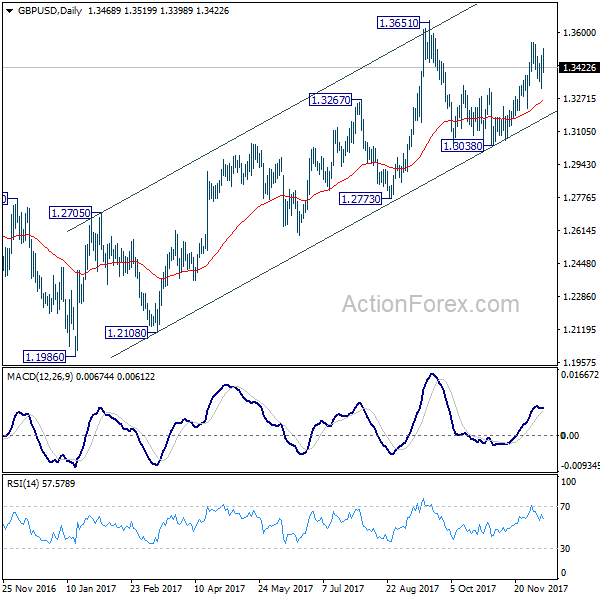
GBP/USD Mid-Day Outlook
Daily Pivots: (S1) 1.3366; (P) 1.3425; (R1) 1.3530; More....
GBP/USD failed to take out 1.3549 resistance and retreats. Intraday bias remains neutral at this point. As long as 1.3337 holds, further rise is expected. Break of 1.3549 will target 1.3651 high and above. However, decisive break of 1.3337 will argue that rise from 1.3038 has completed and turn bias back to the downside for this support.
In the bigger picture, while the medium term rebound from 1.1946 low is strong, it's still limited below 1.3835 key support turned resistance. As long as 1.3835 holds, we'd view such rebound as a correction. That is, we'd expect another leg in the long term down trend through 1.1946 low. However, sustained break of 1.3835 should at least send GBP/USD to 38.2% retracement of 2.1161 (2007 high) to 1.1946 (2016 low) at 1.5466.
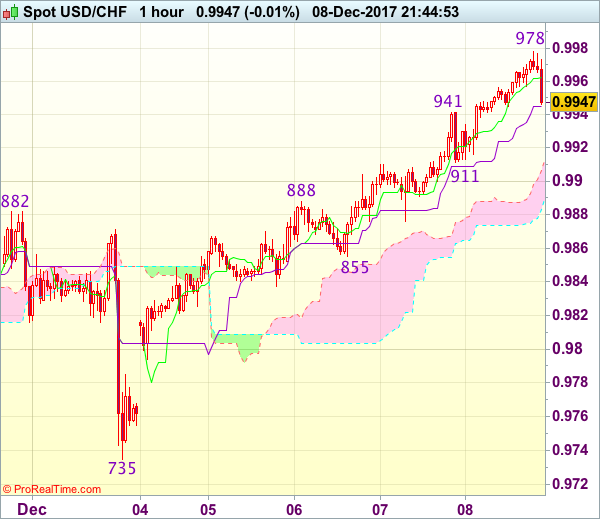
Trade Idea Wrap-up: USD/CHF – Buy at 0.9890
USD/CHF - 0.9943
Most recent candlesticks pattern : N/A
Trend : Near term up
Tenkan-Sen level : 0.9959
Kijun-Sen level : 0.9945
Ichimoku cloud top : 0.9913
Ichimoku cloud bottom : 0.9889
Original strategy :
Buy at 0.9900, Target: 1.0000, Stop: 0.9865
Position : -
Target : -
Stop : -
New strategy :
Buy at 0.9890, Target: 0.9990, Stop: 0.9855
Position : -
Target : -
Stop : -
As the greenback has surged again after brief pullback and broke above previous resistance at 0.9947, adding credence to our bullish view that the rise from 0.9735 low is still in progress, hence test of resistance at 0.9987 would be seen, above there would encourage for headway to 1.0000, however, near term overbought condition should limit upside and reckon recent high at 1.0038 would hold from here, risk from there is seen for a retreat later.
In view of this, would not chase this rise here and we are looking to buy dollar on dips as 0.9900 should limit downside and bring another rebound. Below previous resistance at 0.9882-88 (now support) would defer and risk correction towards support at 0.9855 but only break there would signal top is formed instead.
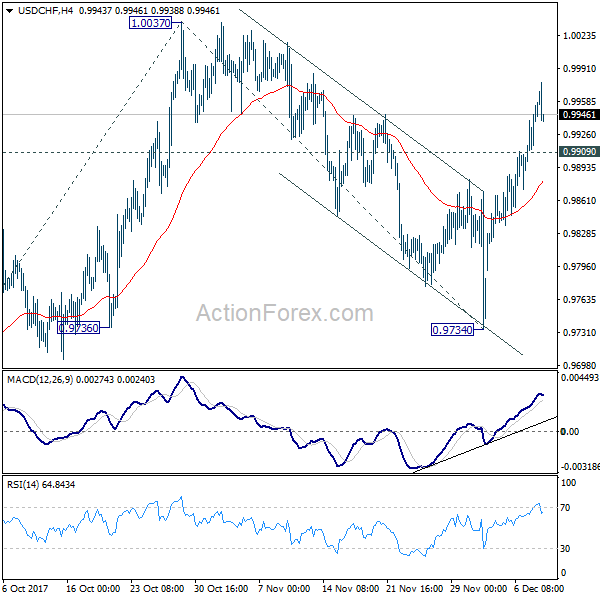
USD/CHF Mid-Day Outlook
Daily Pivots: (S1) 0.9892; (P) 0.9919; (R1) 0.9969; More....
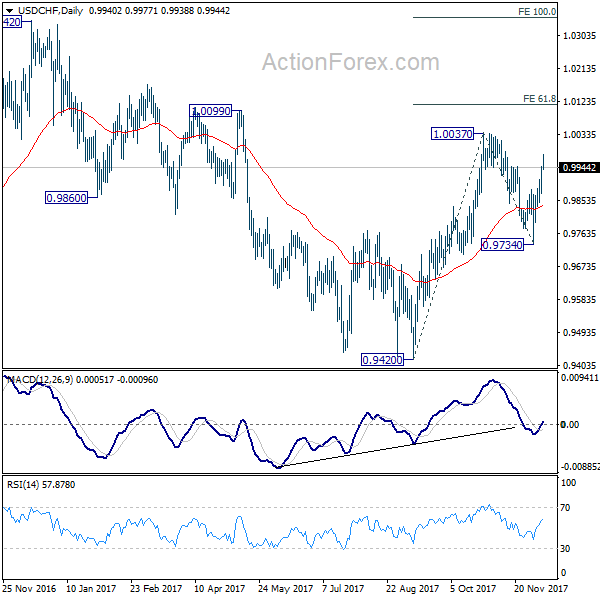
With 0.9909 minor support intact, intraday bias in USD/CHF remains on the upside for 1.0037 resistance. Firm break there will confirm resumption of whole rise from 0.9420 and target 61.8% projection of 0.9420 to 0.9734 from 1.0047 at 1.0115 next. On the downside, below 0.9909 minor support will turn bias neutral and bring consolidations first.
In the bigger picture, range trading continues between 0.9420/1.0342. At this point, 0.9420 appears to be a strong support level. Therefore, in case of decline attempt, we don't expect a firm break of this level. Nonetheless, strong break of 1.0342 is also needed to confirm upside momentum. Otherwise, medium term outlook will stay neutral.
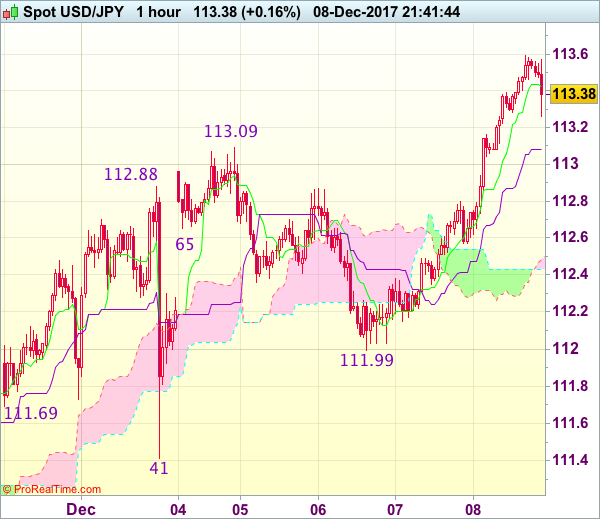
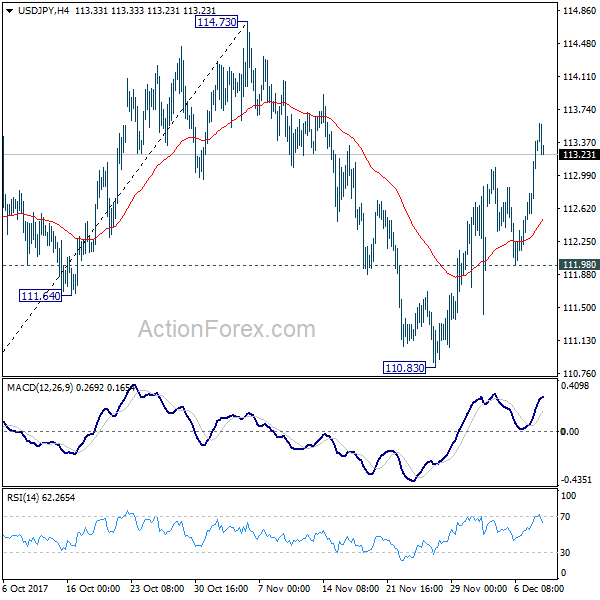
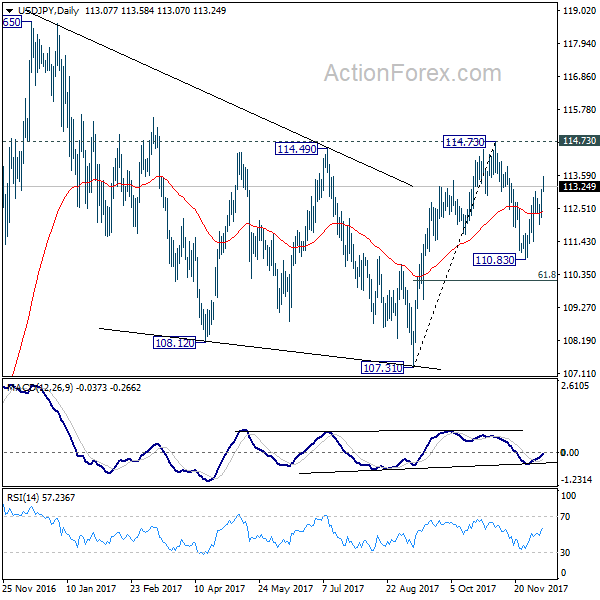
USD/JPY Mid-Day Outlook
Daily Pivots: (S1) 112.48; (P) 112.81; (R1) 113.42; More...
Intraday bias in USD/JPY remains on the upside for 114.73 key near term resistance. Decisive break there pave the way to retest 118.65 high. On the downside, break of 111.98 support is needed to indicate near term reversal. Otherwise, outlook will be mildly bullish in case of retreat.
In the bigger picture, we're holding on to the view that correction from 118.65 is completed a 107.31. And medium term rise from 98.97 (2016 low) is resuming. Sustained break of 114.73 should affirm our view and send USD/JPY through 118.65. However, break of 107.31 will dampen this will and extend the medium term fall back to 98.97 low.
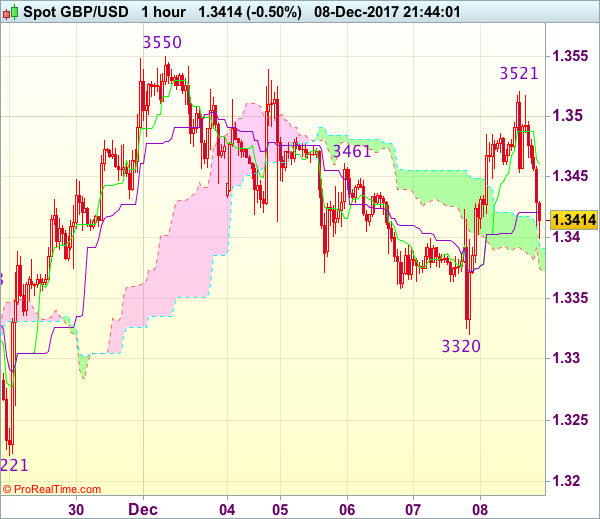
Trade Idea Wrap-up: GBP/USD – Stand aside
GBP/USD - 1.3423
Most recent candlesticks pattern : N/A
Trend : Near term up
Tenkan-Sen level : 1.3460
Kijun-Sen level : 1.3446
Ichimoku cloud top : 1.3391
Ichimoku cloud bottom : 1.3372
New strategy :
Stand aside
Position : -
Target : -
Stop : -
Despite yesterday’s anticipated selloff to 1.3320, the subsequent strong rebound on active cross-buying in sterling suggests low has been formed there and further choppy trading would take place, hence gain to 1.3525-30 cannot be ruled out, however, as outlook remains consolidative, reckon upside would be limited and recent high at 1.3550 should hold, bring retreat later.
As near term outlook is mixed, would be prudent to stand aside in the meantime. Below 1.3370-75 would prolong choppy trading and risk weakness to 1.3350 and price should stay well above said support at 1.3320, bring another rebound.
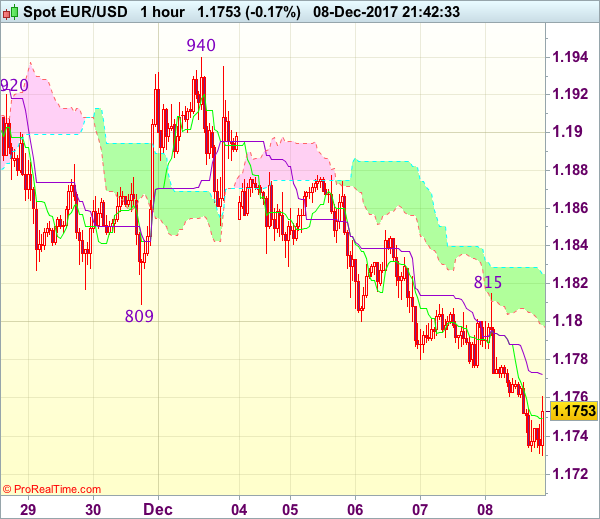
Trade Idea Wrap-up: EUR/USD – Sell at 1.1825
EUR/USD - 1.1766
Most recent candlesticks pattern : N/A
Trend : Near term down
Tenkan-Sen level : 1.1749
Kijun-Sen level : 1.1773
Ichimoku cloud top : 1.1825
Ichimoku cloud bottom : 1.1798
Original strategy :
Sell at 1.1810, Target: 1.1710, Stop: 1.1845
Position : -
Target : -
Stop : -
New strategy :
Sell at 1.1825, Target: 1.1725, Stop: 1.1860
Position : -
Target : -
Stop : -
As the single currency has fallen again after brief bounce to 1.1815, adding credence to our bearish view that the erratic decline from 1.1961 top (last week’s high) is still in progress and downside bias remains for further weakness towards previous key support at 1.1713 but break there is needed to retain bearishness for subsequent decline towards 1.1660-70 before prospect of a recovery due to near term oversold condition.
In view of this, we are looking to sell euro on recovery as said resistance at 1.1815 should limit upside and bring another decline. Above 1.1845-50 would defer and suggest low is formed, bring a stronger rebound to 1.1875-80 first.
Trade Idea Wrap-up: USD/JPY – Buy at 112.90
USD/JPY - 113.39
Most recent candlesticks pattern : N/A
Trend : Near term up
Tenkan-Sen level : 113.43
Kijun-Sen level : 113.08
Ichimoku cloud top : 112.49
Ichimoku cloud bottom : 112.43
Original strategy :
Buy at 113.00, Target: 114.00, Stop: 112.65
Position : -
Target : -
Stop : -
New strategy :
Buy at 112.90, Target: 114.00, Stop: 112.55
Position : -
Target : -
Stop : -
As the greenback has surged again and broke above previous resistance at 113.09, adding credence to our bullish view that recent upmove is still in progress and outlook remains supportive for the rise from 110.84 low to extend further gain to 113.60, then test of resistance area at 113.91-114.07, however, a sustained breach above this region is needed to signal early uptrend has resumed for headway to 114.34.
In view of this, would not chase this rise here and would be prudent to buy dollar again on pullback as 112.90-00 should limit downside and bring another rise later. Below 112.80 would deer and risk test of 112.55-60 but only break of latter level would signal top is formed instead, bring subsequent fall to 112.20-25.