
Sample Category Title
EUR/JPY Weekly Outlook
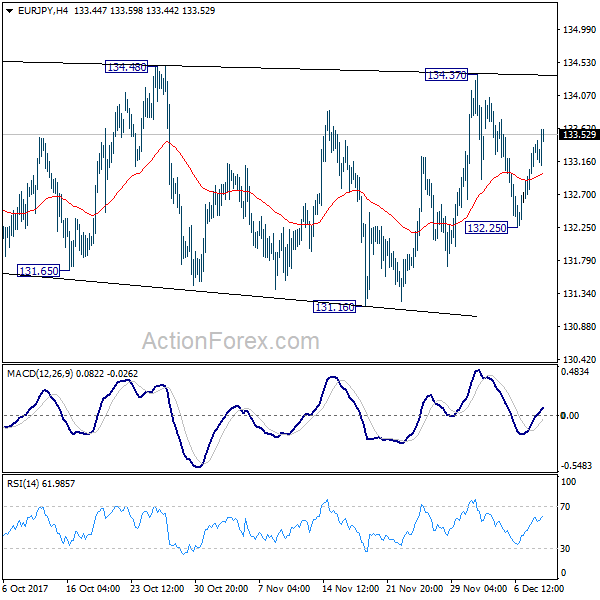
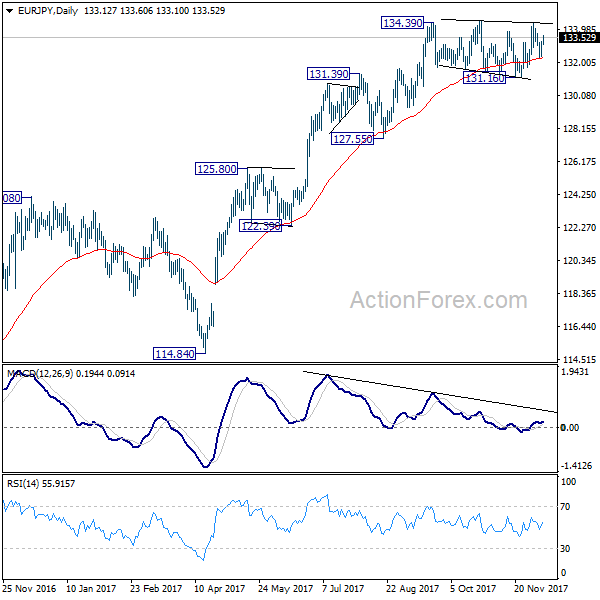
EUR/JPY was bounded in consolidation in range of 131.16/134.48 last week. Such consolidation might extend further. But further rise will be expected as long as 131.16 support holds. Decisive break of 134.48 will resume medium term rise from 114.84 and target 141.04 resistance next. However, sustained break of 131.16 support will now indicate near term trend reversal and turn outlook bearish for 127.55 key support.
In the bigger picture, medium term rise from 109.03 (2016 low) is seen as at the same degree as the down trend from 149.76 (2014 high) to 109.03 (2016 low). Sustained break of 61.8% retracement of 149.76 to 109.03 at 134.20 will pave the way to key long term resistance zone at 141.04/149.76. However, break of 127.55 support will suggest medium term topping and will turn outlook bearish for deeper fall back to 114.84/124.08 support zone at least.
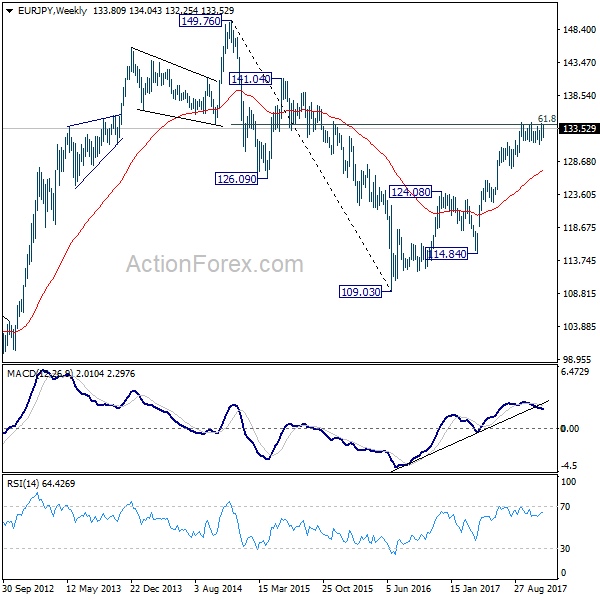
In the long term picture, at this point, there is no clear indication that rise from 109.03 is resuming that from 94.11 (2012 low). Hence, we'd be cautious on topping below 149.76 to extend range trading. Nonetheless, firm break of 149.76 will indicates strong underlying buying. In such case, EUR/JPY will target 100% projection of 94.11 to 149.76 from 109.03 at 164.68.
EUR/GBP Weekly Outlook
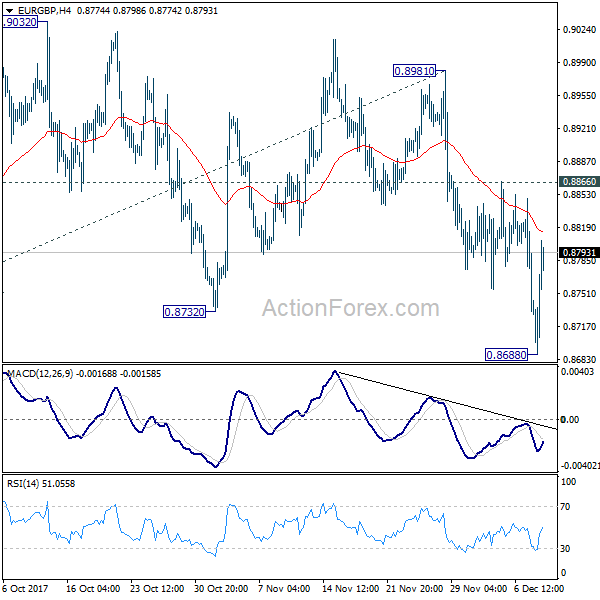
EUR/GBP's decline from 0.9305 resumed last week and reached as low as 0.8688 last week. As a temporary low was formed initial bias is neutral this week first. Deeper fall is expected as long as 0.8866 resistance holds. Below 0.8688 will target 61.8% projection of 0.9305 to 0.8745 from 0.8981 at 0.8468 first and then 100% projection at 0.8151 next. However, break of 0.8866 resistance will indicate near term reversal and turn bias back to the upside for 0.8981 resistance instead.
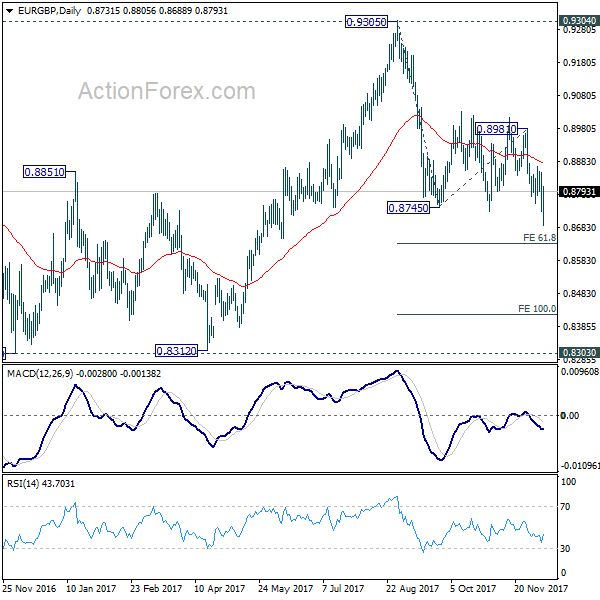
In the bigger picture, there are various ways to interpret price actions from 0.9304 high. But after all, firm break of 0.9304/5 is needed to confirm up trend resumption. Otherwise, range trading will continue with risk of deeper fall. And in that case, EUR/GBP could have a retest on 0.8303. But we'd expect strong support from 0.8116 cluster support (50% retracement of 0.6935 to 0.9304 at 0.8120) to contain downside.
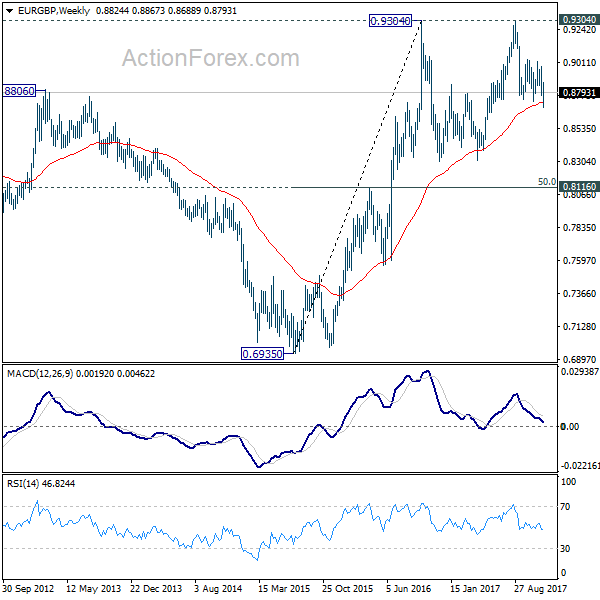
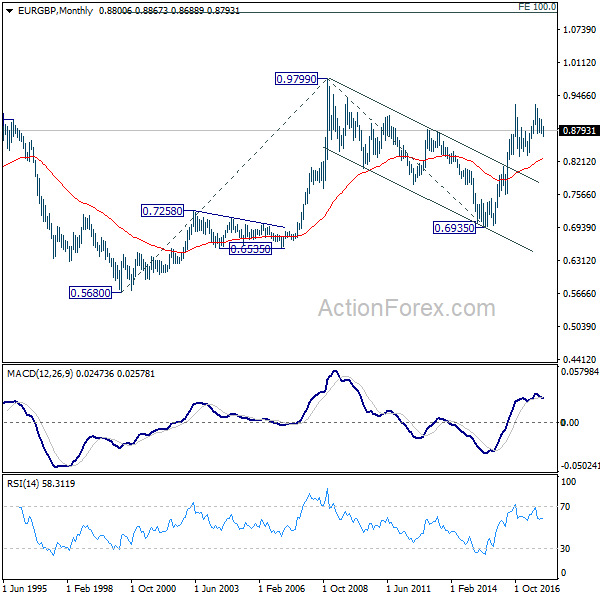
In the long term picture, we're holding on to the view that rise from 0.6935 (2015 low) is resuming the up trend from 0.5680 (2000 low). Hence, after the correction from 0.9304 completes, we'd expect another medium term up trend through 0.9799 to 100% projection of 0.5680 to 0.9799 from 0.6935 at 1.1054.
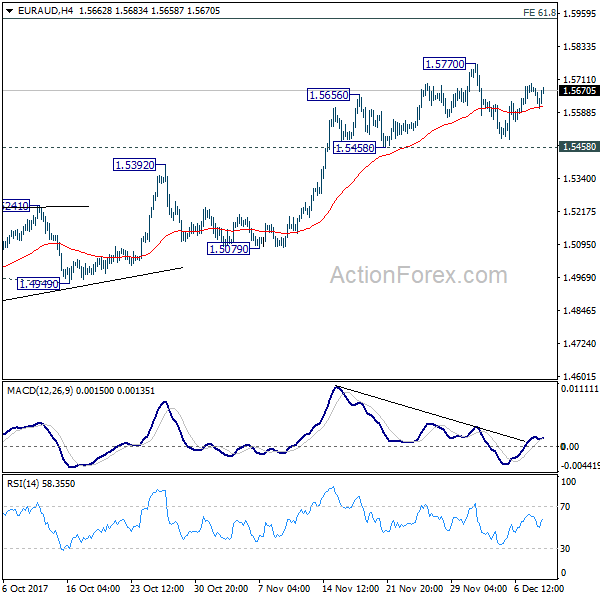
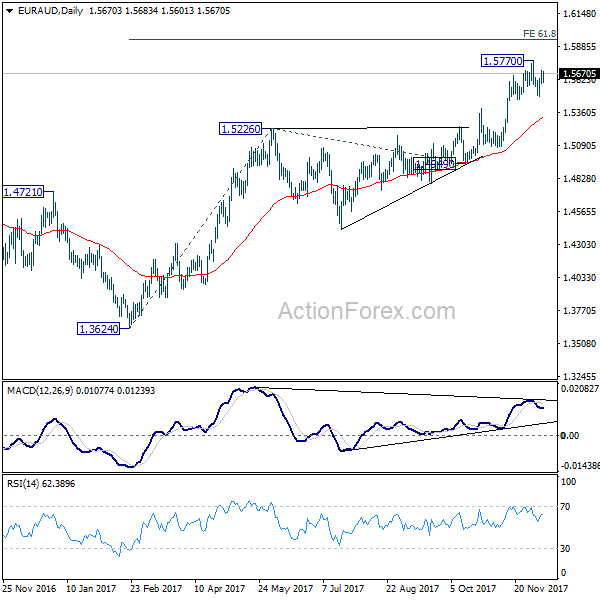
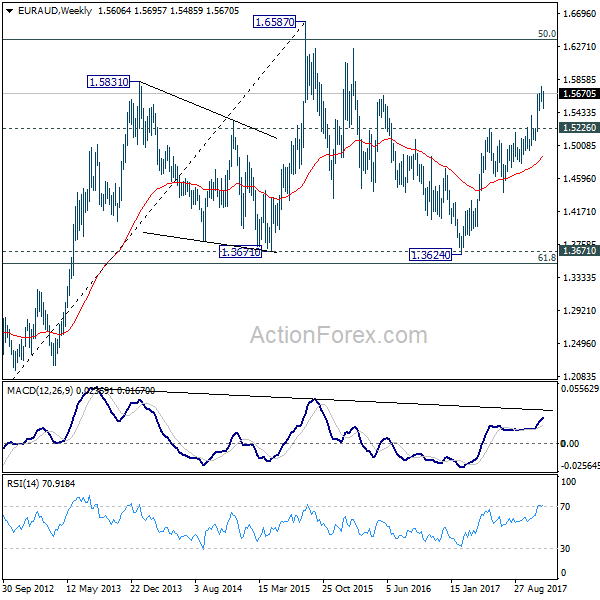
EUR/AUD Weekly Outlook
EUR/AUD stayed in consolidation below 1.5770 short term top last week and outlook is unchanged. Initial bias remains neutral this week first. Another fall could be seen as consolidation from 1.5770 extends. Break of 1.5458 support cannot be ruled out. But downside should be contained above 1.5226 key support to bring rally resumption. On the upside, break of 1.5770 will resume the medium term rise and target 61.8% projection of 1.3624 to 1.5226 from 1.4949 at 1.5939 first.
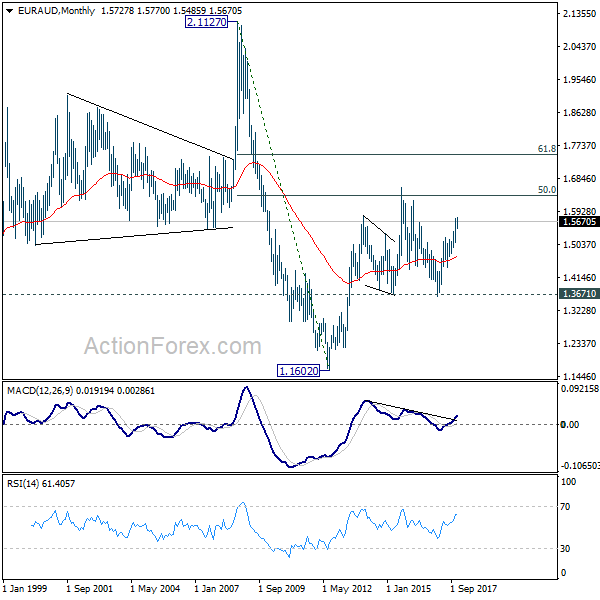
In the bigger picture, we're holding on to the view that corrective decline from 1.6587 medium term top (2015 high) has completed at 1.3624. Rise from 1.3624 is expected to extend to retest 1.6587. We'll hold on to this bullish view as long as 1.5226 resistance turned support holds. Firm break of 1.6587 will resume long term rise from 1.1602 (2012 low).
In the longer term picture, the rise from 1.1602 long term bottom isn't over yet. We'll keep monitoring the development but there is prospect of extending the rise to 61.8% retracement of 2.1127 to 1.1602 at 1.7488 and above. However, sustained trading below 1.3671 should confirm trend reversal and target 1.1602 long term bottom again.
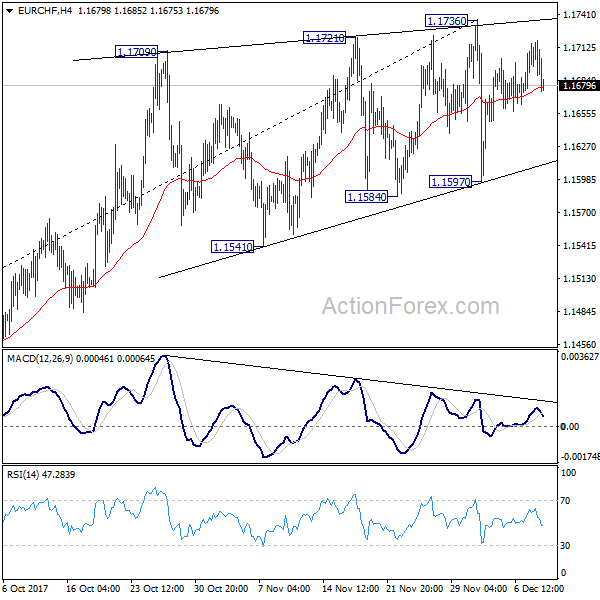
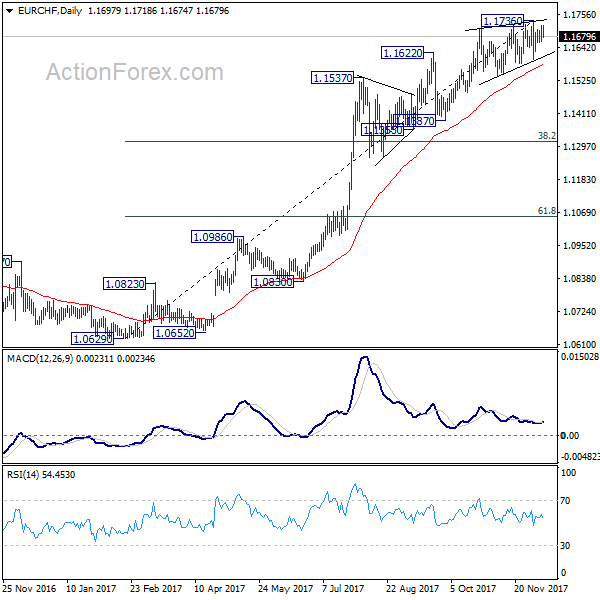
EUR/CHF Weekly Outlook
EUR/CHF stayed in range below 1.1736 last week and outlook is unchanged. Initial bias remains neutral this week. We maintained the view that EUR/CHF is close to topping, if not formed. This is supported by persistent bearish divergence condition in 4 hour MACD, and rising wedge like structure. On the downside, break of 1.1597 support will will be a strong sign of trend reversal and should turn outlook bearish for 38.2% retracement of 1.0629 to 1.1736 at 1.1313.
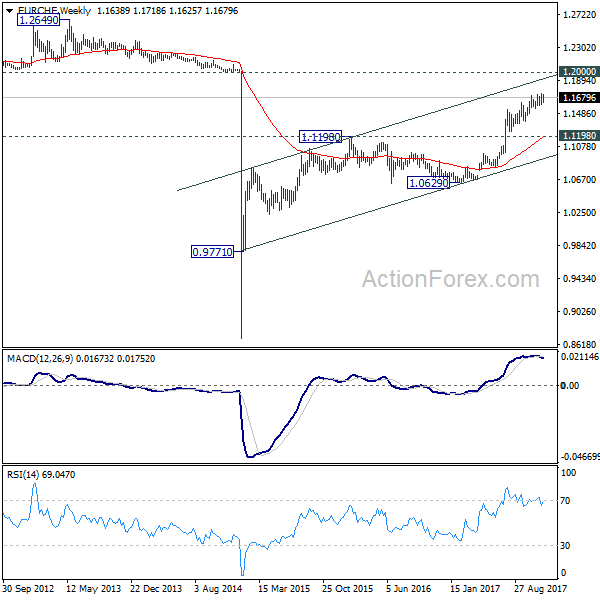
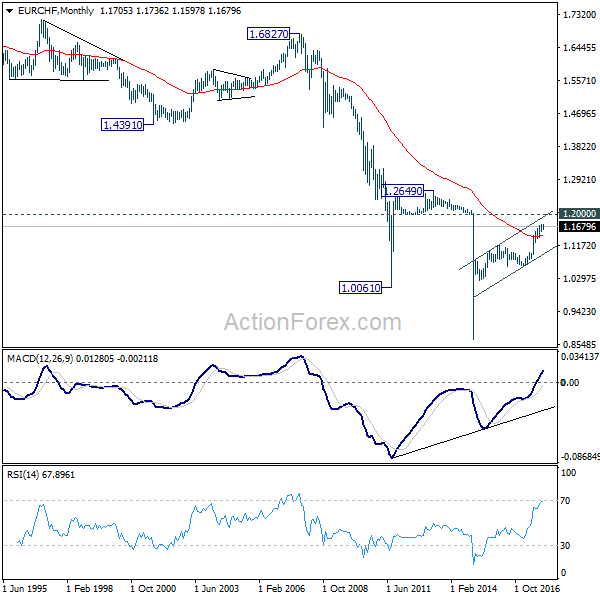
In the bigger picture, while a medium term top could be around the corner, there is no change in the larger outlook. That is, long term rise from SNB spike low back in 2015 is still in progress and would extend. As long as 1.1198 resistance turned support holds, we'll hold on to this bullish view and expect another to prior SNB imposed floor at 1.2000. Though, we'll reassess the outlook if 1.1198 is firmly taken out.
Dollar Rally Lacks Decisiveness, Looks Forward to FOMC
Dollar ended the week as the strongest major currency on optimism that Republicans are on track to get the tax bill passed by the end of the year. However, there was certain indecisiveness in Dollar's rally. In particular, the greenback lost momentum as wage growth in non-farm payroll report disappointed. That added to concerns of lack on inflationary pressure, and thus could slow down Fed's tightening pace. But there are two sides of every coin as the greenback just lost momentum, but not reversed. Dollar will look into this week's FOMC rate hike and economic projections for guidance.
Meanwhile, Sterling ended as the second strongest one as after a lot of drama, there was finally a breakthrough in Brexit negotiation. The EU summit on December 14/15 will now be formality only. The negotiation teams got the approval for moving to the next phase of trade talks already. The Pound, however, also lost much momentum after the news as they became facts. Swiss Franc ended the week as the weakest one on risk appetite. Canadian Dollar followed as the second weakest as the cautious BoC statement ruled out any chance of January rate hike. Australian Dollar closed as the third weakest after RBA gave no hint of any intention to tighten.
Four central banks will meet this week, including Fed, SNB, ECB and BoE. FOMC will be the major focus and the other three will likely be non-events.
Dollar rally lacks decisiveness, looks forward to FOMC
Technically developments in the Dollar were positive but not decisive. The greenback hesitated again after non-farm payroll remain showed lower than expected wage growth. CPI and FOMC rate decision on the coming Wednesday will now be the keys to Dollar's rally. Fed is widely expected to high the federal funds rate by 25bps to 1.25-1.50%. There is little chance that Fed will disappoint. The vote split will be the first thing to watch as it could signal how worried policy makers are on inflation. Minneapolis Fed President Neel Kashkari would very likely dissent the hike again. Chicago Fed President Charles Evans could be another dissenter. The vote split could be seen a hawkish if only Kashkari dissents, and dovish in three or more dissent.
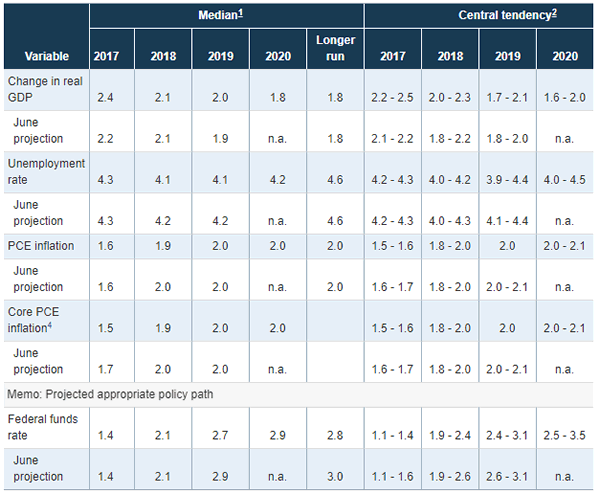
New economic projections will be watched next. Back in September, Fed projected GDP to growth 2.4% in 2017, 2.1% in 2018 and 2.0% in 2019. Unemployment rate was projected to be at 4.3% in 2017, 4.1% in 2018 and 4.1% in 2019. It's with little doubt that Fed will lower unemployment rate forecasts and possibly upgrade GDP forecasts too.
For inflation, PCE was projected to be at 1.6% in 2017, 1.9% in 2019 and 2.0% in 2019. Core PCE was forecast to be at 1.5% in 2017, 1.9% in 2018 and 2.0% in 2019. Headline PCE slowed from 1.7% to 1.6% in October while core PCE was unchanged at 1.4% yoy. There is no clear sign so far that inflation will pick up in 2018 to meet Fed's own projections. And there are risks of downward revisions in the forecasts, and that could be dollar negative.
FOMC September Projections
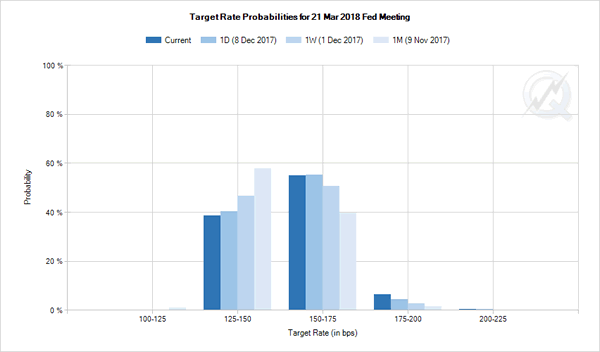
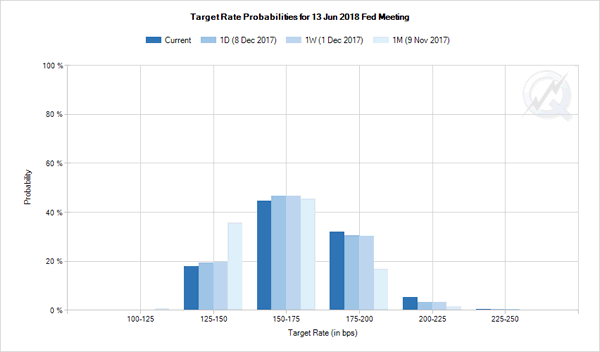
Markets unconvinced of two hikes by June
Meanwhile, Fed's own interest rate projections showed federal funds rate to hit 2.1% in 2018 and 2.7% in 2019. That is, a little less than three more hikes in 2018. Fed funds futures are pricing in more than 60% chance of another rate hike in March, clearly higher than around 40% chance a month ago. But they're much less convinced of another hike by June. Futures are pricing in less that 40% chance of that. Any changes to Fed's own rate projection would trigger sharp volatility in the greenback.
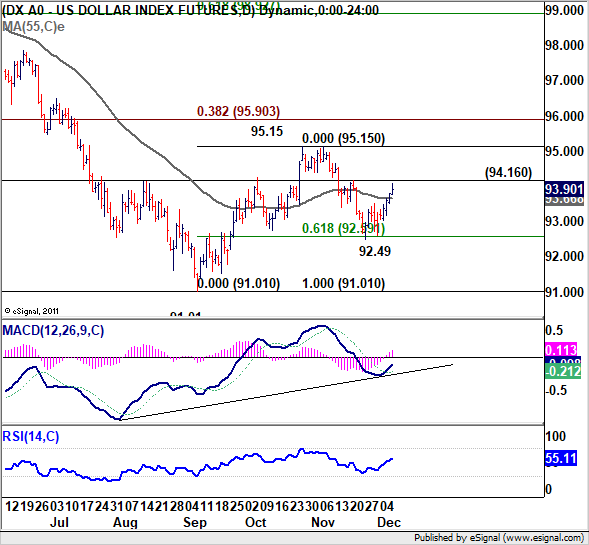
Dollar index to take on 94.16 resistance
Technically, Dollar index's rebound last week affirmed the view that pull back from 95.15 has completed at 92.49 after hitting 61.8% retracement of 91.01 to 95.15 at 92.59. The index also closed above flat 55 day EMA, with daily MACD stayed above signal line. These were positive developments. However, the rally was not decisive enough to break through 94.16 resistance to confirm the bullish turn. This 94.16 level, together with 1.1712 support in EUR/USD will be the key levels to watch this week. Firm break of 94.16 will likely resume the rise fro 91.01 through 95.15 to 38.2% retracement of 103.82 to 91.01 at 95.90. However, rejections from these levels will put DXY's focus back to 91.01, and EUR/USD's focus back to 1.1960.
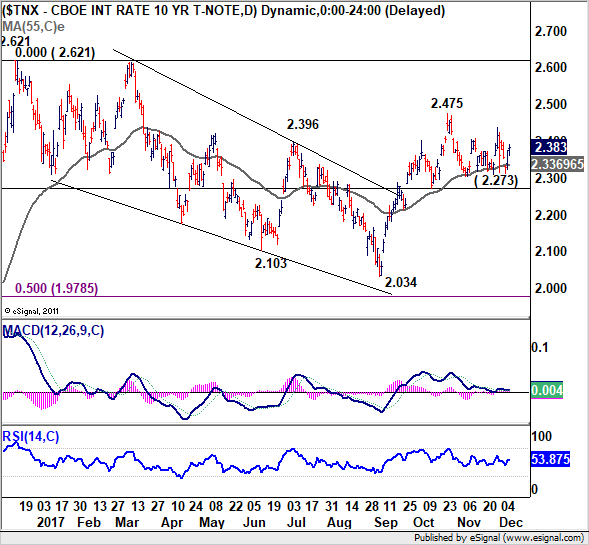
TNX struggled in consolidations
10 year yield also showed indecisiveness as it struggled in recently established range below 2.475. Nonetheless, price actions from 2.475 are clearly corrective in nature. TNX managed to hold above 55 day EMA and well above 2.273 key near term support. Hence, outlook stays cautiously bullish for another rise. Break of 2.475 will extend the rise from 2.034 to retest 2.621 key resistance.
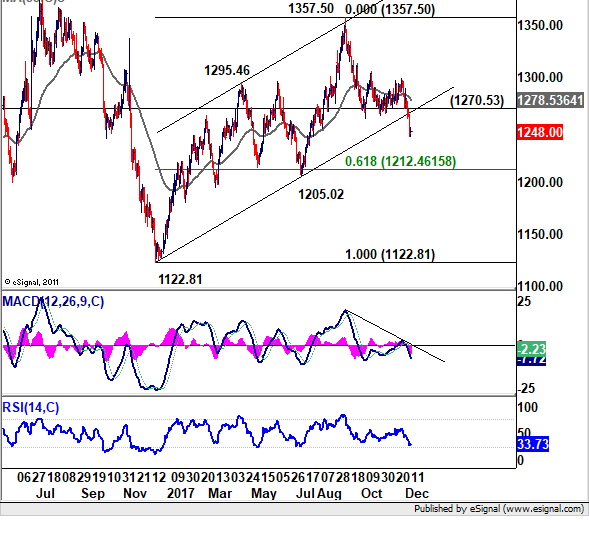
Gold confirmed trend reversal
Nonetheless, the sharp fall in gold last week could be seen as a hint of some underlying dollar strength. The firm break of 1260.80 support confirmed resumption of fall from 1357.50. More importantly, the decisive break of medium term channel support also suggests a trend reversal. That is, medium term rise from 1122.81 has completed with three waves up to 1357.50. Near term outlook is bearish for next hurdle at 1205.02 and 61.8% retracement of 1122.81 to 1357.50 at 1212.46. A rebound could be seen from there. But sustained break will bring deeper fall, possibly through 1122.81 low.
Trading strategy
Our sell EUR/GBP at 0.8880 was not filled as the cross just recovered to 0.8867. We'll cancel the order first. Nonetheless, subsequent downside breakout did affirm our bearish view. In the prior week, Canadian Dollar was lifted by strong employment data which revived speculations of a BoC hike early next year. But such speculation faded after BoC's cautious statement during the week. We'd expect the Loonie to be back under some selling pressure this week. In particular, USD/CAD is technically ready for another rise should FOMC delivers nothing bearish.
Hence, we'll buy USD/CAD on break of 1.2916 resistance this week. Technically, our view is that medium term correction from 1.4689 has completed with three waves down to 1.2061. Rise from there would likely target 1.3793 resistance before taking a breath.
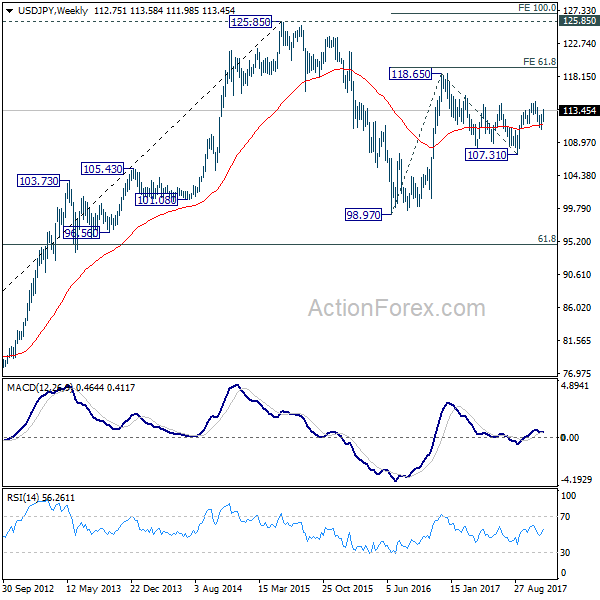
USD/JPY Weekly Outlook
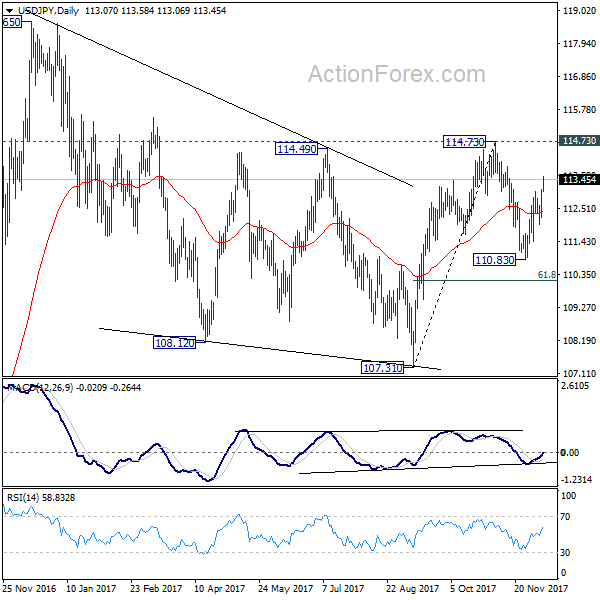
USD/JPY's rally last week suggests that pull back from 114.73 has completed at 110.83 already. Initial bias stays on the upside this week for 114.73 key resistance. Decisive break there will resume whole rise form 107.31. More importantly, that will confirm completion of medium term correction from 118.65 at 107.31. In that case, retest of 118.65 should be seen next. However, break of 111.98 will extend the correction from 114.73 with another fall, possibly to 61.8% retracement of 107.31 to 114.73 at 110.14 before completion.
In the bigger picture, we're holding on to the view that correction from 118.65 is completed a 107.31. And medium term rise from 98.97 (2016 low) is resuming. Sustained break of 114.73 should affirm our view and send USD/JPY through 118.65. However, break of 107.31 will dampen this will and extend the medium term fall back to 98.97 low.
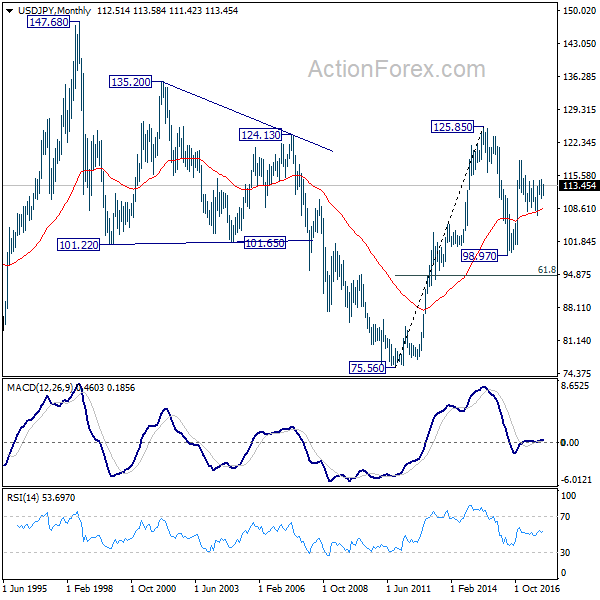
In the long term picture, the rise from 75.56 (2011 low) long term bottom to 125.85 top is viewed as an impulsive move, no change in this view. Price actions from 125.85 are seen as a corrective move which could still extend. In case of deeper fall, downside should be contained by 61.8% retracement of 75.56 to 125.85 at 94.77. Up trend from 75.56 is expected to resume at a later stage for above 135.20/147.68 resistance zone.

Eco Data 12/15/17
[php_everywhere] [/php_everywhere]
Eco Data 12/14/17
[php_everywhere] [/php_everywhere]
Eco Data 12/13/17
[php_everywhere] [/php_everywhere]
Eco Data 12/12/17
[php_everywhere] [/php_everywhere]
Eco Data 12/11/17
[php_everywhere] [/php_everywhere]