Sample Category Title
Forex Technical Analysis: EUR/USD, USD/JPY, GBP/USD
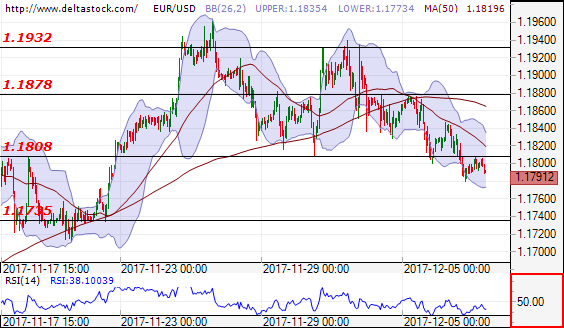
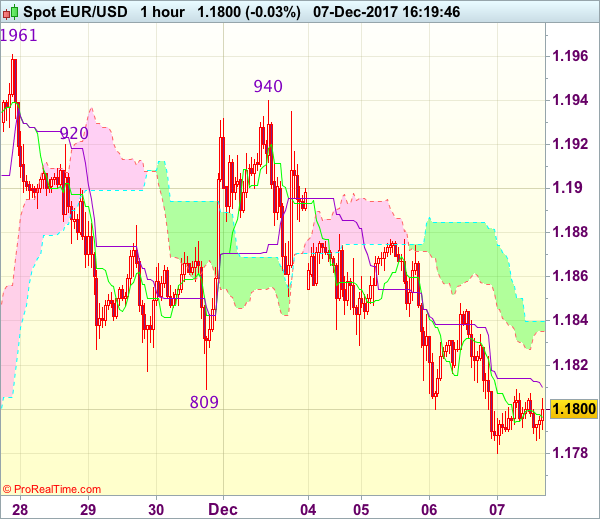
EUR/USD
Current level - 1.1791
The outlook is negative for test of the support level at 1.1735. In positive direction the price movement might test the level of resistance at 1.1808. If the breakthrough at this level is successful, the next resistance will be at 1.1840.
| Resistance | Support | ||
| intraday | intraweek | intraday | intraweek |
|
1.1808 |
1.2090 |
1.1735 |
1.1690 |
|
1.1878 |
1.2090 |
1.1735 |
1.1550 |
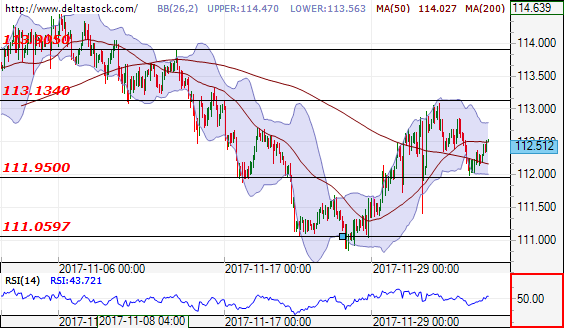
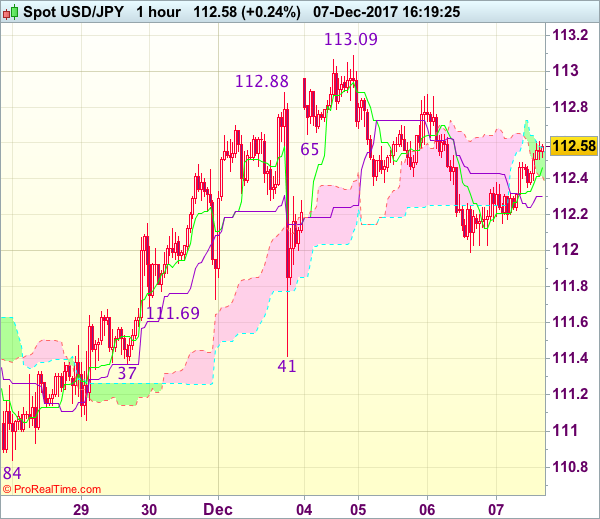
USD/JPY
Current level - 112.10
The unsuccessful breakthrough of the support level at 111.95 leaded to uptrend and the outlook is positive for test of the resistance level at 113.13. In negative direction the support levels are at 111.95 and after that at 111.05.
| Resistance | Support | ||
| intraday | intraweek | intraday | intraweek |
|
113.13 |
113.90 |
111.95 |
109.50 |
|
113.90 |
114.70 |
109.50 |
107.30 |
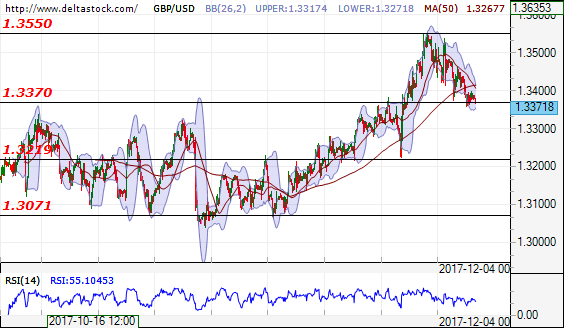
GBP/USD
Current level - 1.3371
The unsuccessful breakthrough of the resistance level at 1.3550, leaded to test of the support level at 1.3370. Next support level might be at 1.3219.
| Resistance | Support | ||
| intraday | intraweek | intraday | intraweek |
|
1.3550 |
1.3460 |
1.3370 |
1.3219 |
|
1.3623 |
1.3660 |
1.3219 |
1.3020 |
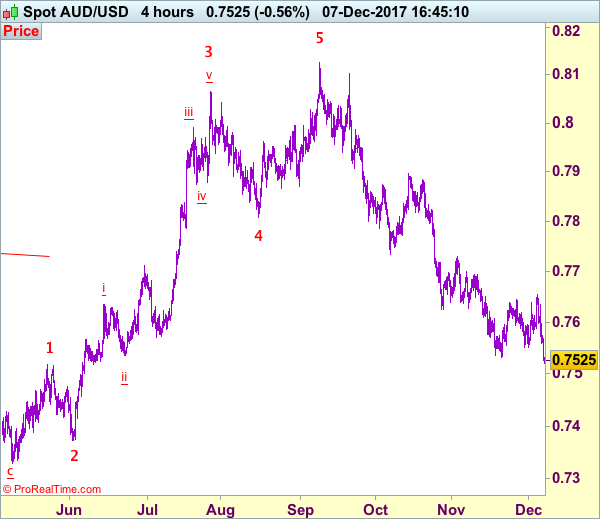
Trade Idea: AUD/USD – Hold short entered at 0.7620
AUD/USD – 0.7525
Original strategy:
Sold at 0.7620, Target: 0.7470, Stop: 0.7660
Position: - Short at 0.7620
Target: - 0.7470
Stop:- 0.7660
New strategy :
Hold short entered at 0.7620, Target: 0.7470, Stop: 0.7610
Position: - Short at 0.7620
Target: - 0.7470
Stop:- 0.7610
Although aussie rose briefly to 0.7654, as renewed selling interest emerged there and the pair has dropped again below previous support at 0.7532-51, adding credence to our bearish view that recent decline from 0.8125 top has resumed and downside bias remains for this move to extend further weakness to 0.7500, then 0.7470, however, near term oversold condition would limit downside to 0.7440 and price should stay above 0.7390-00.
In view of this, we are holding on to our short position entered at 0.7620. Above 0.7600 would risk test of 0.7640 and then 0.7654 but only break of latter level would abort and signal low is formed instead, bring a stronger rebound towards resistance at 0.7701 which is likely to hold from here.
On the 4-hour chart, recent upmove from 0.7329 is unfolding as an impulsive rise with wave 3 as well as smaller degree wave (iii) extending, only minor wave v of (iii) has ended at 0.8125, hence bullishness remains for this move to extend headway to 0.8200, then towards 0.8300, however, reckon upside would be limited to 0.8400 and the final wave 5 should falter below 0.8500, bring correction later.
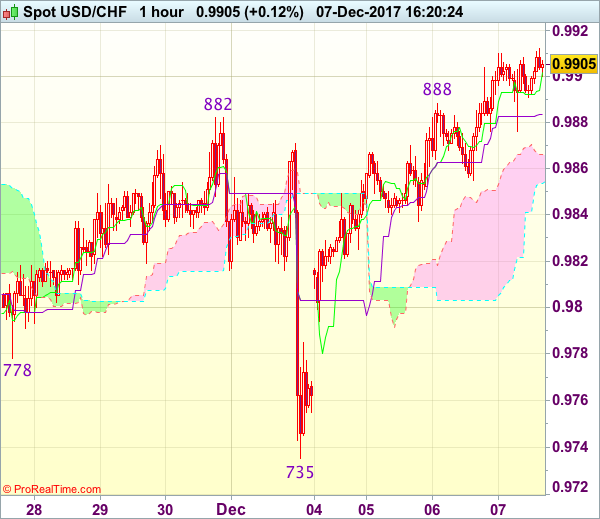
Trade Idea : USD/CHF – Buy at 0.9825
USD/CHF - 0.9906
Most recent candlesticks pattern : N/A
Trend : Near term up
Tenkan-Sen level : 0.9902
Kijun-Sen level : 0.9884
Ichimoku cloud top : 0.9866
Ichimoku cloud bottom : 0.9854
Original strategy :
Buy at 0.9825, Target: 0.9925, Stop: 0.9790
Position : -
Target : -
Stop : -
New strategy :
Buy at 0.9825, Target: 0.9925, Stop: 0.9790
Position : -
Target : -
Stop : -
As the greenback has maintained a firm undertone after staging a strong rebound from 0.9735 (last Friday’s low), adding credence to our view that a temporary low has been formed there and consolidation with upside bias remains for this move to bring at least a strong retracement of recent decline to 0.9920 and later towards resistance at 0.9947 but reckon 0.9990-00 would hold from here due to near term overbought condition.
In view of this, we are looking to buy dollar on dips as 0.9820-25 should limit downside and bring another rebound. Below 0.9790 would defer and risk weakness to 0.9755-60 but still reckon said last week’s low at 0.9735 would remain intact.
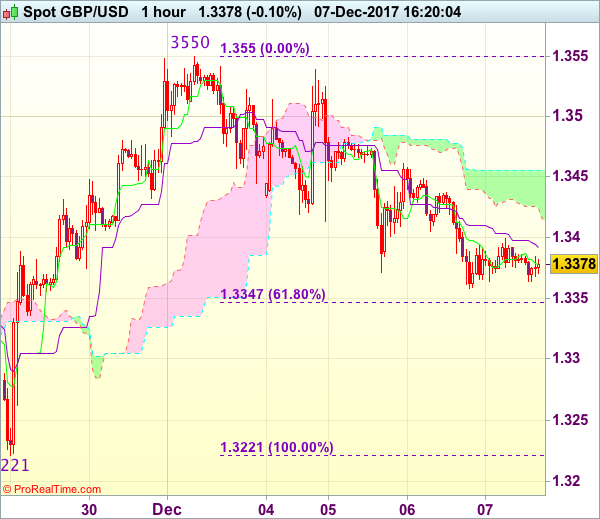
Trade Idea : GBP/USD – Hold short entered at 1.3440
GBP/USD - 1.3380
Most recent candlesticks pattern : N/A
Trend : Near term up
Tenkan-Sen level : 1.3378
Kijun-Sen level : 1.3392
Ichimoku cloud top : 1.3455
Ichimoku cloud bottom : 1.3424
Original strategy :
Sold at 1.3440, Target: 1.3340, Stop: 1.3465
Position : - Short at 1.3440
Target : - 1.3340
Stop : - 1.3465
New strategy :
Hold short entered at 1.3440, Target: 1.3340, Stop: 1.3440
Position : - Short at 1.3440
Target : - 1.3340
Stop : - 1.3440
Cable traded narrowly after falling to 1.3358 yesterday and further sideways trading is seen for the fall from 1.3550 resumes, below said support would add credence to our bearish view that top has been formed at 1.3550, hence downside bias remains for at least a retracement of recent rise to 1.3340-50 (61.8% Fibonacci retracement of 1.3221-1.3550) but near term oversold condition should prevent sharp fall below 1.3300 and reckon 1.3260-65 would hold, bring rebound later.
In view of this, we are holding on to our short position entered at 1.3440. Only above said resistance at 1.3461 would defer and risk test of resistance at 1.3483 but break there is needed to signal an intra-day low is formed instead, bring another bounce to 1.3530-35 first.
Trade Idea : EUR/USD – Sell at 1.1865
EUR/USD - 1.1796
Most recent candlesticks pattern : N/A
Trend : Near term down
Tenkan-Sen level : 1.1797
Kijun-Sen level : 1.1810
Ichimoku cloud top : 1.1840
Ichimoku cloud bottom : 1.1835
Original strategy :
Sell at 1.1865, Target: 1.1765, Stop: 1.1900
Position : -
Target : -
Stop : -
New strategy :
Sell at 1.1865, Target: 1.1765, Stop: 1.1900
Position : -
Target : -
Stop : -
As the single currency has remained under pressure after recent selloff, adding credence to our bearish view that the erratic decline from 1.1961 top (last week’s high) is still in progress and downside bias remains for further weakness to to 1.1770 and possibly towards support at 1.1736 but near term oversold condition should limit downside and price should stay above previous key support at 1.1713.
In view of this, we are looking to sell euro on recovery as 1.1870-75 should limit upside and bring another decline. Above 1.1900 would risk test of last Friday’s high at 1.1940 but only break there would revive bullishness, bring retest of 1.1961 later.
Trade Idea : USD/JPY – Hold long entered at 112.10
USD/JPY - 112.59
Most recent candlesticks pattern : N/A
Trend : Near term up
Tenkan-Sen level : 112.46
Kijun-Sen level : 112.30
Ichimoku cloud top : 112.58
Ichimoku cloud bottom : 112.41
Original strategy :
Bought at 112.10, Target: 113.30, Stop: 111.75
Position : - Long at 112.10
Target : - 113.30
Stop : - 111.75
New strategy :
Hold long entered at 112.10, Target: 113.30, Stop: 111.95
Position : - Long at 112.10
Target : - 113.30
Stop : - 111.95
As the greenback found renewed buying interest just below 112.00 and has staged a rebound, suggesting the pullback from 113.09 has possibly ended at 111.99, retaining our bullishness and gain to 112.85-90 is likely, break there would confirm this view and bring retest of 113.09, above there would extend recent upmove to resistance at 113.33 and later towards 113.60-70.
In view of this, we are holding on to our long position entered at 112.10. Below 111.99 support would defer and risk weakness to 111.60 but only break of said support at 111.37-41 would abort and signal top is formed instead.
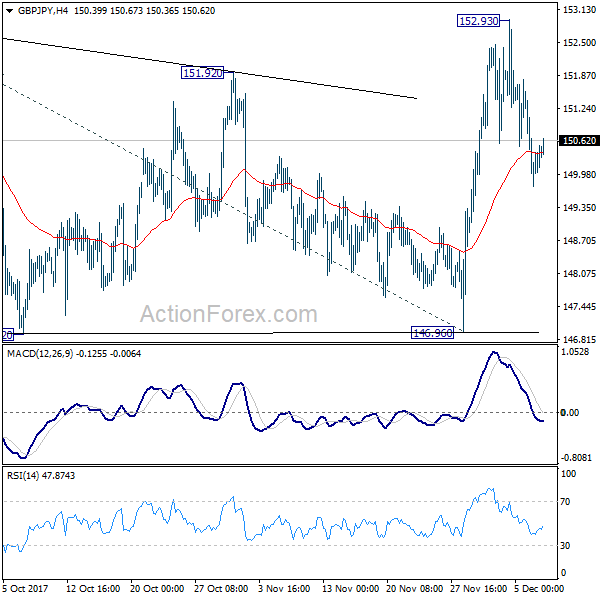
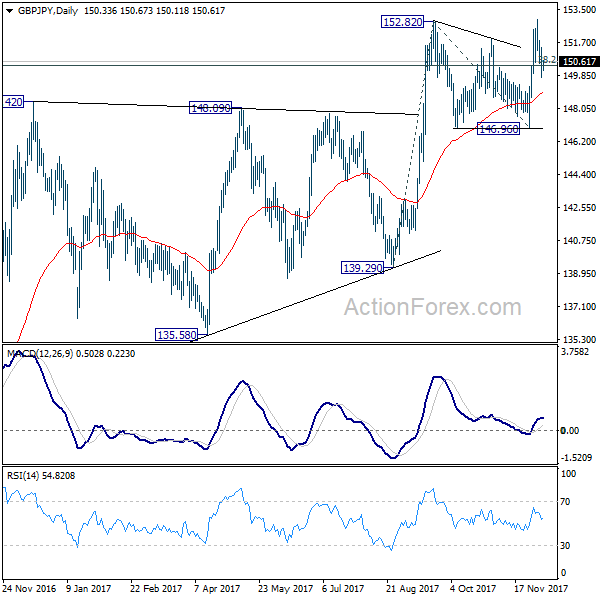
GBP/JPY Daily Outlook
Daily Pivots: (S1) 150.62; (P) 151.21; (R1) 151.91; More...
Intraday bias in GBP/JPY remains neutral at this point. As long as 146.96 support holds, near term outlook remains bullish. Break of 152.93 will resume medium term rally and target 61.8% projection of 139.29 to 152.82 from 146.96 at 155.32.
In the bigger picture, medium term rebound from 122.36 is still expected to resume after consolidation from 152.82 completes. Firm break of 38.2% retracement of 196.85 to 122.36 at 150.43 will carry long term bullish implications. In that case, GBP/JPY could target 61.8% retracement at 167.78. However, break of 46.96 support will indicate rejection from 150.43 key fibonacci level. And the three wave corrective structure of rebound from 122.36 will argue that larger down trend is resuming for a new low below 122.26.
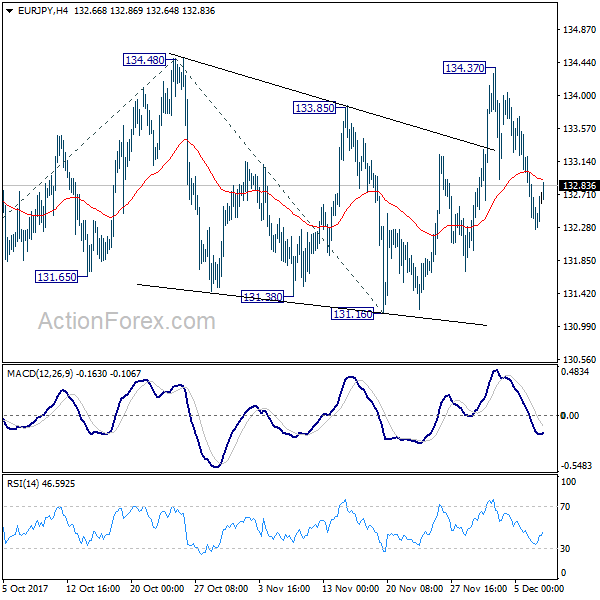
EUR/JPY Daily Outlook
Daily Pivots: (S1) 132.06; (P) 132.63; (R1) 133.01; More....
EUR/JPY recovers mildly today but it's staying in corrective trading below 134.37 temporary top. We're favoring the case that medium term up trend is nearly ready to resume. Break of 134.48 will target 61.8% projection of 127.55 to 134.48 from 131.16 at 135.44 and then 100% projection at 138.09. However, firm break of 131.16 support will now indicate near term trend reversal and turn outlook bearish for 127.55 key support.
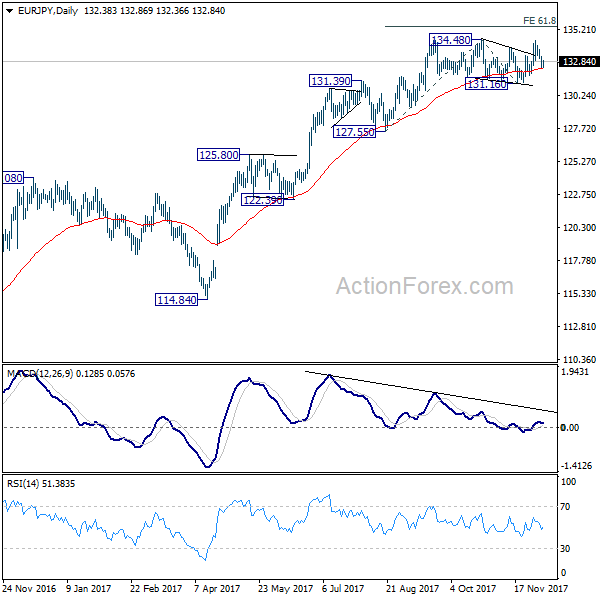
In the bigger picture, medium term rise from 109.03 (2016 low) is seen as at the same degree as the down trend from 149.76 (2014 high) to 109.03 (2016 low). 61.8% retracement of 149.76 to 109.03 at 134.20 is already met. Sustained break there will pave the way to key long term resistance zone at 141.04/149.76. However, break of 127.55 support will suggest medium term topping and will turn outlook bearish for deeper fall back to 114.84/124.08 support zone at least.
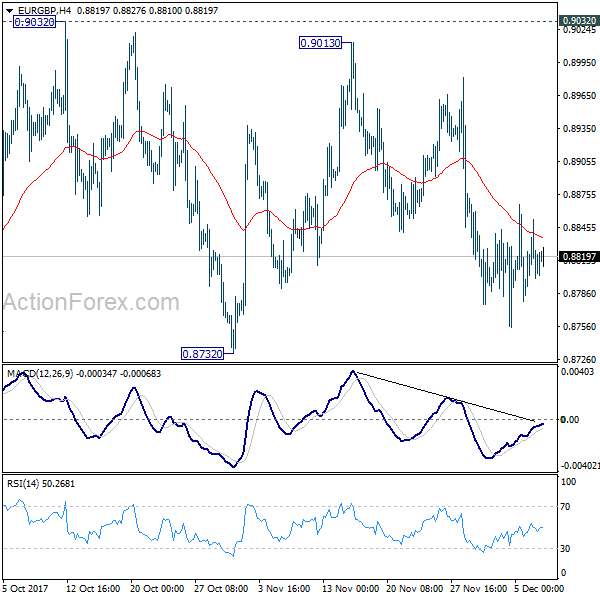
EUR/GBP Daily Outlook
Daily Pivots: (S1) 0.8780; (P) 0.8817; (R1) 0.8842; More...
No change in EUR/GBP's outlook as it's staying in range of 0.8732/9032. Intraday bias remains neutral and outlook stays bearish with 0.9032 resistance intact. That is, fall from 0.9305 is expected to resume later. Break of 0.8732 will target 0.8303 key support level. Nonetheless, decisive break of 0.9032 will confirm completion of the decline from 0.9305. In such case, intraday bias will be turned back to the upside for retesting 0.9305 key resistance.
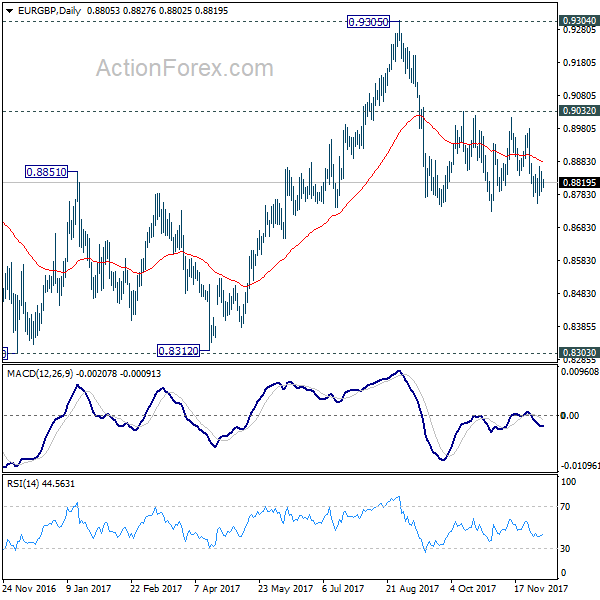
In the bigger picture, there are various ways to interpret price actions from 0.9304 high. But after all, firm break of 0.9304/5 is needed to confirm up trend resumption. Otherwise, range trading will continue with risk of deeper fall. And in that case, EUR/GBP could have a retest on 0.8303. But we'd expect strong support from 0.8116 cluster support (50% retracement of 0.6935 to 0.9304 at 0.8120) to contain downside.
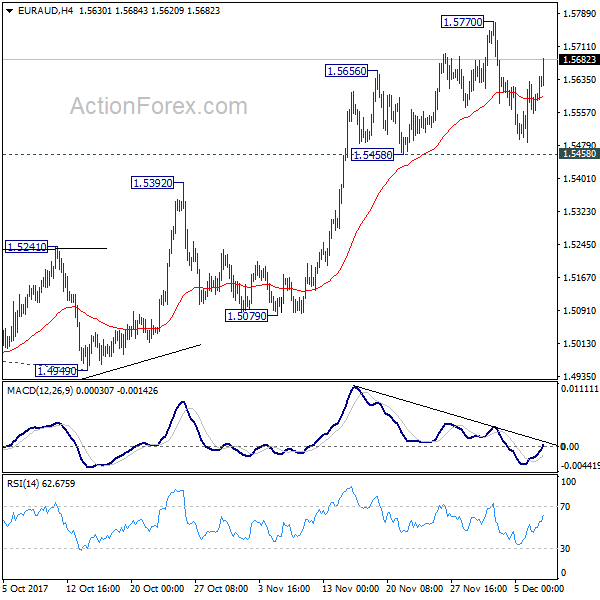
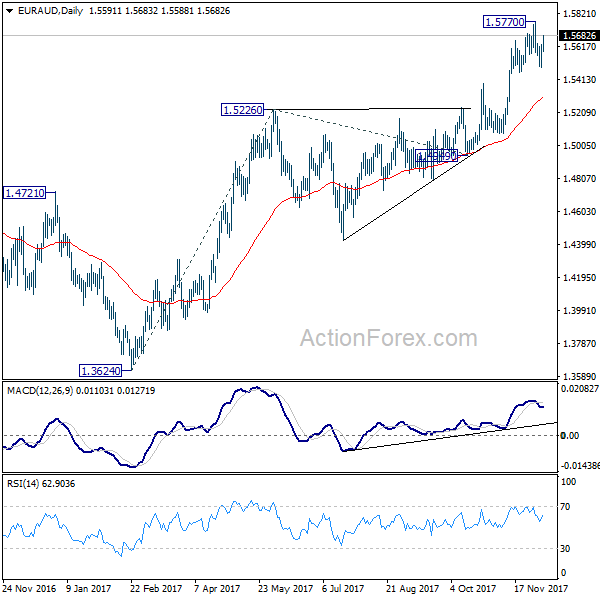
EUR/AUD Daily Outlook
Daily Pivots: (S1) 1.5507; (P) 1.5568; (R1) 1.5656; More....
EUR/AUD rebounds further today but it's staying below 1.5770 resistance. Intraday bias remains neutral first. Overall, price actions from 1.5770 is seen as a consolidation pattern. In case of another fall, we'd expect strong support above 1.5226 key support to bring rebound. Medium term rally is still expected to resume later and break of 1.5770 will target 61.8% projection of 1.3624 to 1.5226 from 1.4949 at 1.5939 first.
In the bigger picture, we're holding on to the view that corrective decline from 1.6587 medium term top (2015 high) has completed at 1.3624. Rise from 1.3624 is expected to extend to retest 1.6587. We'll hold on to this bullish view as long as 1.5226 resistance turned support holds. Firm break of 1.6587 will resume long term rise from 1.1602 (2012 low).