Sample Category Title
Pound Trading Flat In The Asian Session
For the 24 hours to 23:00 GMT, the GBP declined 0.25% against the USD and closed at 1.3383, after UK’s Chief Brexit negotiator, David Davis stated that “no quantitative assessment” was carried out to analyse the impact of Brexit on the British economy.
In the Asian session, at GMT0400, the pair is trading at 1.3383, with the GBP trading flat against the USD from yesterday’s close.
The pair is expected to find support at 1.3349, and a fall through could take it to the next support level of 1.3314. The pair is expected to find its first resistance at 1.3427, and a rise through could take it to the next resistance level of 1.3470.
Looking ahead, traders would focus on UK’s Halifax house prices data for November, slated to release in a few hours.
The currency pair is showing convergence with its 20 Hr moving average and trading below its 50 Hr moving average.

Japanese Yen Trading On A Weaker Footing In The Morning Session
For the 24 hours to 23:00 GMT, the USD declined 0.29% against the JPY and closed at 112.24.
In the Asian session, at GMT0400, the pair is trading at 112.38, with the USD trading 0.12% higher against the JPY from yesterday's close.
Earlier today, data showed that Japan's preliminary leading economic index fell to a level of 106.1 in October, meeting market expectations. The index had recorded a level of 106.4 in the previous month. On the contrary, the nation's flash coincident index unexpectedly climbed to a level of 116.5 in October, after registering a level of 116.2 in the prior month and defying market consensus for the index to record a steady reading.
The pair is expected to find support at 112.08, and a fall through could take it to the next support level of 111.79. The pair is expected to find its first resistance at 112.58, and a rise through could take it to the next resistance level of 112.79.
Moving ahead, Japan's final 3Q GDP numbers along with trade balance (BOP basis) for October, scheduled to release overnight, will be on investors' radar.
The currency pair is trading above its 20 Hr moving average and showing convergence with its 50 Hr moving average.

Switzerland’s Consumer Prices Surprisingly Dropped In November
For the 24 hours to 23:00 GMT, the USD rose 0.22% against the CHF and closed at 0.9895.
The Swiss Franc declined against the USD, after data indicated that Switzerland's consumer price index (CPI) unexpectedly fell 0.1% MoM in November, confounding market expectations for a flat reading. The CPI had recorded a gain of 0.1% in the prior month.
In the Asian session, at GMT0400, the pair is trading at 0.9895, with the USD trading flat against the CHF from yesterday's close.
The pair is expected to find support at 0.9863, and a fall through could take it to the next support level of 0.9832. The pair is expected to find its first resistance at 0.9918, and a rise through could take it to the next resistance level of 0.9942.
Ahead in the day, Switzerland's unemployment rate data for November, will keep investors on their toes.
The currency pair is showing convergence with its 20 Hr moving average and trading above its 50 Hr moving average.

BoC Holds Interest Rate Steady At 1.0%
For the 24 hours to 23:00 GMT, the USD rose 0.76% against the CAD and closed at 1.2792.
The Canadian Dollar lost ground, after the Bank of Canada (BoC), at its latest monetary policy meeting, struck a cautious tone on further interest rate hikes.
The BoC, in a widely anticipated move, opted to leave the benchmark interest rate steady at 1.0%. In a statement accompanying its rate decision, the central bank stated that interest rate hikes will likely be required over time, citing encouraging job and wage growth, but reiterated that the Governing Council will continue to be 'cautious' about further rate hikes and added that any move will be based on the outlook for inflation and wage growth.
In the Asian session, at GMT0400, the pair is trading at 1.2801, with the USD trading 0.07% higher against the CAD from yesterday’s close.
The pair is expected to find support at 1.27, and a fall through could take it to the next support level of 1.26. The pair is expected to find its first resistance at 1.2854, and a rise through could take it to the next resistance level of 1.2908.
Moving ahead, investors would keep a close watch on Canada’s building permits data for October and Ivey–PMI for November, both due to release later today.
The currency pair is trading above its 20 Hr and 50 Hr moving averages.

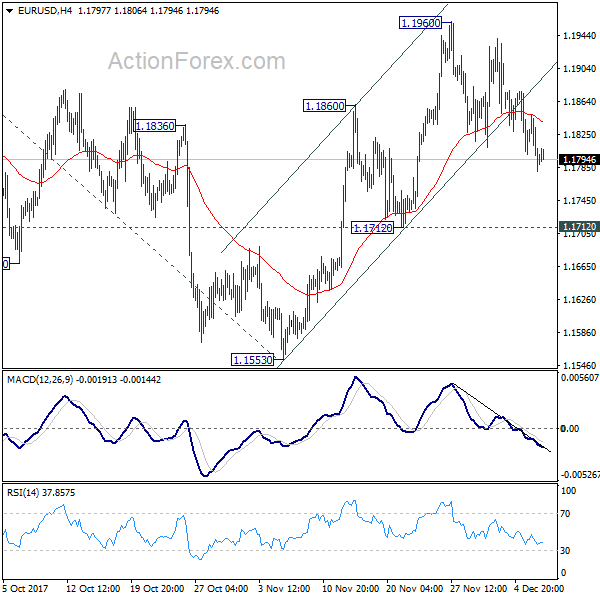
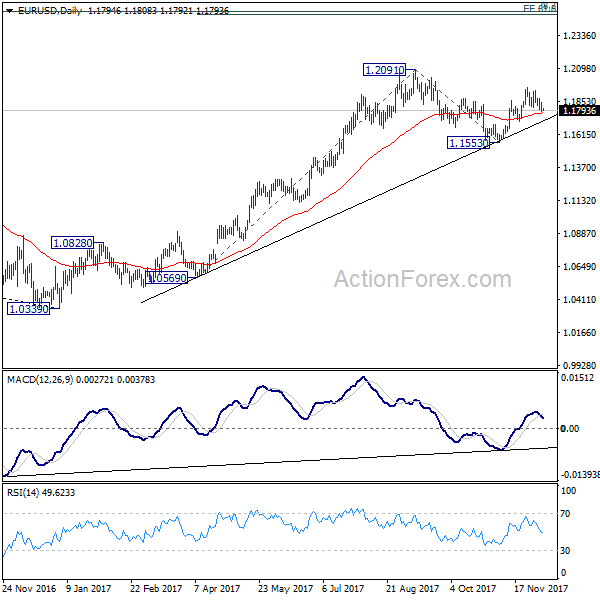
EUR/USD Daily Outlook
Daily Pivots: (S1) 1.1768; (P) 1.1807 (R1) 1.1835; More....
EUR/USD dips mildly lower today as pull back from 1.1960 extends. With 1.1712 support intact, fall from 1.1960 is viewed as a correction. Intraday bias stays neutral and another rise is expected. On the upside, break of 1.1960 will resume the rise from 1.1553 and target 1.2091 high first. Break there will resume medium term up trend from 1.0339 and target 61.8% projection of 1.0569 to 1.2091 from 1.1553 at 1.2494, which is close to 1.2516 long term fibonacci level. We'd expect strong resistance from there to bring reversal. On the downside, break of 1.1712 will indicate completion of the rise from 1.1553 and turn near term outlook bearish.
In the bigger picture, rise from 1.0339 medium term bottom is seen as a corrective move for the moment. Therefore, in case of another rally, we'd be expect 38.2% retracement of 1.6039 (2008 high) to 1.0339 (2017 low) at 1.2516 to limit upside and bring reversal. Meanwhile, sustained trading below 55 week EMA (now at 1.1393) will suggest that such medium term rebound is completed and could then bring retest of 1.0339 low.
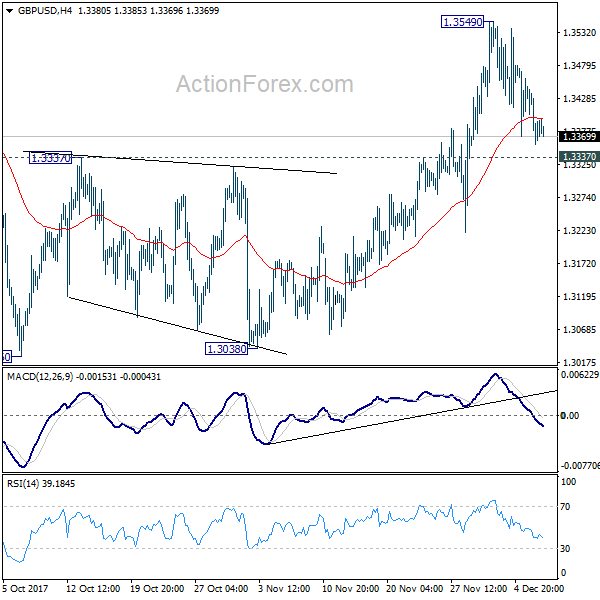
GBP/USD Daily Outlook
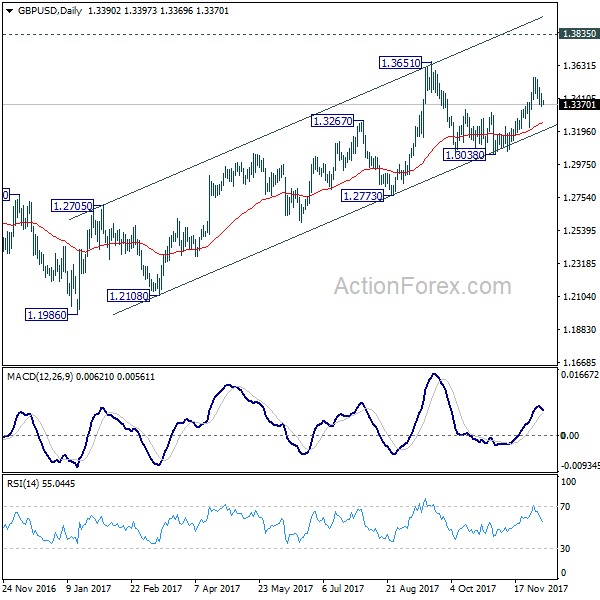
Daily Pivots: (S1) 1.3351; (P) 1.3397; (R1) 1.3436; More....
Intraday bias in GBP/USD remains neutral as it's staying in corrective pull back from 1.3549, held above 1.3337 resistance turned support. As long as 1.3337 remains intact, further rise is expected. Break of 1.3549 will target 1.3651 high and above. However, decisive break of 1.3337 will argue that rise from 1.3038 has completed and turn bias back to the downside for this support.
In the bigger picture, while the medium term rebound from 1.1946 low is strong, it's still limited below 1.3835 key support turned resistance. As long as 1.3835 holds, we'd view such rebound as a correction. That is, we'd expect another leg in the long term down trend through 1.1946 low. However, sustained break of 1.3835 should at least send GBP/USD to 38.2% retracement of 2.1161 (2007 high) to 1.1946 (2016 low) at 1.5466.
USD/CHF Daily Outlook
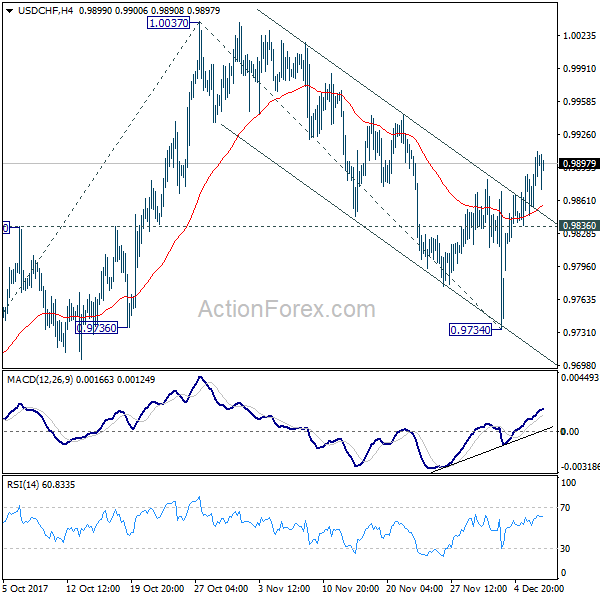
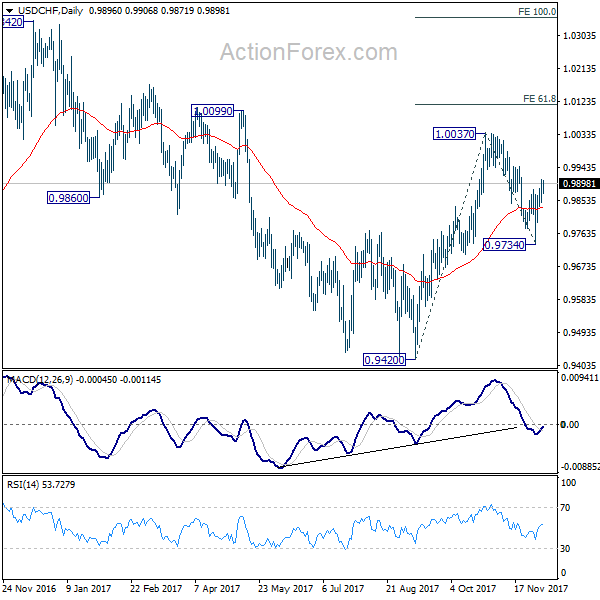
Daily Pivots: (S1) 0.9844; (P) 0.9865; (R1) 0.9894; More....
Intraday bias in USD/CHF remains on the upside for the moment. The pull back from 1.0037 should have completed at 0.9734 already. Further rise should be seen back to retest 1.0037. Break will resume whole rise from 0.9420 and target 61.8% projection of 0.9420 to 0.9734 from 1.0047 at 1.0115. On the downside, below 0.9836 minor support will dampen the bullish case and turn bias back to the downside for 0.9374 instead.
In the bigger picture, range trading continues between 0.9420/1.0342. At this point, 0.9420 appears to be a strong support level. Therefore, in case of decline attempt, we don't expect a firm break of this level. Nonetheless, strong break of 1.0342 is also needed to confirm upside momentum. Otherwise, medium term outlook will stay neutral.
USD/JPY Daily Outlook
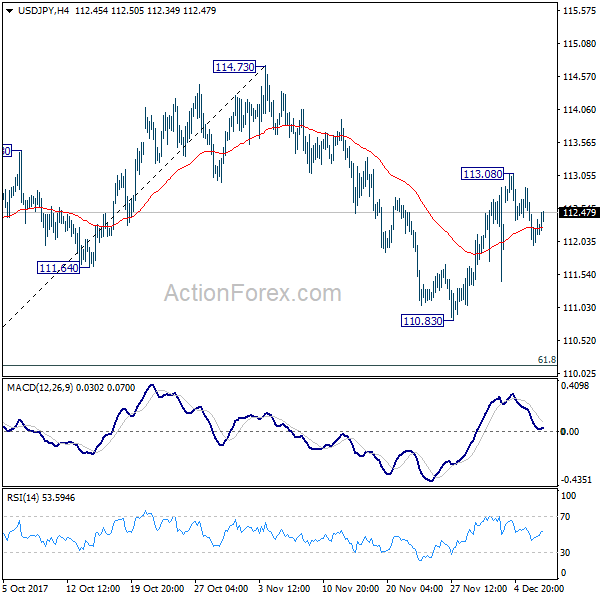
Daily Pivots: (S1) 111.97; (P) 112.29; (R1) 112.61; More...
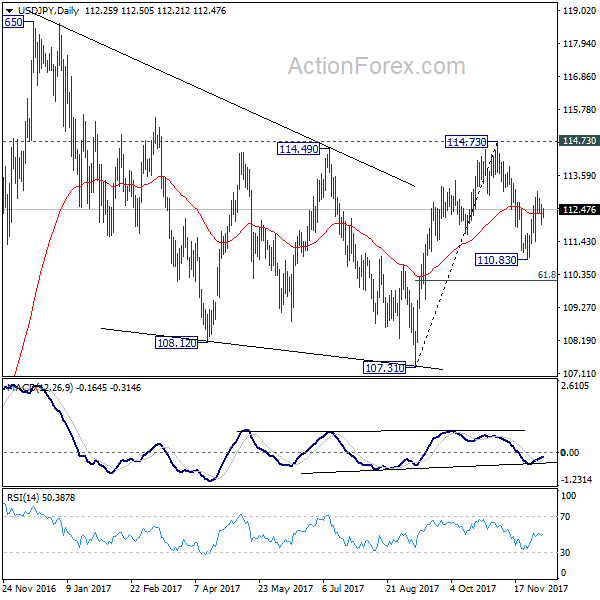
Outlook in USD/JPY remains mixed with neutral intraday bias. On the upside, above 113.08 will extend the rebound from 110.83 to retest 114.73 key resistance. Decisive break there will extend the rally from 107.31 to retest 118.65 high. On the downside, break of 110.83 will resume the decline from 114.73 instead. But in that case, we'll look for bottoming again below 61.8% retracement of 107.31 to 114.73 at 110.14.
In the bigger picture, we're holding on to the view that correction from 118.65 is completed a 107.31. And medium term rise from 98.97 (2016 low) is resuming. Sustained break of 114.73 should affirm our view and send USD/JPY through 118.65. However, break of 107.31 will dampen this will and extend the medium term fall back to 98.97 low.
USD/CAD Daily Outlook
Daily Pivots: (S1) 1.2637; (P) 1.2670; (R1) 1.2724; More....
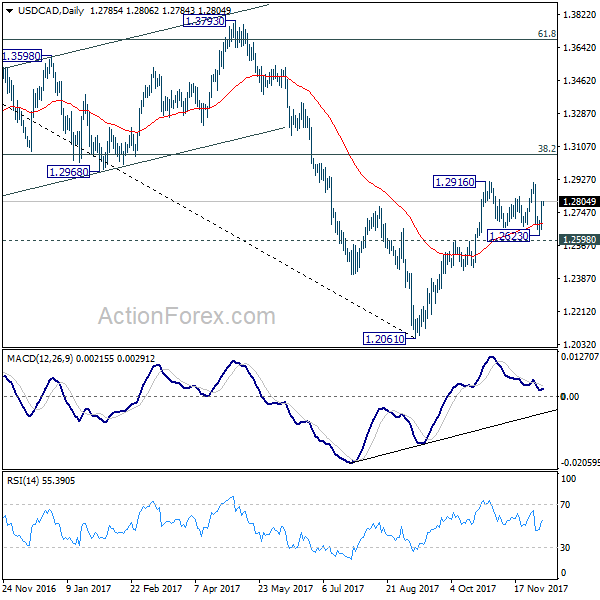
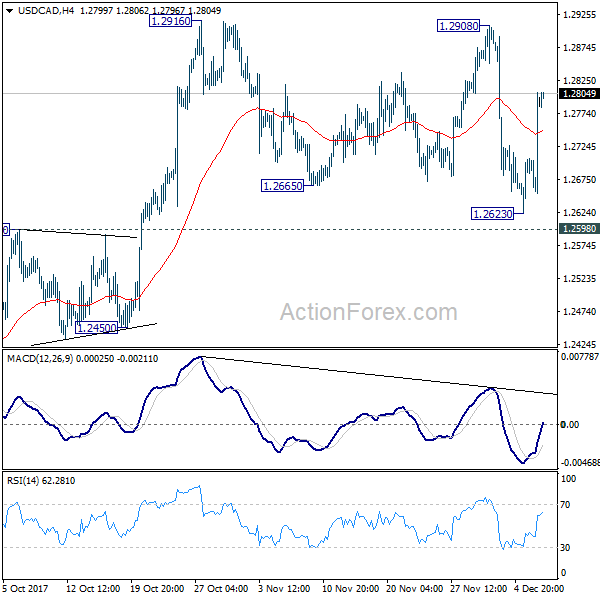
USD/CAD's strong rebound and suggests that consolidation from 1.2916 could have completed with three waves down to 1.2623. Intraday bias is back on the upside for 1.2916 resistance first. Break there will resume the rally from 1.2061 and target 1.3065 medium term fibonacci level next. In any case, near term outlook will remain bullish as long as 1.2598 resistance turned support holds.
In the bigger picture, USD/CAD should have defended 50% retracement of 0.9406 (2011 low) to 1.4689 (2016 high) at 1.2048. And with 1.2048 intact, we'd favor the case that fall from 1.4689 is a correction. Rise from 1.2061 medium term bottom should now target 38.2% retracement of 1.4689 to 1.2061 at 1.3065. Firm break there will target 1.3793 key resistance next (61.8% retracement at 1.3685). We'll now hold on to this bullish view as long as 1.2450 support holds.
Elliott Wave View: Nasdaq Intra-Day
Nasdaq Intraday Elliott Wave view suggests that rally to 6429.5 ended Intermediate wave (3). Intermediate wave (4) pullback is currently in progress to correct cycle from 8/21 low (5753.6) in 3, 7, or 11 swing before the rally resumes. Subdivision of Intermediate wave (4) is unfolding as a double three Elliott wave structure where Minor wave W ended at 6246 and Minor wave X ended at 6391.75. Minor wave Y of (4) is still missing the 100% area at 6096.24 – 6209.28, thus another leg lower still can't be ruled out. Index should then resume the rally higher or bounce in 3 waves at least.
We don't like selling the proposed pullback and expect buyers to appear from the above area for at least a 3 waves bounce provided that pivot at 8/21 low (5753.6) stays intact. Alternatively, cycle from 11/29 peak has ended at 6231.75 low and in this case the Index is already in the process of correcting the decline from 11/29 in a larger 3 waves at least.
NQ_F Nasdaq 1 Hour Elliott Wave Chart