Sample Category Title
Canada’s GDP contracts -0.2% mom in Nov, but Dec outlook improves
Canada’s economy shrank by -0.2% mom in November, marking the largest contraction since December 2023 and coming in weaker than expectations of -0.1% mom decline. The downturn was broad-based, with 13 of 20 sectors reporting declines, underscoring underlying weakness across multiple industries.
Goods-producing industries led the slowdown, contracting by -0.6% after a strong 0.9% expansion in October. Services sector, which had posted steady gains in previous months, also slipped by -0.1%, marking its first decline in six months.
Advance estimates suggest that real GDP expanded by 0.2% mom in December, pointing to a rebound. Growth was driven by gains in retail trade, manufacturing, and construction, though this was partially offset by weakness in transportation, real estate, and wholesale trade.
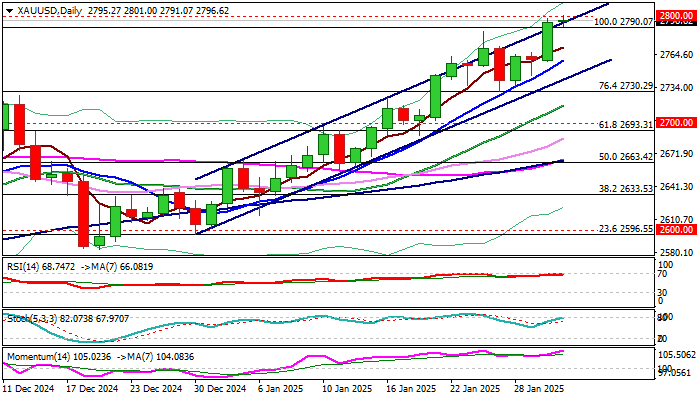
XAU/USD: Fresh Safe Haven Demand Lifts Gold Price to New Record High
Gold price posted new record high on Friday, following a probe through psychological $2800 barrier, in extension of Thursday’s 1.3% advance.
The bullion benefited from fresh safe haven demand on renewed tariff threats from President Trump that the US would impose 25% duty on imports from Canada and Mexico, while still considering tariffs on imports of goods from China.
Weaker than expected US economic growth in the last three months of 2024 and elevated inflation, also contribute to increased demand, along with rising demand for physical gold, mainly from the central banks.
Technical picture remains bullish on all larger timeframes and underpins the action, with clear break of $2800 trigger to open way towards projected targets at $2850, $2890 and $2946 and unmask psychological $3000 barrier, which I pointed as a target in my comments last year.
Gold is on track for a monthly gain of over 6% in January (the biggest monthly advance since March 2024) and would also register the fifth consecutive bullish weekly close.
However, $2800 marks significant resistance and accompanied by overbought conditions, may keep the price in extended and likely shallow consolidation, before larger bulls resume.
Former top at $2790 marks immediate support, followed by $2770 (5DMA) and $2758 (rising 10DMA) which should contain potential deeper dips.
Res: 2801; 2850; 2890; 2946.
Sup: 2790; 2785; 2770; 2758.
Tokyo Core Inflation Hits One-Year High, Yen Lower
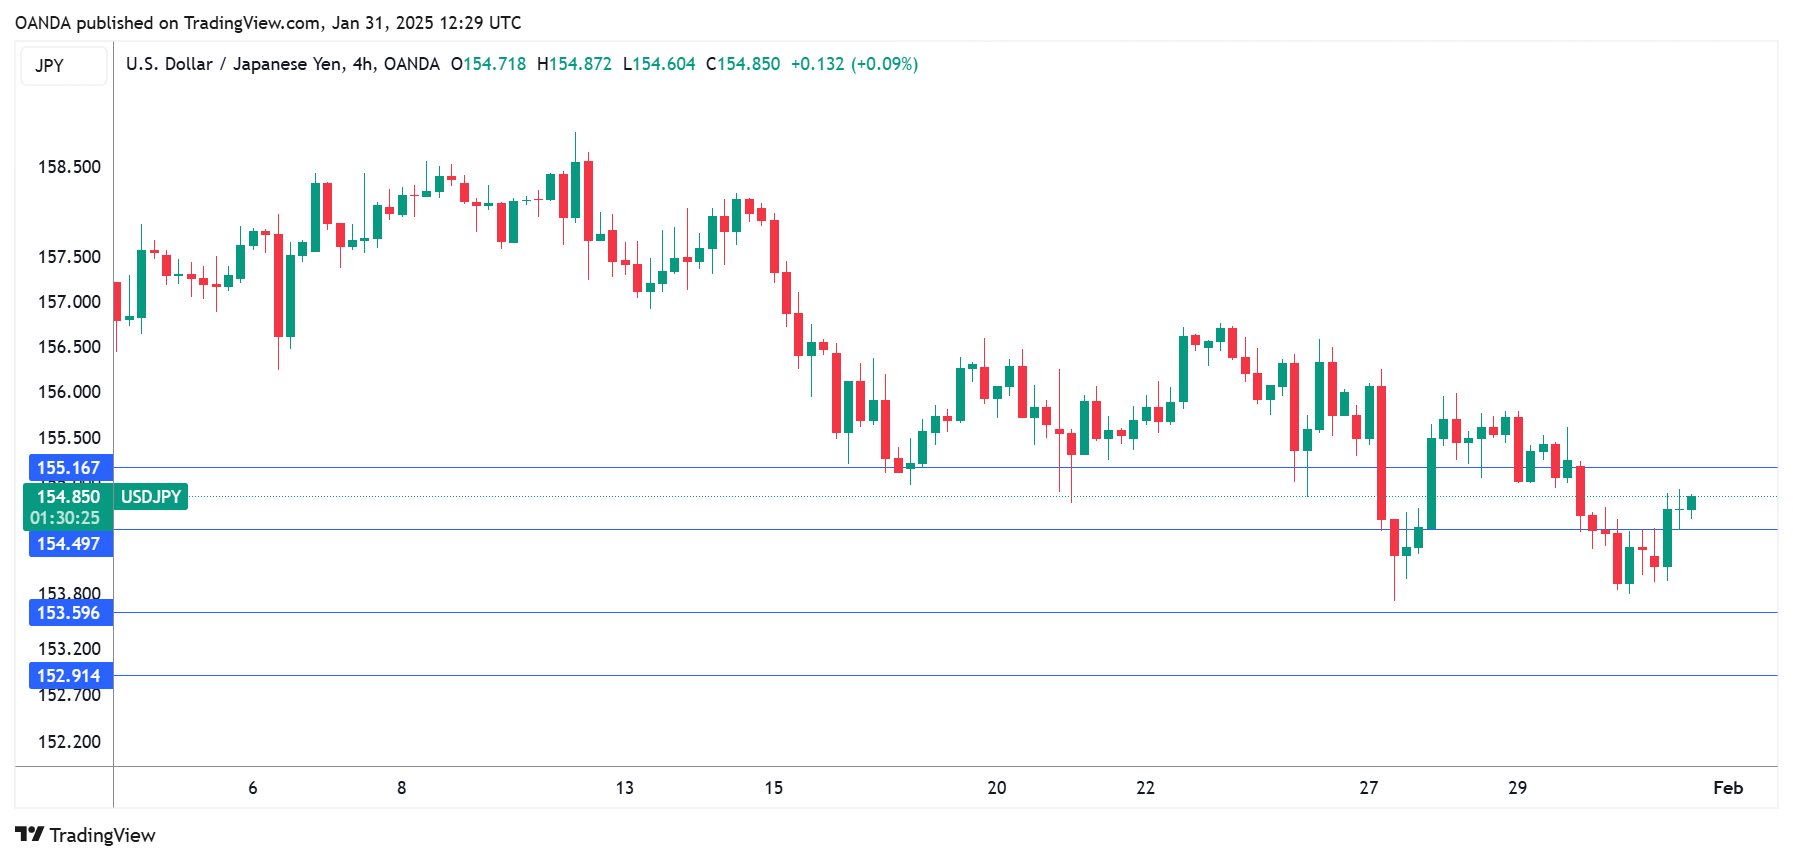
The Japanese yen has reversed directions on Friday and has edged lower. In the European session, USD/JPY is trading at 154.73, up 0.28% on the day.
Tokyo core CPI rises 2.5%
Japan’s Tokyo’s core inflation rate accelerated to 2.5% y/y in January, up from 2.4% in December and in line with market expectations. This marked the highest level since February 2024 and reflects rising inflationary pressure. Tokyo CPI jumped to 3.4% y/y, its highest in almost two years, as food prices rose sharply.
Tokyo core CPI is closely monitored by Bank of Japan policymakers and supports last week’s central bank decision to raise interest rates by a quarter point to 0.50%. The current cash rate is far below other central banks but is the highest in Japan since the global financial crisis in 2008.
At the meeting, the BoJ revised higher its inflation forecasts and also hinted at further rate hikes. Deputy Governor Himino echoed this stance earlier this week, stating that the BoJ would consider further hikes if economic and inflation data continued to move in accordance with the Bank’s projection. This flurry of hints about rate hikes is unusual for the BoJ, which tends to reveal little and keep speculators in the dark about its rate plans.
This secretive approach often results in sharp volatility from the yen after BoJ meetings, and Bank policymakers may be looking to avoid further sharp swings from the yen. It seems clear that further rate hikes are a question of time as the BoJ moves forward, albeit cautiously, towards normalization. The BoJ meets next on March 19 and investors will be looking for more clues about a possible rate hike at that time.
USD/JPY Technical
- USD/JPY has pushed above resistance at 154.48. Next, there is resistance at 155.16
- 153.59 and 152.91 are the next support levels
Crypto: Quiet Recovery
Market Picture
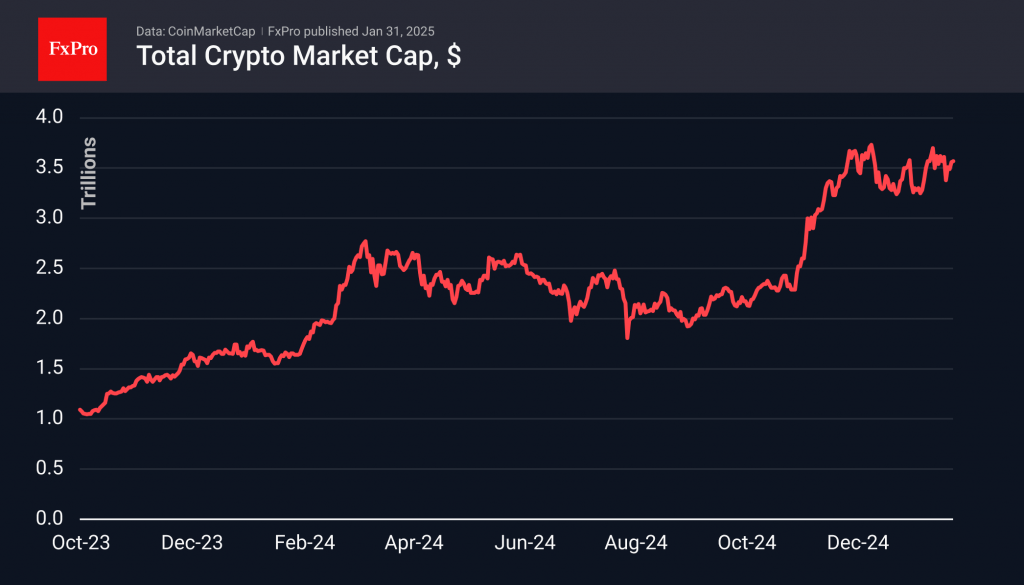
The crypto market has increased by 0.4% to $3.57 trillion over the last 24 hours but is still 1.4% below last week’s levels. Cryptocurrencies are slowly and rather erratically climbing out of the dip they fell into on Monday. The market remains sensitive to negative news but is recovering cautiously, avoiding excessive optimism.
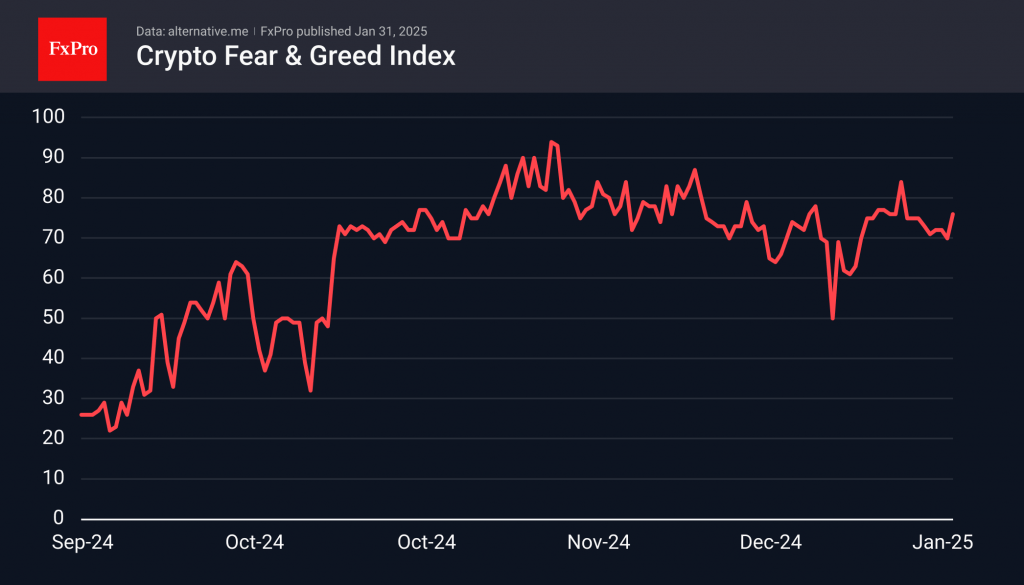
The sentiment index on Friday reached 76 (extreme greed)—the highest level in the last two and a half weeks. Although the absence of clearly expressed FOMO may not please the bulls, who were hoping for a quick profit like previous bullish cycles, such an ascent is often more sustainable in traditional markets.
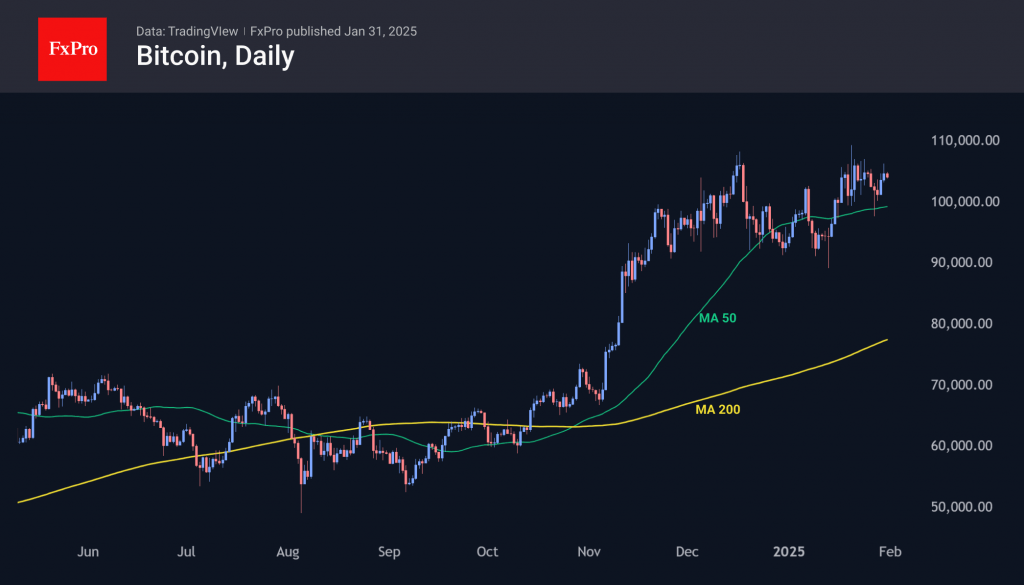
On Thursday, Bitcoin exceeded the level of $106,000, but by Friday, it once again rolled back closer to $104,000. This decline indicates the caution of players approaching historical highs. It seems that many prefer to fix profits near the peaks over the last few weeks.
News Background
BTC was pressured by miners selling 20,000 BTC (~$2 billion) in mid-January. Holders sold about 75,000 BTC (~$7.5 billion) over the past week, according to Martinez.
Glassnode notes a slowdown in BTC sales by long-term investors. CryptoQuant notes that leverage in bitcoin derivatives has not reached the extreme values observed during the 2021 rally.
According to Bitwise, following historical patterns, Bitcoin is expected to exceed $200,000 in 2025 due to demand for BTC-ETF and asset purchases by corporations and governments of certain countries.
At the end of the fourth quarter of last year, Tesla made a “paper” profit of $589 million from retained bitcoins. As a result, the net profit for the period amounted to $2.3 billion and $7.1 billion for 2024 overall. According to Arkham Intelligence, Tesla holds 11,509 BTC (~$1.21 billion).
The Salvadoran parliament quickly approved a bill to amend the country’s bitcoin strategy, according to agreements with the IMF, from which El Salvador will receive a $1.4 billion loan. Currently, the country holds 6,049 BTC ($635 million).
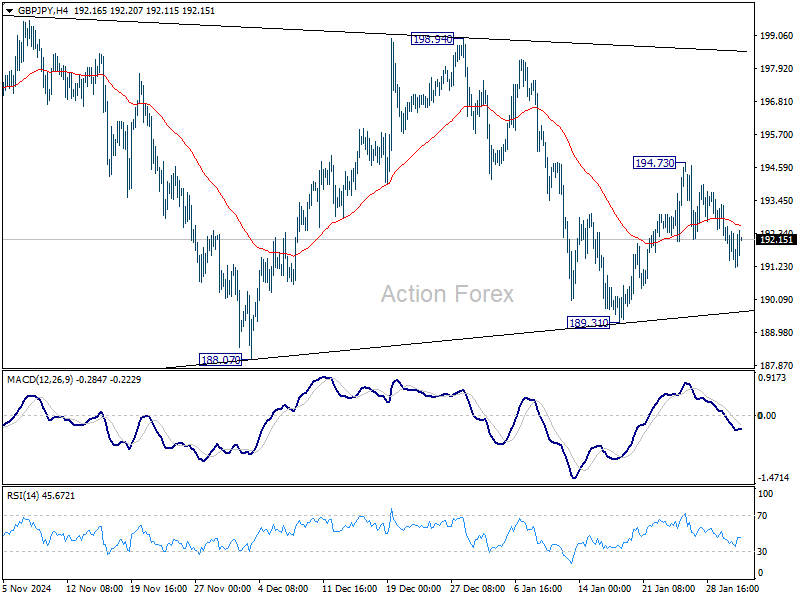
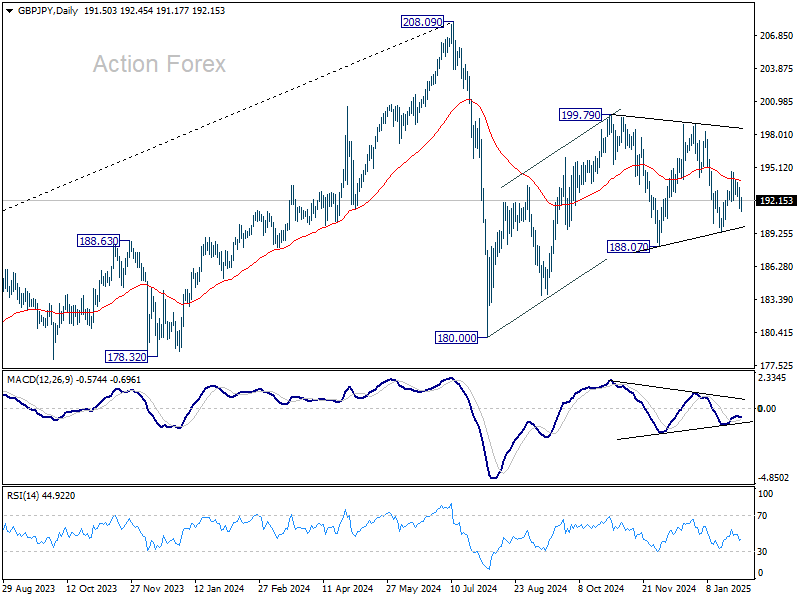
GBP/JPY Daily Outlook
Daily Pivots: (S1) 190.87; (P) 192.10; (R1) 192.78; More...
Intraday bias in GBP/JPY remains mildly on the downside for 189.31 support. Firm break there will suggest that corrective pattern from 180.00 has completed. But before that, the pattern could still extend. Break of 194.73 will bring stronger rebound instead.
In the bigger picture, price actions from 208.09 are seen as a correction to whole rally from 123.94 (2020 low). The range of consolidation should be set between 38.2% retracement of 123.94 to 208.09 at 175.94 and 208.09. However, decisive break of 175.94 will argue that deeper correction is underway.
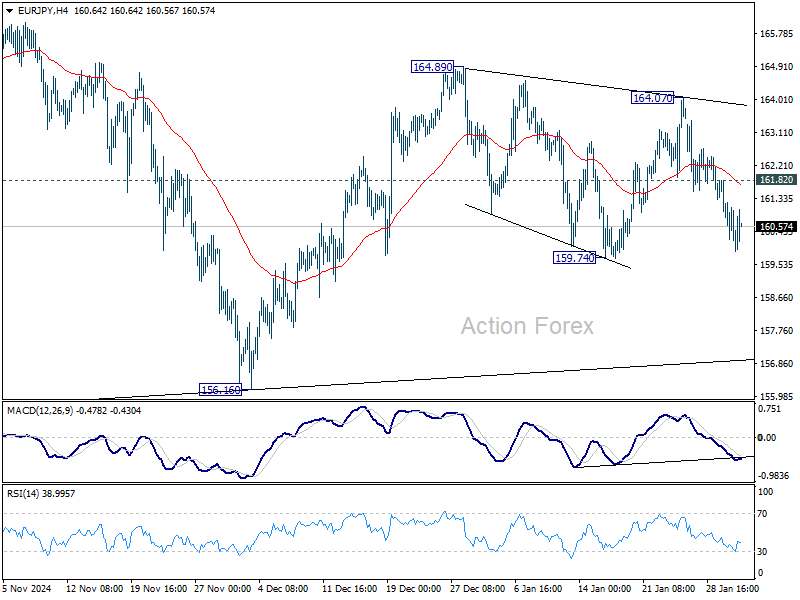
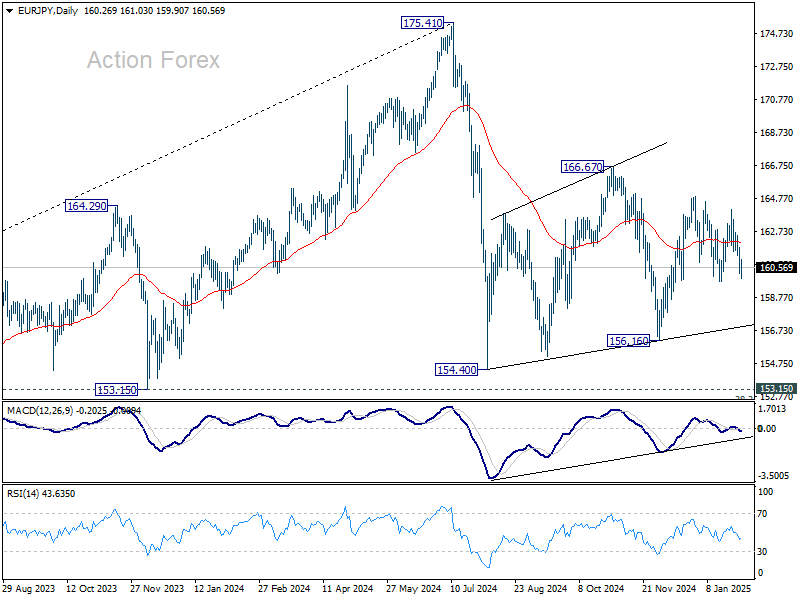
EUR/JPY Daily Outlook
Daily Pivots: (S1) 159.75; (P) 160.78; (R1) 161.36; More...
EUR/JPY's fall from 164.07 is in progress and intraday bias stays neutral. Firm break of 159.74 will target 156.16 support next. On the upside, above 161.82 minor resistance will turn intraday bias neutral again. Overall, price actions from 154.40 are seen as a corrective pattern, which might still extend further.
In the bigger picture, price actions from 175.41 are seen as correction to rally from 114.42 (2020 low). The range of consolidation should have been set between 38.2% retracement of 114.42 to 175.41 at 152.11 and 175.41 high. However, decisive break of 152.11 would argue that deeper correction is underway.
EUR/GBP Daily Outlook
Daily Pivots: (S1) 0.8357; (P) 0.8373; (R1) 0.8387; More...
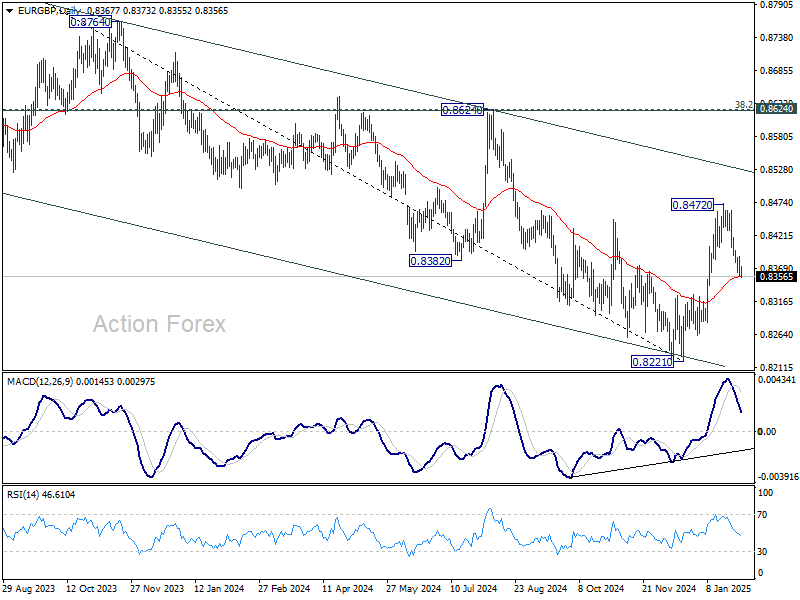
EUR/GBP's fall from 0.8472 is in progress and intraday bias stays on the downside. Sustained break of 55 D EMA (now at 0.8355) will argue that whole rebound from 0.8221 has completed at 0.8472 as a corrective move. Nevertheless, strong bounce from the 55 D EMA, followed by break of 0.8397 minor resistance, will argue that the pull back has completed and bring retest of 0.8472.
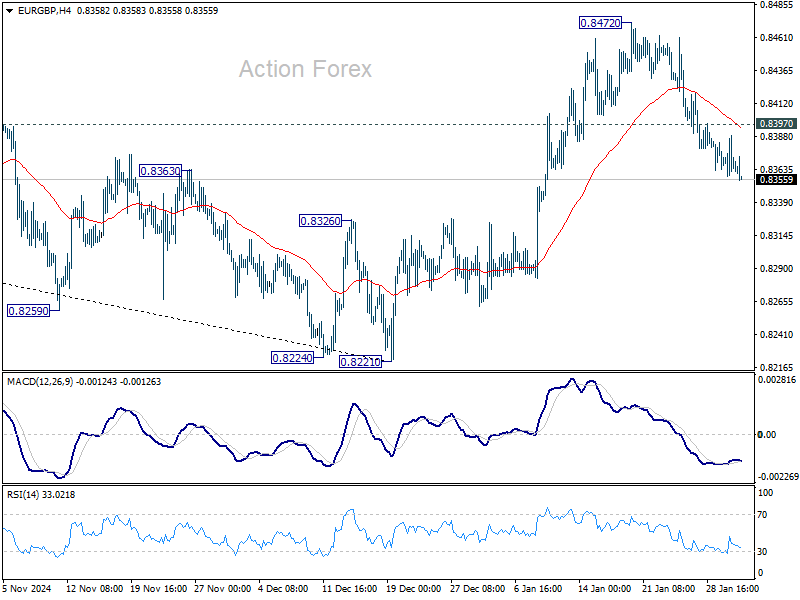
In the bigger picture, a medium term bottom should be in place at 0.8221, just ahead of 0.8201 key support (2022 low). Sustained trading above 55 W EMA (now at 0.8442) will pave the way to 0.8624 cluster zone (38.2% retracement of 0.9267 to 0.8221 at 0.8621), even just as a correction to the down trend from 0.9267 (2022 high). But still, medium term outlook will be neutral at best as long as 0.8621/4 holds.
EUR/AUD Daily Outlook
Daily Pivots: (S1) 1.6690; (P) 1.6735; (R1) 1.6782; More...
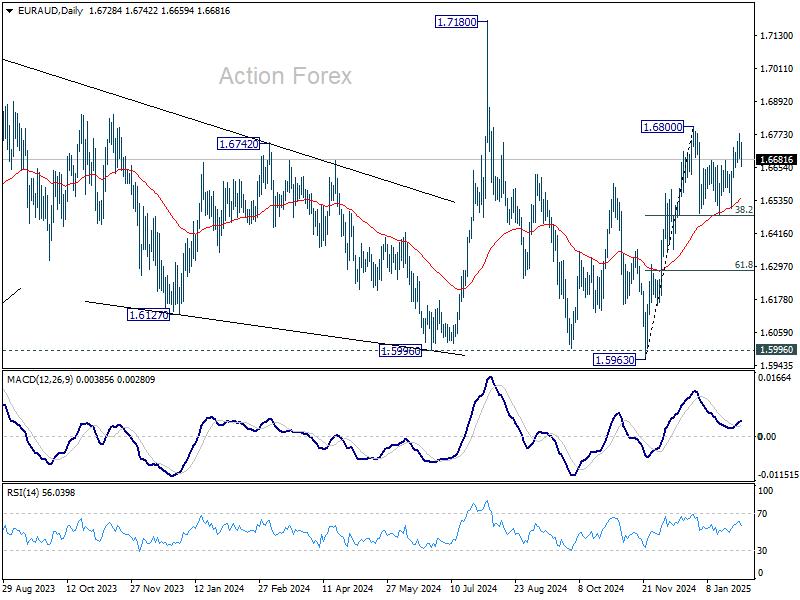
EUR/AUD failed to break through 1.6800 resistance and retreated. Intraday bias remains neutral for the moment. In case of another dip, strong support is expected from 38.2% retracement of 1.5963 to 1.6800 at 1.6480 to contain downside. On the upside, firm break of 1.6800 will resume the rally from 1.5963. However, sustained break of 1.6480 will bring deeper correction 61.8% retracement at 1.6283 instead.
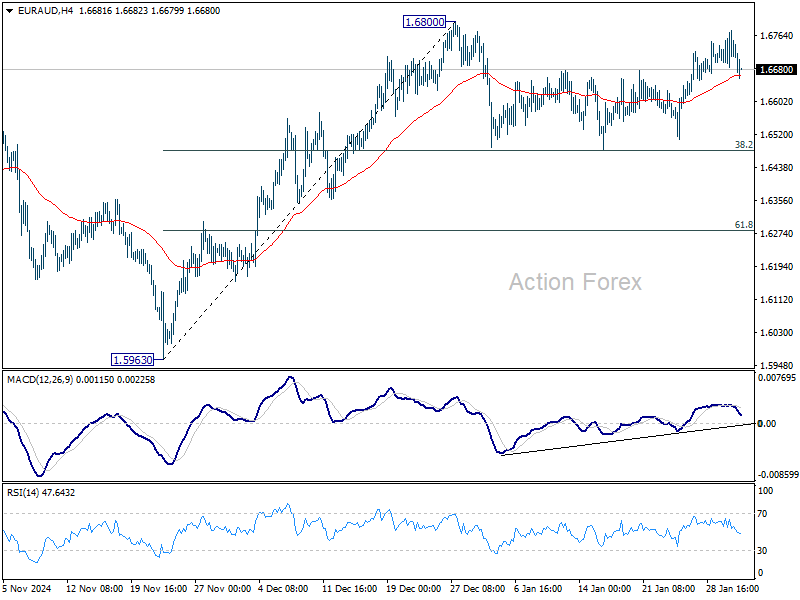
In the bigger picture, EUR/AUD is holding on to 1.5996 key support (2024 low) despite brief breach. Larger up trend from 1.4281 (2022 low) is still in favor to resume through 1.7180 at a later stage. Nevertheless, sustained break of 1.5996 will indicate that such up trend has completed and deeper decline would be seen.
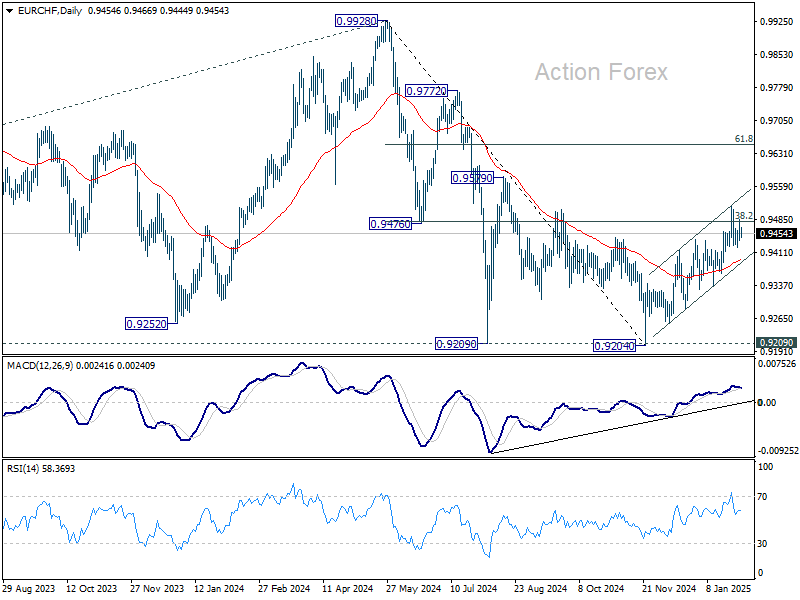
EUR/CHF Daily Outlook
Daily Pivots: (S1) 0.9433; (P) 0.9459; (R1) 0.9481; More....
Intraday bias in EUR/CHF stays neutral for the moment. On the downside, firm break of 0.9424 support will indicate rejection by 38.2% retracement of 0.9928 to 0.9204 at 0.9481. Deeper fall would then be seen back to channel support (now at 0.93877). However, strong rebound from current level will keep the choppy rally from 0.9204 intact.
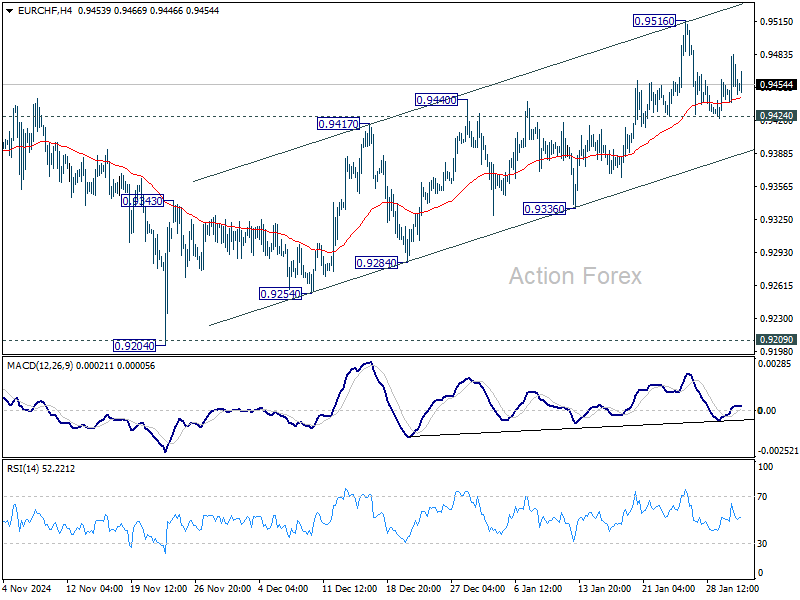
In the bigger picture, fall from 0.9928 should have completed at 0.9204 with the current strong rebound, after failing to sustain below 0.9252 (2023 low). It's still early to confirm long term bullish reversal. But even as a corrective move, current rebound could extend to 61.8% retracement of 0.9928 to 0.9204 at 0.9651. On the downside, firm break of 55 D EMA (now at 0.9390) will maintain medium term bearishness and bring retest of 0.9204 low.
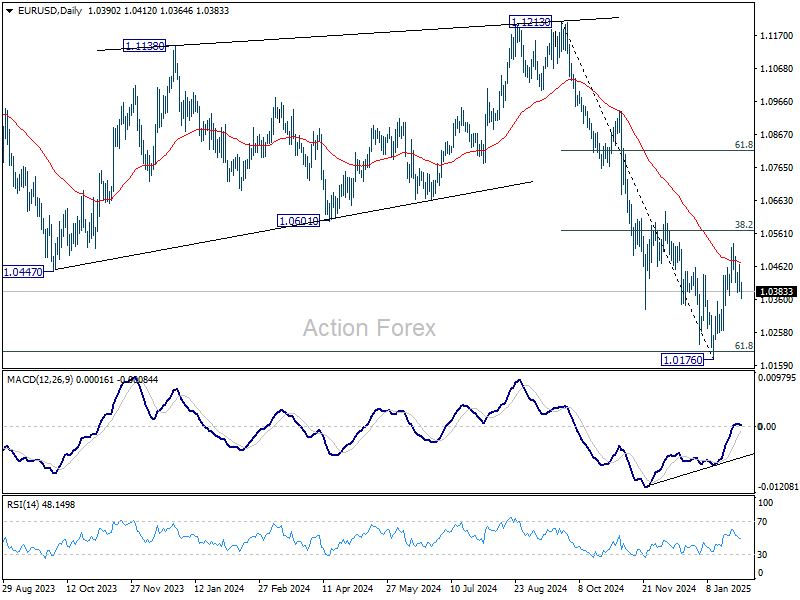
EUR/USD Daily Outlook
Daily Pivots: (S1) 1.0363; (P) 1.0415; (R1) 1.0445; More...
Intraday bias in EUR/USD remains neutral for the moment. On the downside, break of 1.0371 support will indicate rejection by 38.2% retracement of 1.1213 to 1.0176 at 1.0572 and retain near term bearishness. Retest of 1.0176 low should be seen next. On the upside, though, decisive break of 1.0572 will raise the chance of bullish reversal, and target 61.8% retracement at 1.0817.
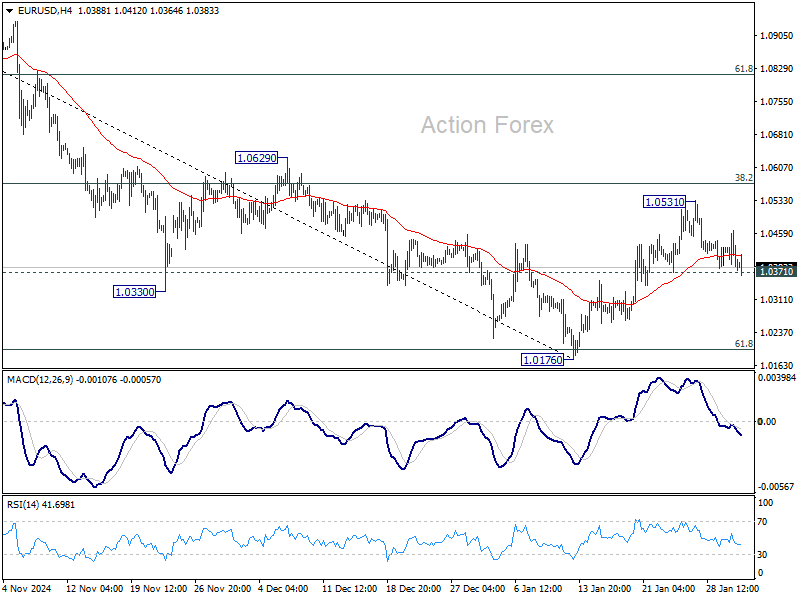
In the bigger picture, outlook is mixed as fall from 1.1274 (2023 high) could either be the second leg of the corrective pattern from 0.9534 (2022 low), or another down leg of the long term down trend. Strong support from 61.8 retracement of 0.9534 to 1.1274 at 1.0199 will favor the former case, and sustained break of 55 W EMA (now at 1.0722) will argue that the third leg might have started. However, sustained trading below 1.0199 will favor the latter case and bring retest of 0.9534 low.