
Sample Category Title
U.S. Economic Growth Eased But Remained Healthy at the End of 2024
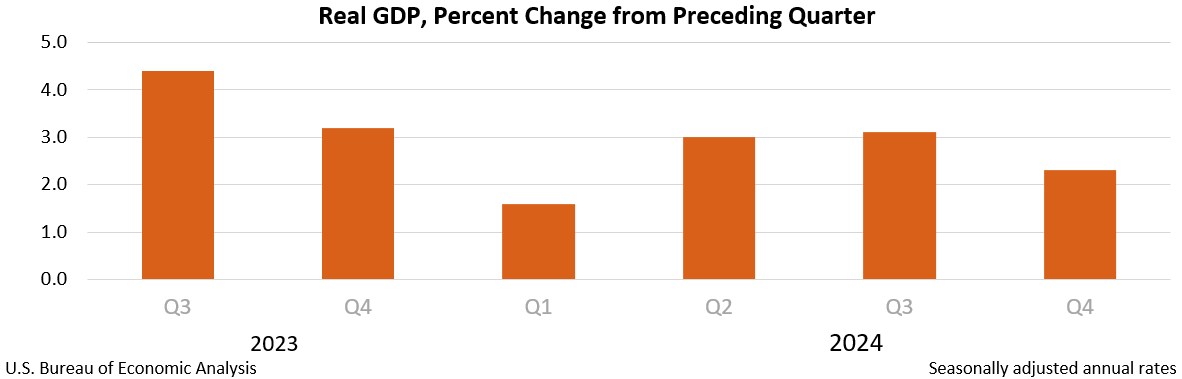
The U.S. economy expanded by 2.3% quarter-on-quarter (q/q, annualized) in the fourth quarter, a touch lower than the consensus forecast of 2.6%. Growth for 2024 as a whole was 2.8%, showing little slowing from 2023's 2.9% pace.
Consumer spending defied expectations for a slowdown, accelerating to 4.2% q/q from 3.7% in the previous quarter. The gain was driven by goods spending (+6.6% q/q), and more specifically a 12% gain in durable goods outlays. Spending on services grew by a healthy 3.1%, up from 2.8% in Q3.
Gross private domestic investment was a drag, falling 5.6% q/q. Looking at the details, non-residential investment was down 2.2% – largely on the back of a 7.8% decline in equipment spending, which came after two solid quarters of growth. Structures also fell 1.1%, while investment in intellectual property products grew 2.6%. On the other hand, residential investment improved after two quarters of contraction, rising 5.3% q/q.
Government spending provided a boost, growing at 2.5% q/q, even as this marked a deceleration from the 5.1% pace in the previous quarter. State & local government spending eased to 2% from 2.9% previously.
On international trade, both imports and exports retreated by 0.8 q/q. The end result was a wash, with net trade leading to a miniscule positive fillip for GDP.
Final domestic demand was up a healthy 3.1% q/q, a deceleration from Q3's gain of 3.7%. Headline GDP growth was held back by weaker inventory investment, which subtracted 0.9 percentage points from the overall tally last quarter.
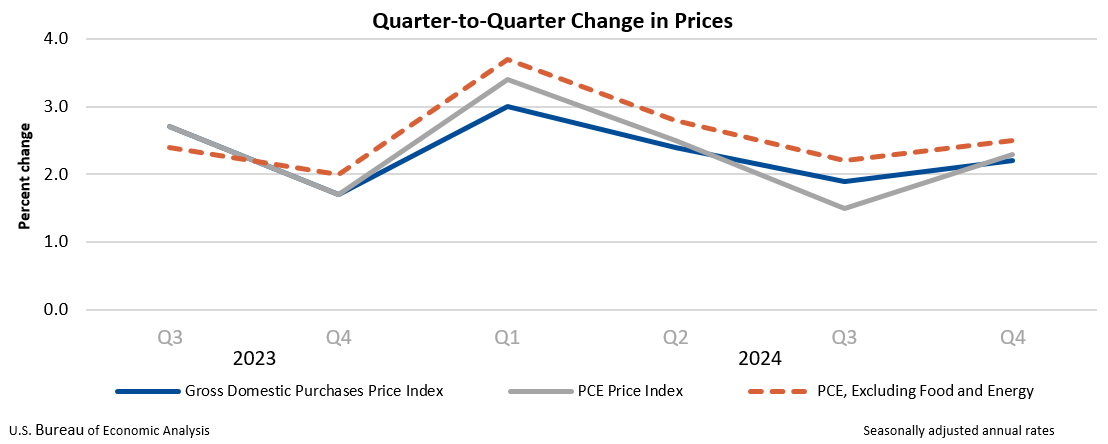
Core PCE inflation – the Fed's preferred inflation gauge – rose to 2.5% q/q (annualized), a mild acceleration from Q3's 2.2% pace.
Key Implications
The U.S. economy notched another solid quarter at the end of 2024, even as growth eased a touch from the stronger pace experienced in the third quarter. Non-residential investment and inventories weighed on growth, but the consumer helped save the day, powering growth with another outsized gain in goods spending. A meaningful improvement in residential investment also helped provide some support. The fact that the economy basically sustained 2023's pace into 2024 is an impressive accomplishment in the face of what is still an elevated interest rate environment.
While there's still plenty of uncertainty with changes coming out of Washington, we anticipate a more trend-like pace of growth of around 2% for the year ahead. This as the economic cycle matures, and some of the positive growth impulses from policies such as deregulation are offset by more restrictive policies on trade and immigration. Additionally, efforts to rein in government spending suggest that the fiscal growth-dividend that helped boost growth in previous years – such as in 2018-19 thanks to the Tax Cuts and Jobs Act (TCJA) – may not be there to prop up this economy this time around, reinforcing the case for a more trend-like pace of growth
EUR/USD Stable as the Market Absorbs Fed Decision and Awaits ECB Meeting
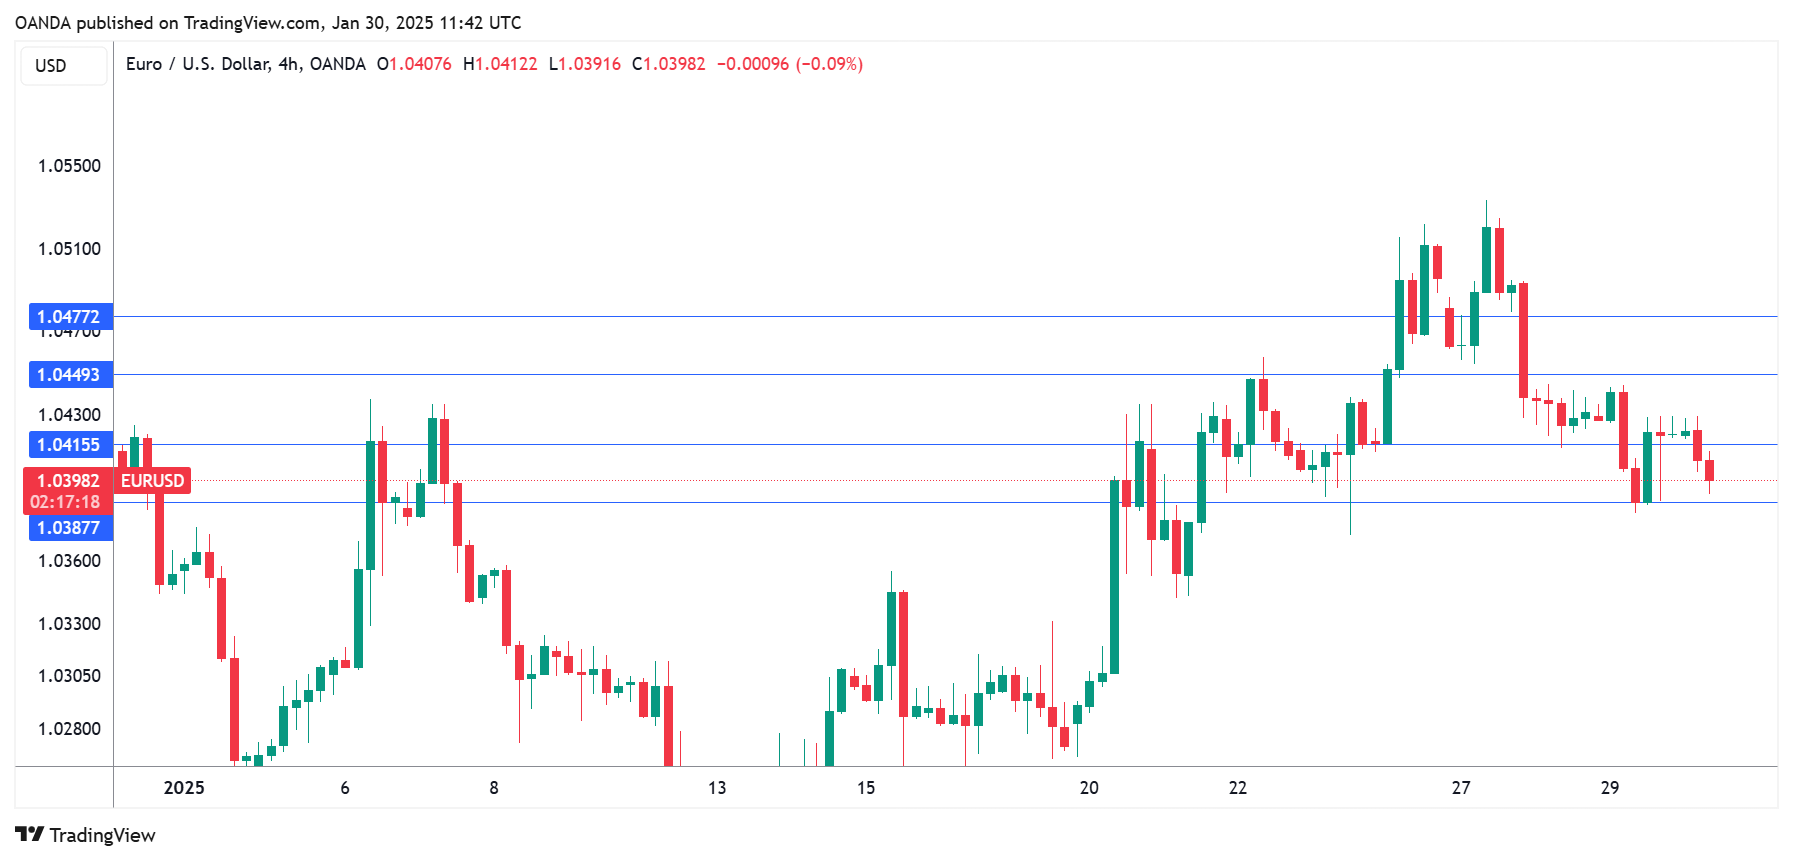
The EUR/USD pair is consolidating around 1.0426 on Thursday as investors digest the Federal Reserve’s latest policy decision and shift their focus to the upcoming European Central Bank (ECB) meeting.
Key market influences
As widely expected, the Federal Reserve held its interest rate steady at 4.5% per annum. In its commentary, the central bank reaffirmed its commitment to reducing its balance sheet at a pace of 25 billion USD per month. Fed Chair Jerome Powell stated that inflation does not necessarily need to fall to 2% before considering rate cuts. He also supported banks' provision of crypto services, a move that signals openness to financial innovation.
Notably, Powell indicated that the Fed is in no rush to lower interest rates. The central bank monitors stock market valuations closely, expressing concerns that some assets may be significantly overvalued. Interestingly, Powell avoided commenting on US President Donald Trump’s repeated calls for immediate rate cuts.
Earlier reports suggested that Trump may push for a policy allowing US presidents to have a say in setting interest rates. While the Fed remains independent for now, the issue could resurface in political discussions.
Technical analysis of EUR/USD
On the H4 chart, EUR/USD moved downward to 1.0382, forming a corrective wave towards 1.0437. After completing this correction, the pair is likely to resume its decline, with an initial target at 1.0345. A brief correction to 1.0437 may follow before the downtrend extends towards 1.0050. The MACD indicator supports this outlook, with its signal line positioned above zero but trending downwards, indicating bearish momentum.
On the H1 chart, the pair consolidated around 1.0437 before breaking lower to reach a local target at 1.0382. A corrective move towards 1.0437 is now likely before the pair resumes its decline towards 1.0345, with a potential continuation to 1.0160. The Stochastic oscillator confirms this scenario, with its signal line above 80 but pointing downward towards 20, signalling the likelihood of further losses.
Conclusion
The EUR/USD pair remains stable following the Fed’s policy announcement, with attention shifting to the ECB’s upcoming meeting. The Fed’s cautious stance on rate cuts supports the USD, while uncertainty surrounding Trump’s potential influence over monetary policy adds another layer of complexity. Technical indicators point to further downside potential for EUR/USD, with key targets at 1.0345 and 1.0160. The next major moves depend on the ECB’s policy outlook and broader market sentiment.
EUR/USD Mid-Day Outlook
Daily Pivots: (S1) 1.0387; (P) 1.0415; (R1) 1.0449; More...
EUR/USD recovers slightly but stays in range below 1.0531. Intraday bias remains neutral for the moment. Outlook is unchanged for now. On the downside, break of 1.0371 support will indicate rejection by 38.2% retracement of 1.1213 to 1.0176 at 1.0572 and retain near term bearishness. Retest of 1.0176 low should be seen next. On the upside, though, decisive break of 1.0572 will raise the chance of bullish reversal, and target 61.8% retracement at 1.0817.
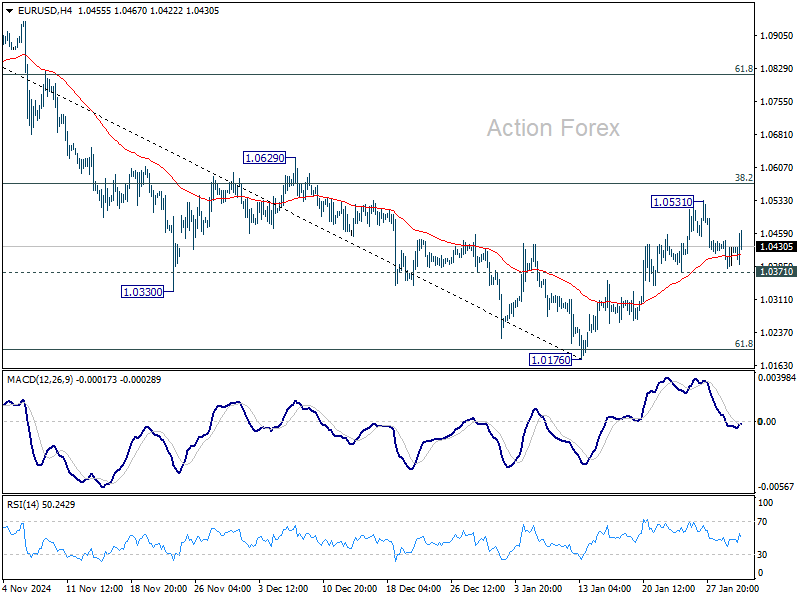
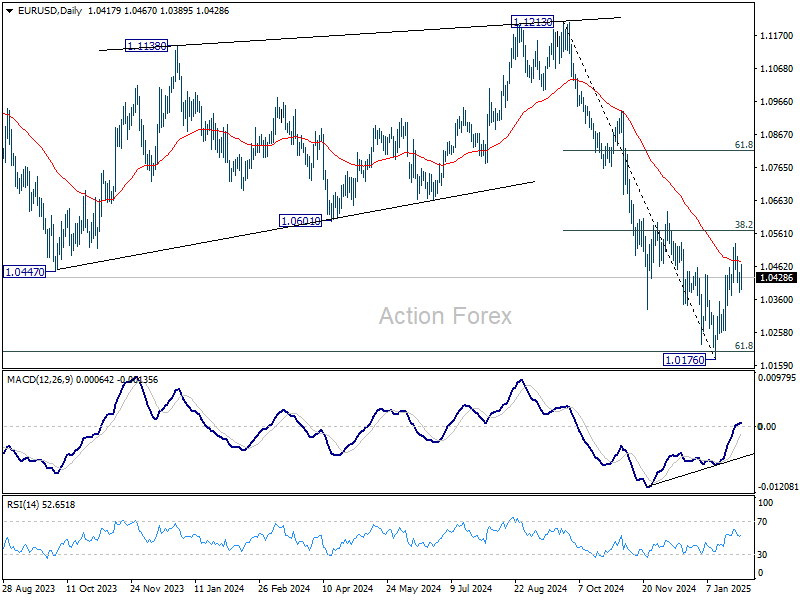
In the bigger picture, outlook is mixed as fall from 1.1274 (2023 high) could either be the second leg of the corrective pattern from 0.9534 (2022 low), or another down leg of the long term down trend. Strong support from 61.8 retracement of 0.9534 to 1.1274 at 1.0199 will favor the former case, and sustained break of 55 W EMA (now at 1.0722) will argue that the third leg might have started. However, sustained trading below 1.0199 will favor the latter case and bring retest of 0.9534 low.
Euro Gains Modestly After ECB Cut, Dollar Soft on GDP Miss
Euro is trading slightly higher following the ECB's widely expected 25bps rate cut, though the move lacks strong momentum. In her post-meeting press conference, President Christine Lagarde reinforced the bank’s "gradual easing path".
She stated that a larger 50bps cut was not even considered today, making it clear that an aggressive rate-cutting cycle is off the table for now.
At the same time, Lagarde also emphasized that rates remain in "restrictive territory," and ECB has not yet discussed ending its easing cycle, confirming that further rate cuts remain the way to go.
Meanwhile, Dollar is under mild pressure after weaker-than-expected Q4 GDP data weighed on sentiment. The greenback slipped alongside US Treasury yields, with the 10-year yield briefly falling below 4.5% mark before recovering. Despite this, Dollar's decline has been relatively contained outside of USD/JPY, where the Yen is benefiting from falling yields. There is little indication of a sustained Dollar decline at this stage.
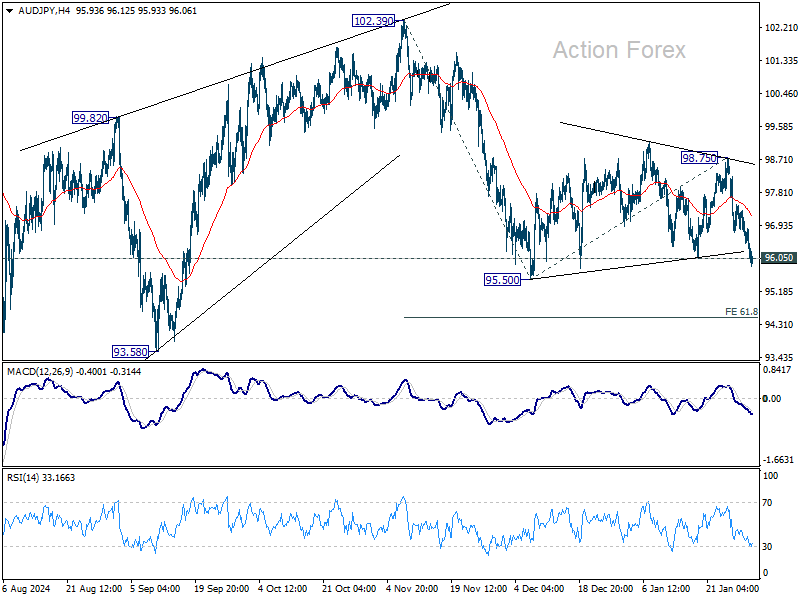
Across the broader forex market, Yen is currently the strongest performer of the day, followed by Euro and Pound. On the weaker side, Kiwi leads losses, followed by Dollar and Aussie. Loonie and Swiss Franc are trading in the middle of the pack.
Technically, AUD/JPY's decline is making progress today and breached 96.05 support. The development affirms the case that consolidation from 95.50 has completed at 98.75. Fall from 102.39 is likely ready to resume. Further decline should be seen through 95.50 to 61.8% projection of 102.39 to 95.50 from 98.75 at 94.49. However, touching of 55 4H EMA (now at 97.17) will delay the bearish case, and bring more consolidations first.
US GDP growth slows to 2.3% in Q4, inflation pressures tick higher
The US economy expanded at a 2.3% annualized rate in Q4, missing expectations of 2.6% and slowing from Q3’s 3.1% growth.
The deceleration in growth was primarily driven by weaker investment activity, which offset gains in consumer and government spending. Meanwhile, imports declined, providing a slight boost to the overall GDP figure.
Inflation data within the report signaled a modest pickup in price pressures. GDP price index rose 2.2% in Q4, up from 1.9% in the previous quarter, though below forecasts of 2.5%.
PCE price index accelerated to 2.3% from 1.5%, while the core PCE price index (excluding food and energy), a key measure of inflation tracked by Fed, rose to 2.5% from 2.2%.
US initial jobless claims falls to 207k vs exp 225k
US initial jobless claims fell -16k to 207k in the week ending January 25, below expectation of 225k. Four-week moving average of initial claims fell -1k to 213k.
Continuing claims fell -42k to 1858k in the week ending January 18. Four-week moving average of continuing claims rose 6k to 1872k.
ECB cuts 25bps, disinflation well on track
ECB delivered a widely expected 25bps rate cut, bringing main refinancing rate to 2.75%, marginal lending rate to 2.90%, and deposit rate to 3.15%.
In its statement, ECB noted that the "disinflation process is well on track," with inflation evolving broadly in line with projections. Policymakers expect inflation to reach the 2% medium-term target this year, with underlying inflation measures indicating price stability on a "sustained basis."
ECB acknowledged that domestic inflation remains elevated due to "wages and prices in certain sectors still adjusting to the past inflation surge with a substantial delay." Despite this, the central bank noted that wage growth is "moderating," and corporate profit margins are absorbing part of the cost pressures, preventing a stronger inflation rebound.
Swiss KOF rises to 101.6, led by manufacturing and services
Switzerland’s KOF Economic Barometer climbed to 101.6 in January, up from 99.6 and surpassing market expectations of 100.5. This data suggests modest pickup in economic momentum, particularly in production-side sectors.
According to KOF, "the majority of the production-side indicator bundles included in the KOF Economic Barometer show positive developments."
The strongest contributions came from manufacturing, financial and insurance services, hospitality, and other service industries, signaling resilience in key sectors of the Swiss economy.
However, the outlook remains uneven. While production indicators strengthened, demand-side indicators showed signs of weakness. KOF noted that both "the indicator bundles for foreign demand as well as for private consumption indicate a downward tendency," highlighting subdued consumer activity and external trade concerns.
BoJ’s Himino reiterates further hike possible if economic forecasts hold
BoJ Deputy Governor Ryozo Himino reinforced expectations that the central bank could raise interest rates further if its economic and price projections are met.
Speaking today, Himino stated, "If our economic and price forecasts are achieved, we will raise our policy rate accordingly and adjust the degree of monetary support."
Himino also highlighted concerns about Japan’s prolonged period of negative real interest rates, describing the situation as "not normal."
He explained that an ideal economic scenario for Japan would involve rising wages and corporate profits, fueling stronger consumption and investment, which would then support moderate and stable inflation. In such a case, Japan could see real interest rates turn positive.
EUR/USD Mid-Day Outlook
Daily Pivots: (S1) 1.0387; (P) 1.0415; (R1) 1.0449; More...
EUR/USD recovers slightly but stays in range below 1.0531. Intraday bias remains neutral for the moment. Outlook is unchanged for now. On the downside, break of 1.0371 support will indicate rejection by 38.2% retracement of 1.1213 to 1.0176 at 1.0572 and retain near term bearishness. Retest of 1.0176 low should be seen next. On the upside, though, decisive break of 1.0572 will raise the chance of bullish reversal, and target 61.8% retracement at 1.0817.
In the bigger picture, outlook is mixed as fall from 1.1274 (2023 high) could either be the second leg of the corrective pattern from 0.9534 (2022 low), or another down leg of the long term down trend. Strong support from 61.8 retracement of 0.9534 to 1.1274 at 1.0199 will favor the former case, and sustained break of 55 W EMA (now at 1.0722) will argue that the third leg might have started. However, sustained trading below 1.0199 will favor the latter case and bring retest of 0.9534 low.
US GDP growth slows to 2.3% in Q4, inflation pressures tick higher
The US economy expanded at a 2.3% annualized rate in Q4, missing expectations of 2.6% and slowing from Q3’s 3.1% growth.
The deceleration in growth was primarily driven by weaker investment activity, which offset gains in consumer and government spending. Meanwhile, imports declined, providing a slight boost to the overall GDP figure.
Inflation data within the report signaled a modest pickup in price pressures. GDP price index rose 2.2% in Q4, up from 1.9% in the previous quarter, though below forecasts of 2.5%.
PCE price index accelerated to 2.3% from 1.5%, while the core PCE price index (excluding food and energy), a key measure of inflation tracked by Fed, rose to 2.5% from 2.2%.
US initial jobless claims falls to 207k vs exp 225k
US initial jobless claims fell -16k to 207k in the week ending January 25, below expectation of 225k. Four-week moving average of initial claims fell -1k to 213k.
Continuing claims fell -42k to 1858k in the week ending January 18. Four-week moving average of continuing claims rose 6k to 1872k.
ECB cuts 25bps, disinflation well on track
ECB delivered a widely expected 25bps rate cut, bringing main refinancing rate to 2.75%, marginal lending rate to 2.90%, and deposit rate to 3.15%.
In its statement, ECB noted that the "disinflation process is well on track," with inflation evolving broadly in line with projections. Policymakers expect inflation to reach the 2% medium-term target this year, with underlying inflation measures indicating price stability on a "sustained basis."
ECB acknowledged that domestic inflation remains elevated due to "wages and prices in certain sectors still adjusting to the past inflation surge with a substantial delay." Despite this, the central bank noted that wage growth is "moderating," and corporate profit margins are absorbing part of the cost pressures, preventing a stronger inflation rebound.
(ECB) Monetary policy decisions
30 January 2025
The Governing Council today decided to lower the three key ECB interest rates by 25 basis points. In particular, the decision to lower the deposit facility rate – the rate through which the Governing Council steers the monetary policy stance – is based on its updated assessment of the inflation outlook, the dynamics of underlying inflation and the strength of monetary policy transmission.
The disinflation process is well on track. Inflation has continued to develop broadly in line with the staff projections and is set to return to the Governing Council’s 2% medium-term target in the course of this year. Most measures of underlying inflation suggest that inflation will settle at around the target on a sustained basis. Domestic inflation remains high, mostly because wages and prices in certain sectors are still adjusting to the past inflation surge with a substantial delay. But wage growth is moderating as expected, and profits are partially buffering the impact on inflation.
The Governing Council’s recent interest rate cuts are gradually making new borrowing less expensive for firms and households. At the same time, financing conditions continue to be tight, also because monetary policy remains restrictive and past interest rate hikes are still transmitting to the stock of credit, with some maturing loans being rolled over at higher rates. The economy is still facing headwinds but rising real incomes and the gradually fading effects of restrictive monetary policy should support a pick-up in demand over time.
The Governing Council is determined to ensure that inflation stabilises sustainably at its 2% medium-term target. It will follow a data-dependent and meeting-by-meeting approach to determining the appropriate monetary policy stance. In particular, the Governing Council’s interest rate decisions will be based on its assessment of the inflation outlook in light of the incoming economic and financial data, the dynamics of underlying inflation and the strength of monetary policy transmission. The Governing Council is not pre-committing to a particular rate path.
Key ECB interest rates
The Governing Council today decided to lower the three key ECB interest rates by 25 basis points. Accordingly, the interest rates on the deposit facility, the main refinancing operations and the marginal lending facility will be decreased to 2.75%, 2.90% and 3.15% respectively, with effect from 5 February 2025.
Asset purchase programme (APP) and pandemic emergency purchase programme (PEPP)
The APP and PEPP portfolios are declining at a measured and predictable pace, as the Eurosystem no longer reinvests the principal payments from maturing securities.
Refinancing operations
On 18 December 2024 banks repaid the remaining amounts borrowed under the targeted longer-term refinancing operations, thus concluding this part of the balance sheet normalisation process.
***
The Governing Council stands ready to adjust all of its instruments within its mandate to ensure that inflation stabilises sustainably at its 2% target over the medium term and to preserve the smooth functioning of monetary policy transmission. Moreover, the Transmission Protection Instrument is available to counter unwarranted, disorderly market dynamics that pose a serious threat to the transmission of monetary policy across all euro area countries, thus allowing the Governing Council to more effectively deliver on its price stability mandate.
The President of the ECB will comment on the considerations underlying these decisions at a press conference starting at 14:45 CET today.
ECB Expected to Trim Rates, Euro Edges Lower
The euro has edged lower ahead of today’s rate annoucement from the European Central Bank. In the European session, EUR/USD is currently trading at 1.0396, down 0.23% on the day.
ECB projected to lower rates to two-year low
The European Central Bank is widely expected to deliver a 25-basis point rate cut at today’s meeting, which would bring the deposit rate to 2.75%. This would be the lowest rate since December 2022. The ECB has telegraphed its intention to cut at today’s meeting, which should mean that the reaction in the financial markets will be muted. Investors will be monitoring the rate statement and President Lagarde’s press conference for any change in the ECB’s policy stance.
The ECB has been aggressive in its easing cycle, as today’s expected cut would be the fifth since June 2024. What’s next? The central bank is under pressure to continue lowering rates for domestic and external reasons, and the markets are looking at three more reductions in 2025, which would bring the deposit rate to 2%. With the Federal Reserve looking at only one or two rate cuts this year, the US/Europe rate differential will likely widen, which would push the euro closer to parity.
The eurozone economy is in trouble and among the largest economies in the bloc, only Spain is performing well. There is political instability in Germany and France which is only adding to market nervousness over the eurozone. As well, the growing threat of tariffs from US President Trump could further dampen eurozone growth and destabilize the financial markets. The ECB may need to cut faster and deeper if Trump hits the eurozone with tariffs.
Fed holds rates, as expected
The Federal Reserve maintained the benchmark rate at a range of 4.25-4.5%, as expected. It was the first hold after three straight rate cuts. Fed Chair Powell sounded hawkish and stated that the Fed was “in no hurry” to lower rates. The markets are expecting one or two cuts this year and Bank of America recently said that the easing cycle could be over and the next move will likely be a rate cut. President Trump responded angrily to the rate announcement, saying that the Fed had done a “terrible job” and was responsible for inflation.
EUR/USD Technical
- EUR/USD is testing support at 1.0415. Below, there is support at 1.0387
- There is resistance at 1.0449 and 1.0477
Crypto Got Support, But Not Yet FOMO
Market Picture
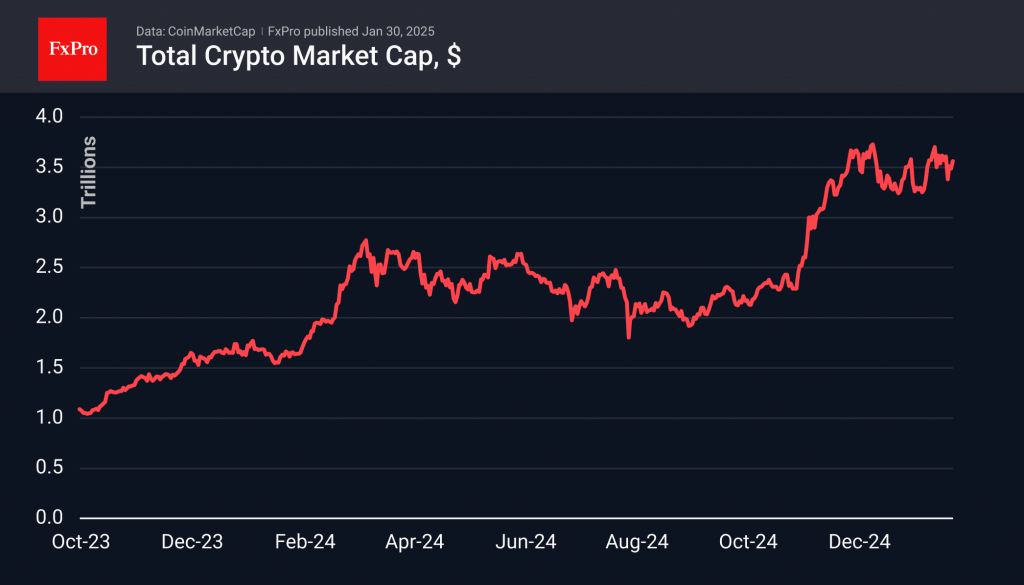
The cryptocurrency market has not been embarrassed by the lacklustre performance of US equities, gaining 1.8% in the last 24 hours to $3.56 trillion. This is the high of the current week but below the market’s centre of gravity during the consolidation period from 17 to 26 January. The market is still hesitant to storm to all-time highs, facing increased activity from those looking to lock in profits from last year’s crypto rally.
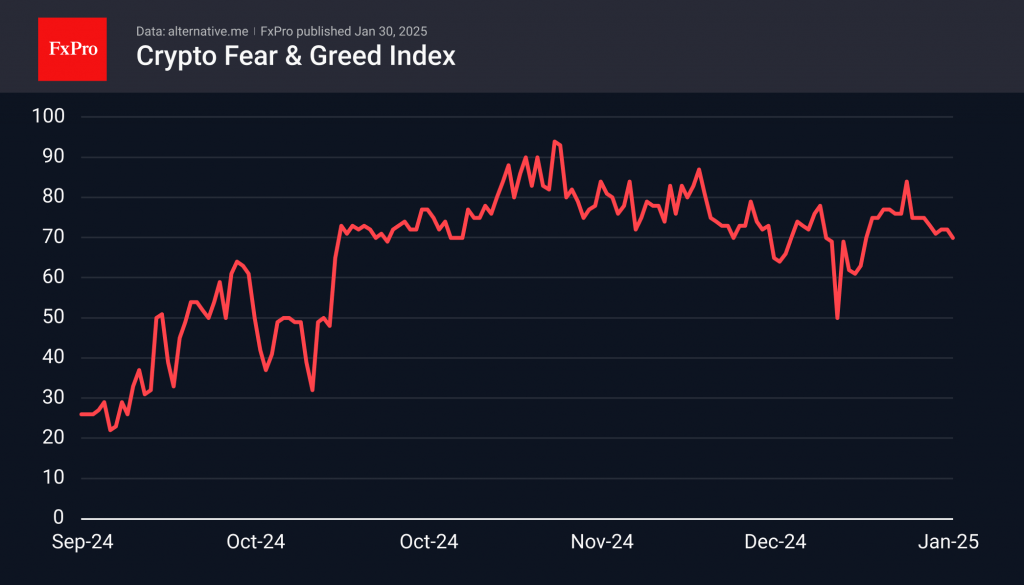
The crypto market sentiment index has been in confident greed territory throughout the week without much change. This is unlike previous periods of euphoria, where FOMO momentum lifted the index into the 90 area vs the current 70.
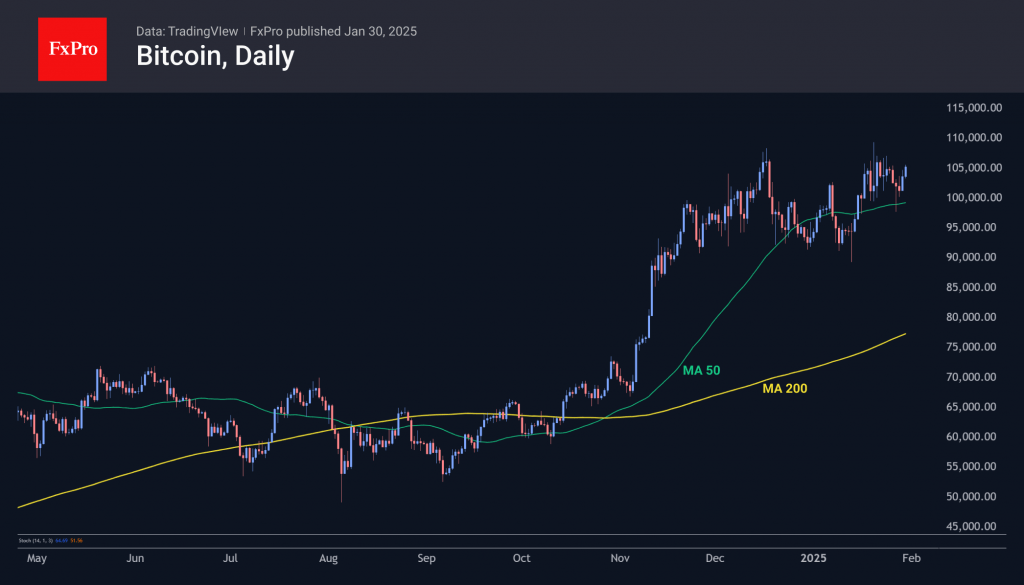
Bitcoin rose to 105,000, entering the area of sustained highs in December and January. Earlier in the week, bulls protected BTC from consolidating under the 50-day moving average, forcing the latest dynamic to be seen as a consolidation rather than a break of an upward trend.
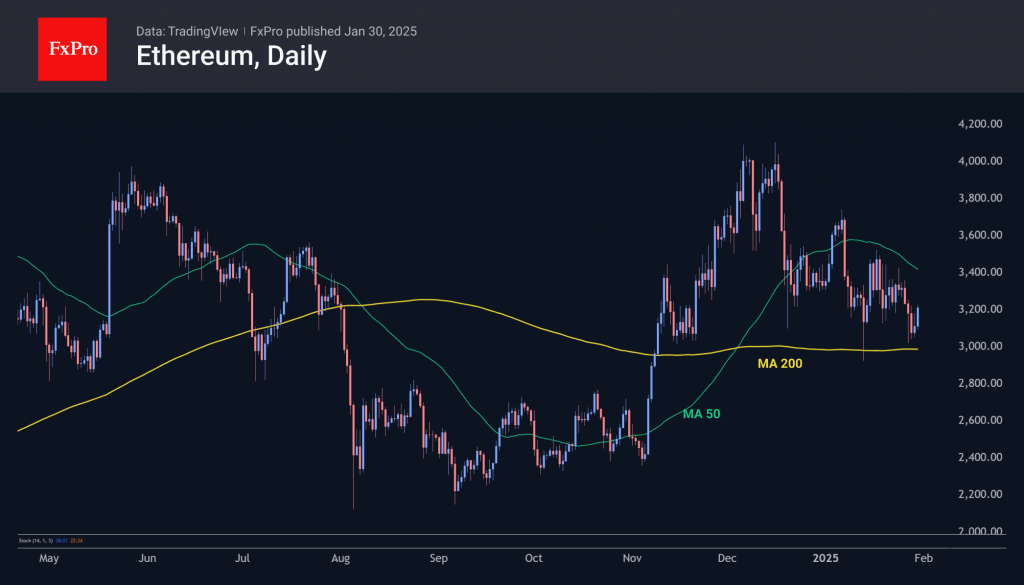
Ethereum also successfully fought off the bears, defending against a dip under 3000. This is not the first time this has happened since the second half of November. The major altcoin has emerged from the ranks of market drivers but is clearly in no hurry to be a bargaining chip.
News Background
In December 2024, the monetary aggregate M2 in the US rose to $21.5 trillion, approaching an all-time high, CoinDesk notes, noting the strong positive correlation of money supply with risk appetite.
The head of the Czech National Bank suggested diversifying the state reserve by placing up to 5% of its €140bn of assets in Bitcoin. At the same time, he did not rule out that investments in cryptocurrency could be bad. The Bank’s board of directors will consider the initiative.
Trump’s media company, Trump Media, announced the launch of its financial arm, Truth.Fi, and the allocation of up to $250 million to invest in traditional and digital assets, including Bitcoin, cryptocurrencies and related securities.
Since 1 November, the number of active Ethereum addresses has increased 37% to 575,000. The catalyst was institutional investors’ renewed interest in DeFi.
Kazakhstan President Tokayev recommended changing the approach to the circulation of cryptocurrencies and urgently creating infrastructure for their wider legal circulation. According to him, 95% of Kazakhstani crypto investors operate in the ‘grey’ zone.