Sample Category Title
EUR/GBP Daily Outlook
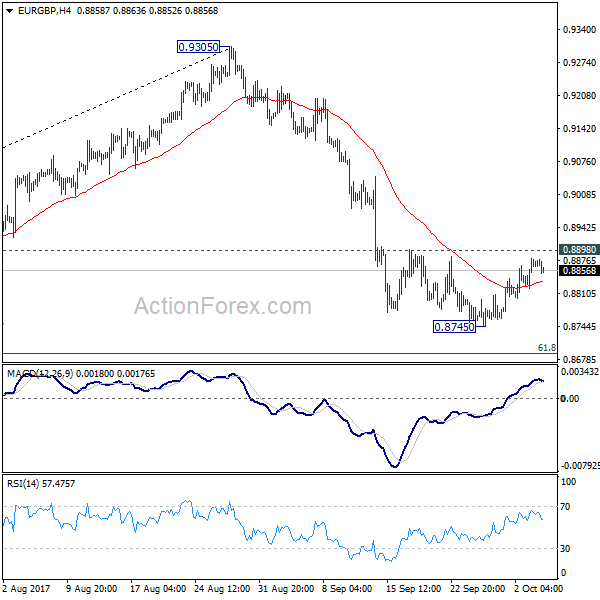
Daily Pivots: (S1) 0.8833; (P) 0.8857; (R1) 0.8893; More...
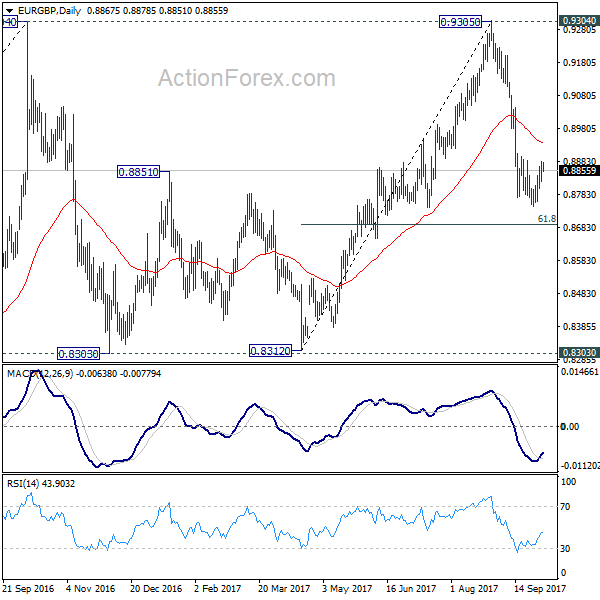
Intraday bias in EUR/GBP remains at this point. On the downside, below 0.8745 will target 61.8% retracement of 0.8312 to 0.9305 at 0.8691 and below. Fall from 0.9305 is seen as the third leg of consolidation pattern from 0.9304. We'll look for bottoming signal again at it approaches 0.8303 support. On the upside, break of 0.8898 will indicate near term reversal and turn bias back to the upside for 55 day EMA (now at 0.8941) first.
In the bigger picture, price actions from 0.9304 are viewed as a medium term corrective pattern. It's still in progress with fall from 0.9305 as the third leg. Break of 0.8303 could be seen. But even in that case, we'd expect strong support from 0.8116 cluster support (50% retracement of 0.6935 to 0.9304 at 0.8120) to contain downside. Whole up trend from 0.6935 is expected to resume after consolidation from 0.9304 completes.
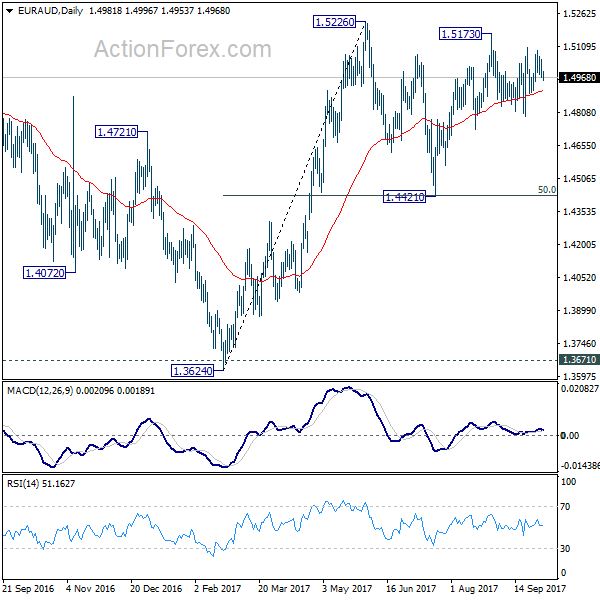
EUR/AUD Daily Outlook
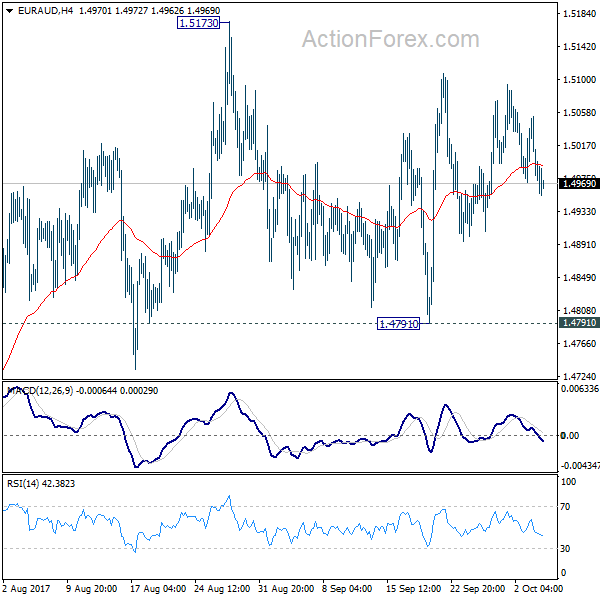
Daily Pivots: (S1) 1.4953; (P) 1.5004; (R1) 1.5037; More....
No change in EUR/AUD's outlook. Consolidation from 1.5173 is still in progress and intraday bias remains neutral. On the upside, break of 1.5173/5226 resistance zone will finally resume larger rise from 1.3624. In that case, EUR/AUD will target 1.5644 resistance first. On the downside, break of 1.4791 support will turn bias to the downside and extend the fall from 1.5173 to retest 1.4421 support.
In the bigger picture, we're holding on to the view that corrective decline from 1.6587 medium term top has completed at 1.3624. Rise from 1.3624 is expected to extend to retest 1.6587. The corrective structure of the price actions from 1.5226 is affirming this view. Above 1.5226 will target a test on 1.6587 key resistance. However, break of 1.4421 support will dampen our view and would drag EUR/AUD lower to retest key support zone around 1.3624.
Dollar Stutters Amidst Its Rally
Dollar rally on pause ahead of ADP report
After printing fresh highs against most of its peers yesterday, the greenback finally took a breather on Wednesday and consolidated gains as investors await ADP employment report, Markit PMIs and ISM non-manufacturing. The dollar index edged down 0.10% to 93.50 as the greenback fell 0.25% against the yen, 0.15% against the pound sterling and 0.08% against the single currency. The Swedish krone and the Australian dollar were the best performers, adding 0.27% and 0.26% respectively.
The ADP employment report is due for release this afternoon. Job creation expectations are relatively low for the month of September, mostly due to the negative effect on business confidence after the country was hit by a series of hurricanes. The market anticipates the US economy created 135,000 private job in the previous month, compared to 237k in July.
The ISM non-manufacturing is expected to edge slightly higher to 55.5 from 55.3 in the previous month. The second estimate of the services PMI should confirm the recent easing in business confidence in the service sector (55.1 first estimate).
Overall, the dollar consolidation suggest that investors are pocketing short time profit stemming from their long USD positions. The publication of a shortlist of potential Fed Chairman, regarding the possible removal of Janet Yellen at the head of the Federal reserve, which contains some candidates well-known for their dovish stance on monetary policy triggered profit taking across the board. The uncertainty surrounding the feasibility of Trump’s tax reform also kept investors on the sidelines. Although we maintain our bullish view on the greenback, we do not ruled out short-term USD weakness.
Gold tumbles as geopolitical risks fade
The yellow metal has reached its 8-week low and is trading around $1275 which nonetheless remains at a strong level if we compare gold prices since the start of the year. Gold price began the year below $1200. The return so far of the precious metal is still very interesting well above 6%.
Markets are now less focus on the potential geopolitical risks between the US and North Korea. Central banks are back to centre stage and anticipation of further tightening could pressure down the yellow metal. The strong equities markets (in particular the US market) has pushed up the dollar which resulted in some gold weakness.
Our view is that we definitely believe that markets are too optimistic regarding the ability of central banks to tighten their monetary policy. Debts are way too important and increasing the cost of the debt would create major markets turmoil. We then continue to consider that central banks will likely let inflation run in order to kill it. This will definitely result in a gold appreciation within the medium-term. We maintain our bullish view on gold and reload longs as we should hit new highs soon.
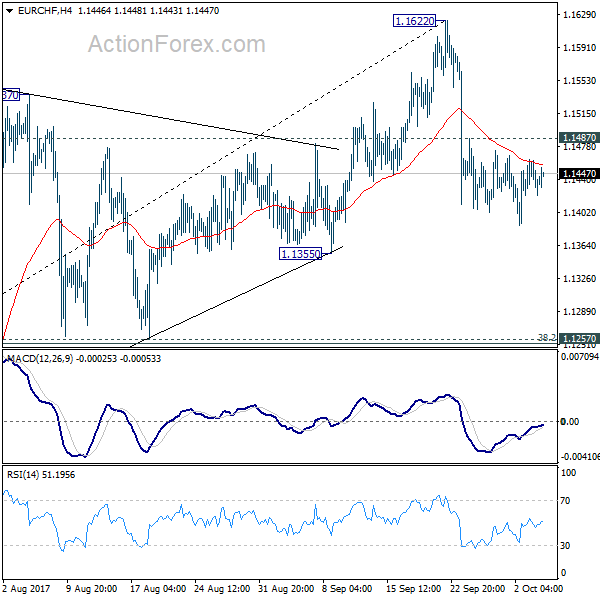
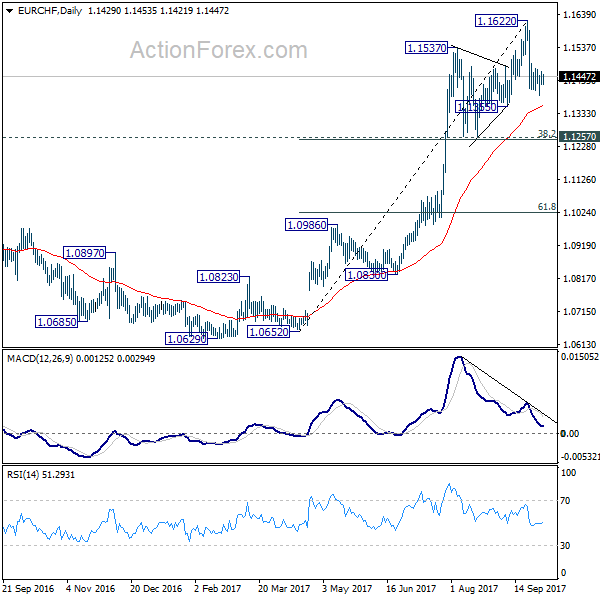
EUR/CHF Daily Outlook
Daily Pivots: (S1) 1.1419; (P) 1.1441; (R1) 1.1455; More...
No change in EUR/CHF's outlook. With 1.1487 minor resistance intact, deeper decline is expected. Fall from 1.1622 is a correction and would target 1.1257 cluster support (38.2% retracement of 1.0652 to 1.1622 at 1.1251). Strong support is expected there to contain downside and bring rebound. Meanwhile, break of 1.1487 minor resistance will suggest that the pull back is completed and bring retest of 1.1622.
In the bigger picture, long term rise from SNB spike low back in 2015 is still in progress. EUR/CHF should now be heading back to prior SNB imposed floor at 1.2000. For now, this will be the favored case as long as 1.1198 resistance turned support holds.
European Markets And US Futures Fragile Ahead Of Fed Chair Nomination
The rally in the dollar is petered out
Spanish markets are the talking point amid investors
The EZ economic data is supporting the ECB stance
European markets and US futures are fragile as the process of picking a new Fed chief looms. The fresh trigger for the dollar rally would be the new chairperson of the Federal Reserve. The rally in the dollar is petered out and it needs more tailwind otherwise things will start rolling backwards. President Trump has released the list of his favourite candidate who could be the chairperson of the Fed. To some investors, it was shocking that Janet Yellen is still a contender.
Yellen is generally dubbed as a dovish person by the markets and we know that her approach towards normalising the interest rate would be gradual. She is someone who is data dependent and she is not a fan of making any sharp manoeuvres. It is a fact that the Fed cannot afford a blunder but not all contenders have the same mind frame.
Some of them are way hawkish and could start pushing the interest rate higher more rapidly than others. It is significant to keep in mind that the affordability ratio is lower among consumers and a sharp increase in the interest rate would be the last nail in the coffin.
Back in Europe, it is your Spanish markets which are the talking point amid investors. It is no surprise that the equity market is getting hit hard and the Catalan government is further ranching up those concerns by opposing threats of declaring independence. The Spanish King Felipe was the last hope to dial back the tensions. However, it doesn’t appear there has been any vital effort to de-escalate the tension.
Although the King has more of ceremonial role to play rather than having any real power, he could have lent a hand to Rajoy by cultivating the path through which both sides could start a more constructive negotiation process. The King clearly lashed out Catalonian government response over the weekend and a miscalculated action would only cause investors to punish the Spanish equity markets further.
The economic data out of Europe is supporting the fact that the ECB has a green light to start the tapering process and the upcoming PMI number from Spain, France, Italy and Germany (due today) would not only strengthen the above argument but may actually provide some support for the Euro as well which has been beaten down against the dollar.
As for Sterling, the economic numbers are showing the dark effects of Brexit. For instance, the UK construction PMI printed an extremely abate number. This slammed the Sterling-dollar pair. Forget any change in the policy stance by the BOE if other economic numbers start to echo this message. Theresa May’s needs to make sure that her speech to conservative leaders stamps the fact that she is not a dead woman walking.
Stellar Performance By Tesco
For Tesco investors, hiatus period has come to an end as the company has finally restored its dividend, something which passive investors love the most. The firm reported another stellar set of earning numbers today with profit soaring and beating analysts’ forecast. The revenue was up 3.7% and like for like sales number also got a boost and increased by 2.2%. This is a tremendous performance because, remember, the UK consumers are heavily hunted by the Brexit woes and consumer buying power is heavily squeezed by higher inflation. For us, another encouraging sign in today’s earnings report was the reduction in the debt (nearly 25%), thanks to the marvellous job done by the management. We would continue to monitor the debt situation for the firm and for us it would be a sign of confidence if the firm outpaces the debt reduction number amid its peers.
Euro Inches Higher As German, Eurozone Services PMIs Within Expectations
The euro is showing little movement in the Wednesday session. Currently, EUR/USD is trading at 1.1760, up 0.13% on the day. It's a busy day in the US and Europe. In the Eurozone, German Services PMI matched its estimate of 55.6, while the Eurozone Services PMI improved to 55.8, above the forecast of 55.6 points. Later in the day, ECB head Mario Draghi will speak at an event in Frankfurt. In the US, ADP Nonfarm Payrolls kicks off this week's job reports, with the indicator expected to slow to 131 thousand. The ISM Nonfarm Manufacturing PMI is forecast to edge up to 55.5 points. We'll also hear from Federal Reserve Chair Janet Yellen ,who will deliver remarks at an event hosted by the St. Louis Fed.
The crisis in the Catalonia has not affected the euro so far, but the situation remains volatile, as the Spanish government and the Catalan regional government remain deadlocked over Sunday's independent referendum. The violence between police and voters left close to 900 civilians injured, and tensions remains high. Catalan officials claim that 90 percent of the votes were if favor of independence, but the national government has declared the vote unconstitutional and illegal. On Wednesday, Catalonia declared a general strike and some 700,000 people demonstrated in Barcelona. Catalan Carles Puigdemont has not showed any intent to back down, warning that his government plans to act in a matter of days. The crisis is not expected to weigh on the euro, as the referendum is viewed as an issue local to Spain, and not to the eurozone in general. As well, the Spanish economy is in good shape, so a constitutional crisis is unlikely to affect the country's economic growth.
Will the Fed make a rate move in December? Just a few weeks ago, federal futures had priced in a December hike at below 50 percent, but the odds have surged to 76 percent, according to the latest CME Fed Watch release. Although FOMC members remain divided on the prudence of another rate hike in 2017, Fed Chair Janet Yellen has broadly hinted that she favors a December move, and the markets have picked up on her message. The US economy continues to perform well, and the labor market remains close to capacity. The Achilles heel in an otherwise strong economy is inflation, which remains well below the Fed's target of 2 percent. If sentiment towards a December hike remains high, the US dollar could gain ground.
After failing to pass a new health care act through a skeptical Congress, Donald Trump has now set his sights on tax reform, another key campaign pledge from Trump's election campaign. Last week, the White House announced the new tax proposal, called the Unified Tax Reform Framework, which includes lowering corporate and personal income taxes. However, the plan is sketchy and short on specifics, most importantly, how will the plan be paid for? Trump has insisted that the cuts will trigger strong economic growth which will more than pay for itself. However, Moody's, the well-respected credit rating company, is not impressed by the rhetoric. On Monday, Moody's said that the tax plan is “likely credit negative”, arguing that tax cuts would not be offset in spending cuts, which would result in a higher federal budget deficit and debt. The reduction in federal government revenue would negatively affect the US credit rating. Some Republican lawmakers have already come out against the plan, so it appears that the proposal will have an uphill battle to pass through the House of Representatives and the Senate.
Technical Outlook: AUDUSD Consolidates After Repeated Downside Rejection At Cloud Base
The Aussie bounced to 0.7875 in Asia, boosted by weaker US dollar and following repeated strong downside rejection at base of thick daily cloud at 0.7800, reinforced by rising 100SMA. Long-tailed candles in past two days and repeated failure to close below Fibo 38.2% at 0.7820 signal bears may take a break ahead of renewed attack at pivotal supports at 0.7820/00. Falling 10SMA (0.7875) and Tenkan-sen (0.7885) capped recovery attempts for now, with extended upticks expected to hold below cloud top (0.7930) and keep bears intact. Formation of 20/30SMA bear-cross today reinforces overall bearish stance. Firm break below daily cloud could accelerate towards 0.7726 (50% of 0.7328/0.8124 / weekly Kijun-sen). Alternative scenario requires sustained break above daily cloud top to signal reversal.
Res: 0.7875, 0.7885, 0.7930, 0.7945
Sup: 0.7820, 0.7800, 0.7785, 0.7726
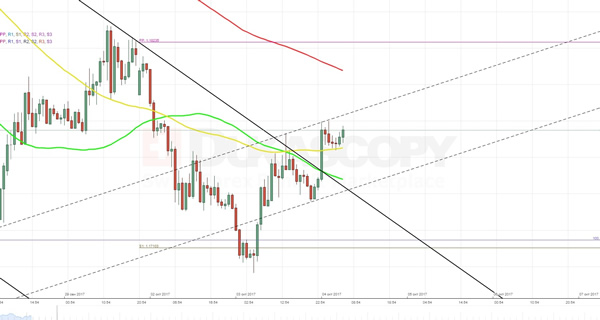
EURUSD Analysis: Recovers And Breaks Descending Channel
It appeared that a breakthrough the 100% Fibonacci retracement level at 1.1715 and the weekly S1 at 1.1710 had a short-term effect. Despite the average market sentiment, which is 61% bearish, the pair managed to restore not only lost positions but also cross a combination of 55- and 100-hour SMAs as well as the upper trend-line of a medium-term descending channel. On the one hand, the further climb to the top is likely to be hindered by the slipping 200-hour SMA near 1.1810. On the other hand, the above retracement level is also not expected to let the rate to drop to the bottom. For this reason, a great impact on the further direction of the pair will have all fundamental events that are scheduled for today, including Draghi and Yellen speeches.
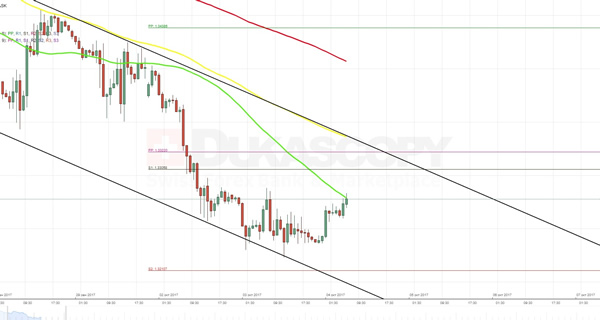
GBPUSD Analysis: Stays In Senior Channel
In line with expectations, the currency exchange rate failed to break from the one-month-long descending channel yesterday. Accordingly, it formed a third reaction low and continued to move in the opposite direction. However, it seems that the 55-hour SMA is not going to allow the Pound to gain more value against the Dollar, as it did many other times in the past. On the other hand, if a released data on the UK Services PMI will appear to be better than expected, this barrier is unlikely to withhold pressure from bulls. An additional impulse for surge or, in contrast, for downfall is also expected to be provided by an update on the US employment as well as the Fed Chair Yellen speech. Regardless of outcome, there is a good chance that the pair will manage to stay within the pattern.
USDJPY Analysis: Rebounds From 113.21 Level
As it was expected, after a rapid short-term surge the pair stopped at the 113.21 level and then began to move to the bottom, breaking from a dominant ascending channel. At the moment, the rate is approaching a combined support formed by the 200-hour SMA and the weekly PP at 112.42, which is located slightly above the bottom trend-line of another ascending channel that still remains in force. This fact points out on an upcoming rebound.
However, the pair might continue to slip to the bottom if the US employment data will not justify experts' forecast. An additional impulse is also expected to be provided by the subsequent Janet Yellen's speech in St. Louis.