
Sample Category Title
USD/CAD Weekly Outlook
USD/CAD stayed in consolidation below 1.4516 last week and outlook is unchanged. Initial bias remains neutral for this week and more sideway trading could be seen. Further rally is expected as long as 1.4260 support holds. On the upside, firm break of 1.4516 will resume larger up trend to 1.4667/89 key resistance zone. Nevertheless, firm break of 1.4260 will turn bias to the downside for deeper pullback to 55 D EMA (now at 1.4216) and below.

In the bigger picture, up trend from 1.2005 (2021) is in progress for retesting 1.4667/89 key resistance zone (2020/2015 highs). Decisive break there will confirm long term up trend resumption. Next target is 100% projection of 1.2401 to 1.3976 from 1.3418 at 1.4993. Medium term outlook will remain bullish as long as 1.3976 resistance turned holds (2022 high), even in case of deep pullback.

In the longer term picture, price actions from 1.4689 (2016 high) are seen as a consolidation pattern, which might have completed at 1.2005. That is, up trend from 0.9506 (2007 low) is expected to resume at a later stage. This will remain the favored case as long as 1.3418 support holds.


GBP/JPY Weekly Outlook
GBP/JPY's stronger than expected rebound and break of 55 D EMA last week argues that fall from 198.84 has completed at 189.31. Initial bias remains on the upside this week for 198.94 resistance, as corrective pattern from 180.00 extends with another rising leg. On the downside, below 192.05 minor support will turn intraday bias neutral again first.
In the bigger picture, price actions from 208.09 are seen as a correction to whole rally from 123.94 (2020 low). The range of consolidation should be set between 38.2% retracement of 123.94 to 208.09 at 175.94 and 208.09. However, decisive break of 175.94 will argue that deeper correction is underway.
In the longer term picture, while a medium term top was formed at 208.09 (2024 high), it's still early to conclude that the up trend from 122.75 (2016 low) has completed. But GBP/JPY is at least in a medium term corrective phase, with risk of correction to 55 M EMA (now at 173.49).
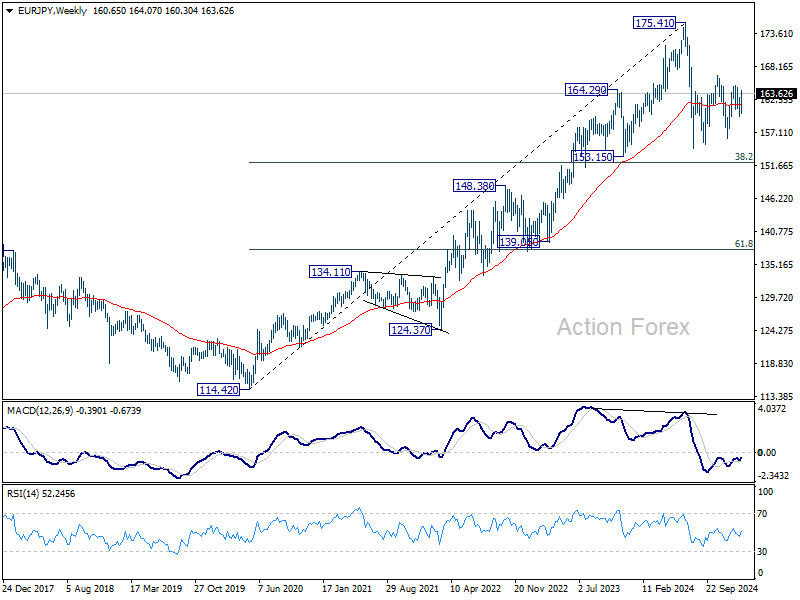
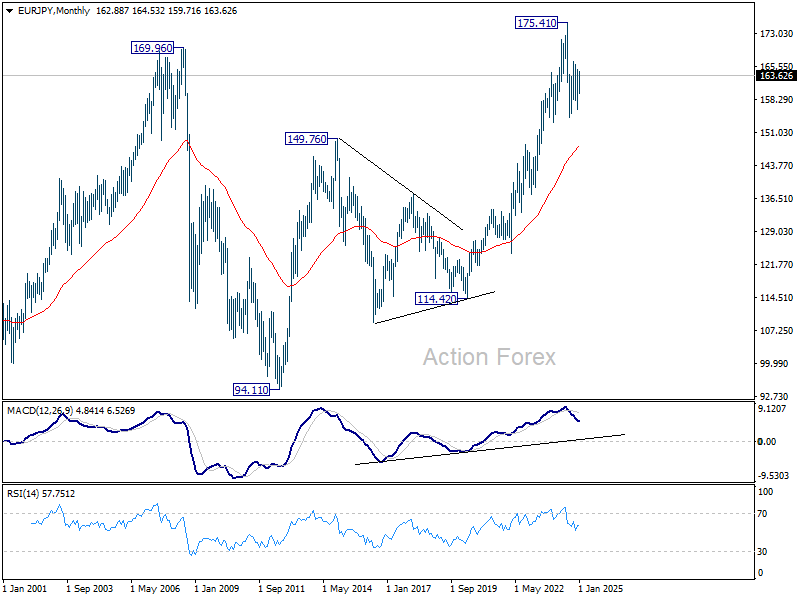
EUR/JPY Weekly Outlook
EUR/JPY's stronger than expected rebound last week suggests that corrective pull back from 164.89 has completed at 159.74 already. Initial bias remains on the upside this week for 164.89 resistance. Firm break there will resume the rise from 156.16, as another leg of the corrective pattern from 154.40. Next target is 100% projection of 156.16 to 164.89 from 159.74 at 168.47.
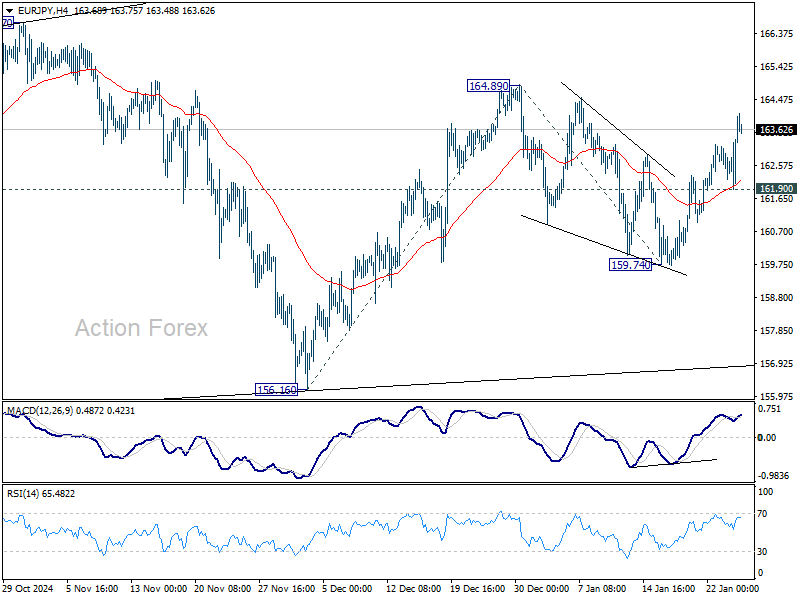
In the bigger picture, price actions from 175.41 are seen as correction to rally from 114.42 (2020 low). The range of consolidation should have been set between 38.2% retracement of 114.42 to 175.41 at 152.11 and 175.41 high. However, decisive break of 152.11 would argue that deeper correction is underway.
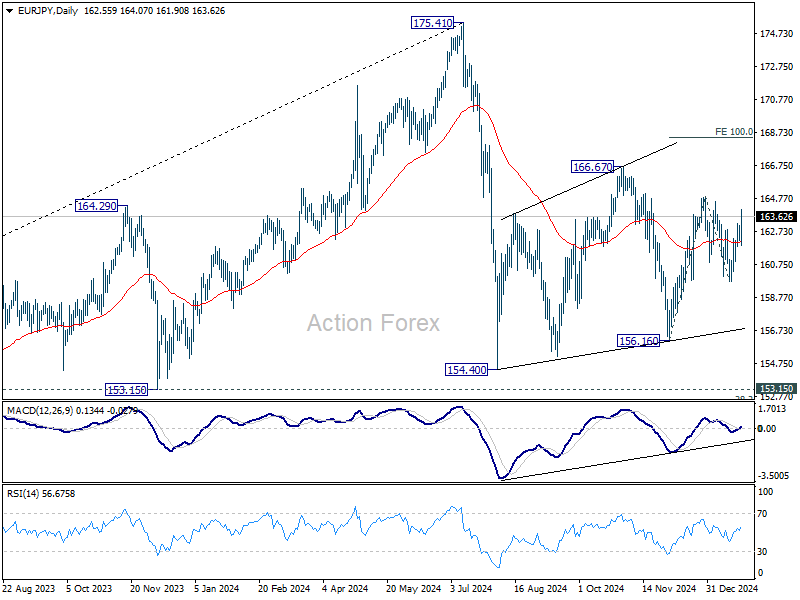
In the long term picture, while 175.41 is at least a medium term top, it's still early to conclude that up trend from 94.11 (2012 low) has completed. A medium term corrective phase is in progress with risk of deeper fall back to 55 M EMA (now at 148.27).
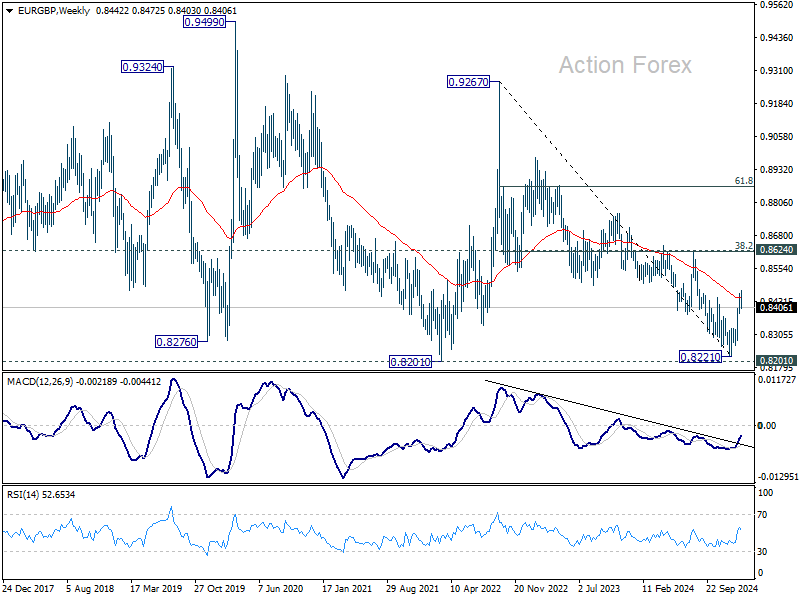
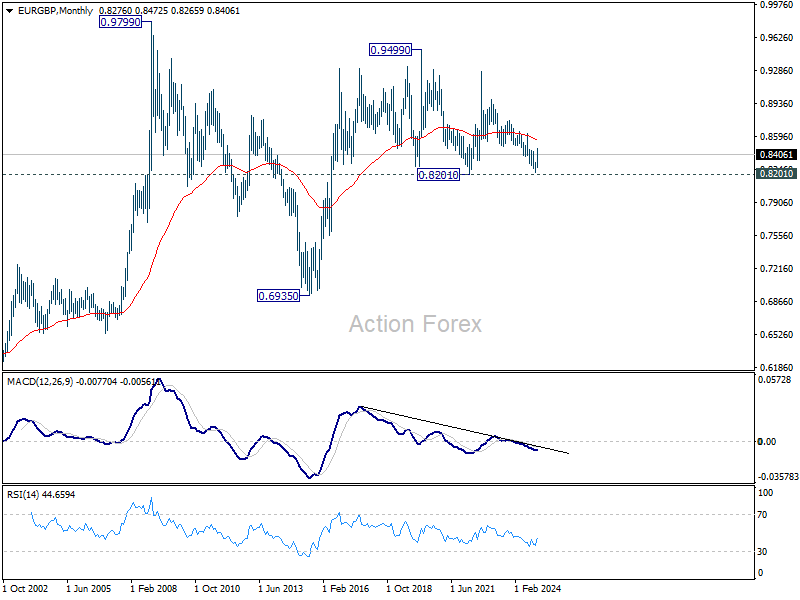
EUR/GBP Weekly Outlook
EUR/GBP edged higher to 0.8472 last week but retreated notably since then. Initial bias stays neutral this week first. On the upside, break of 0.8472 will resume the rally from 0.8221 to 0.8624 key cluster resistance zone next. However, sustained break of 0.8403 will turn bias back to the downside for 55 D EMA (now at 0.8350).
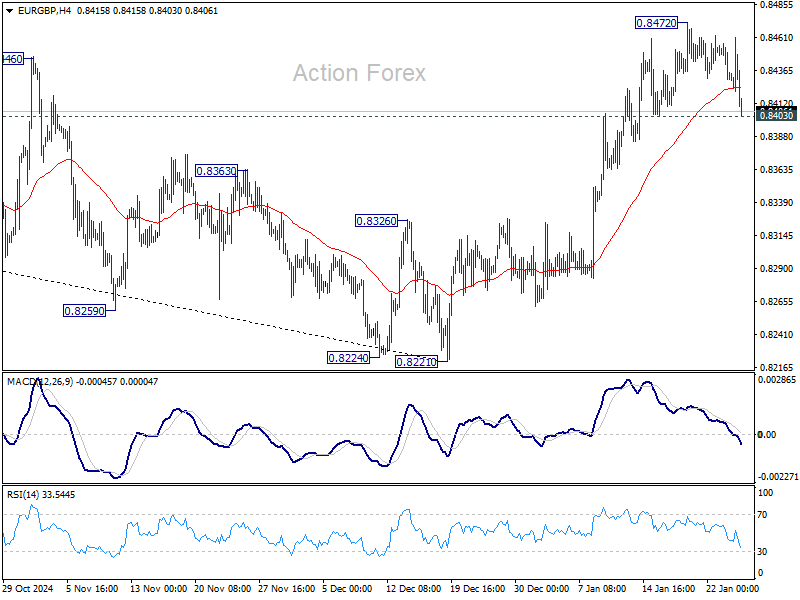
In the bigger picture, a medium term bottom should be in place at 0.8221, just ahead of 0.8201 key support (2022 low). Sustained trading above 55 W EMA (now at 0.8442) will pave the way to 0.8624 cluster zone (38.2% retracement of 0.9267 to 0.8221 at 0.8621), even just as a correction to the down trend from 0.9267 (2022 high). But still, medium term outlook will be neutral at best as long as 0.8621/4 holds.
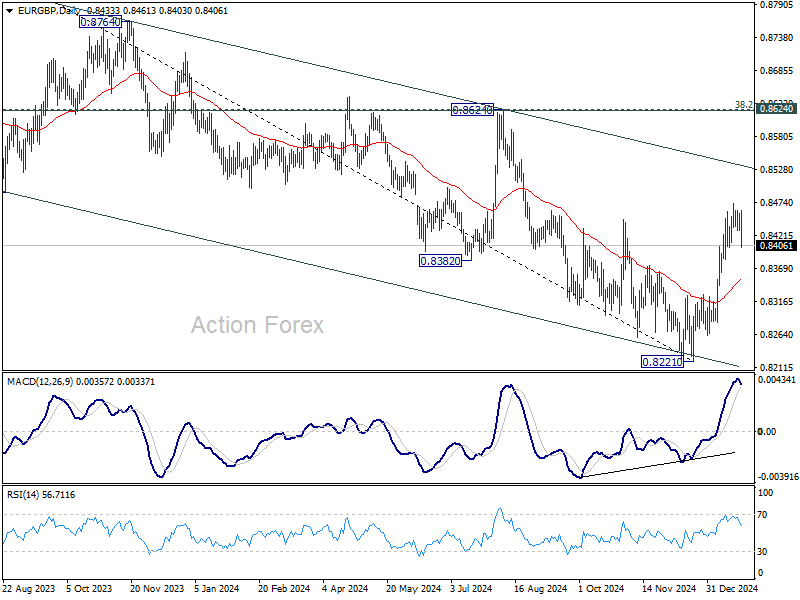
In the long term picture, price action from 0.9499 (2020 high) is seen as part of the long term range pattern from 0.9799 (2008 high). Range trading should continue between 0.8201 and 0.9499, until there is clear signal of imminent breakout.
EUR/AUD Weekly Outlook
EUR/AUD's consolidation from 1.6800 was still in progress last week and outlook remains unchanged. Initial bias stays neutral this week first. Strong support is still expected from 38.2% retracement of 1.5963 to 1.6800 at 1.6480 to contain downside. On the upside, firm break of 1.6800 will resume the rally from 1.5963. However, sustained break of 1.6480 will bring deeper correction 61.8% retracement at 1.6283 instead.
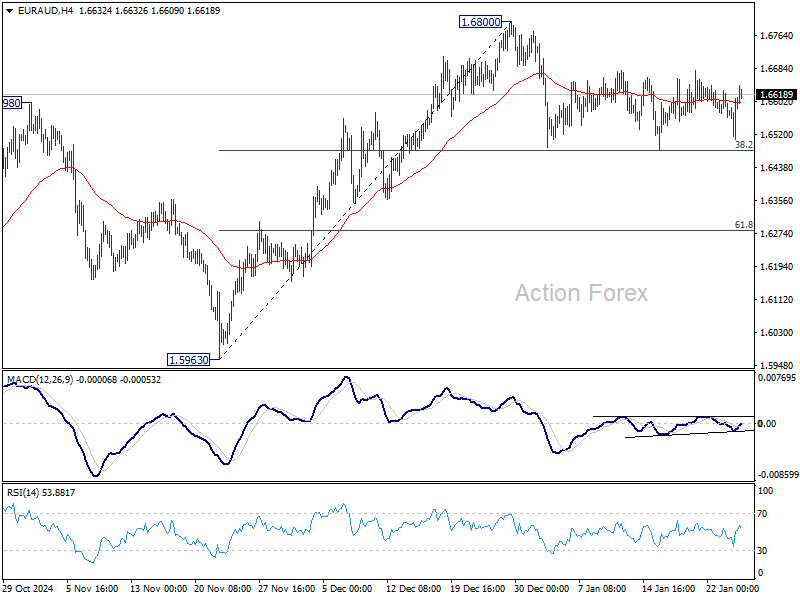
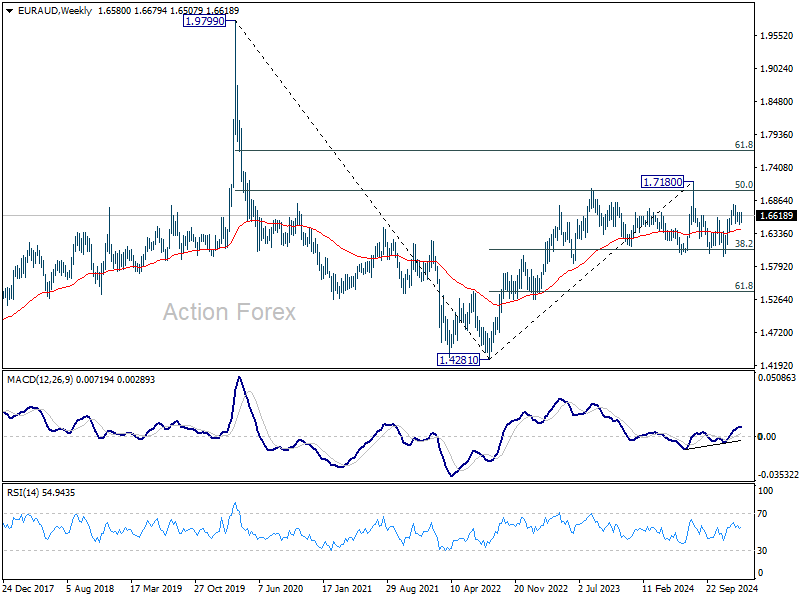
In the bigger picture, EUR/AUD is holding on to 1.5996 key support (2024 low) despite brief breach. Larger up trend from 1.4281 (2022 low) is still in favor to resume through 1.7180 at a later stage. Nevertheless, sustained break of 1.5996 will indicate that such up trend has completed and deeper decline would be seen.
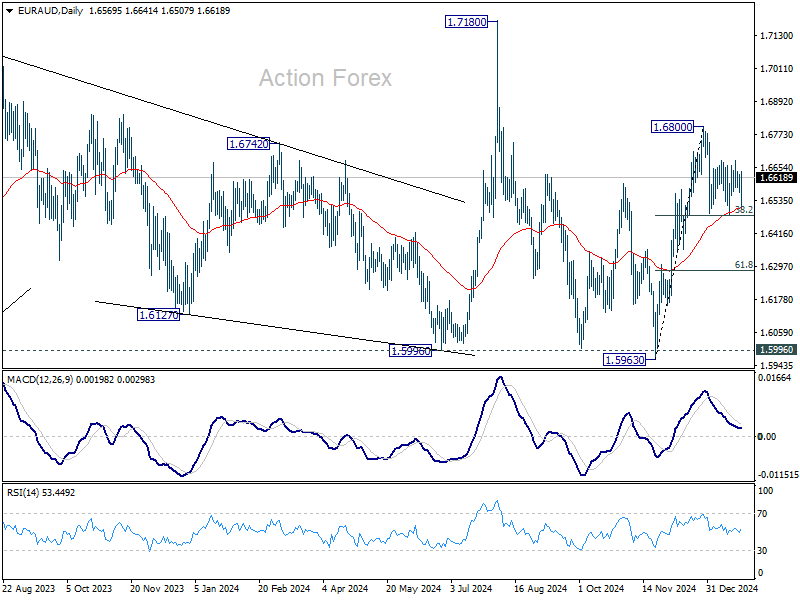
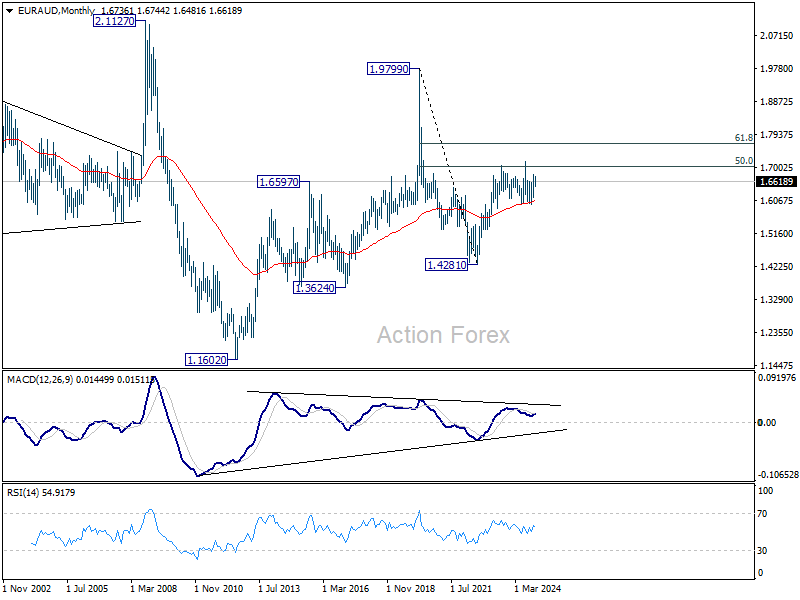
In the longer term picture, rise from 1.4281 is seen as the second leg of the pattern from 1.9799 (2020 high), which is part of the pattern from 2.1127 (2008 high). As long as 55 M EMA (now at 1.6073) holds, this second leg could still extend higher. However, sustained trading below 55 M EMA will open up the bearish case for extending the decline through 1.4281 low.
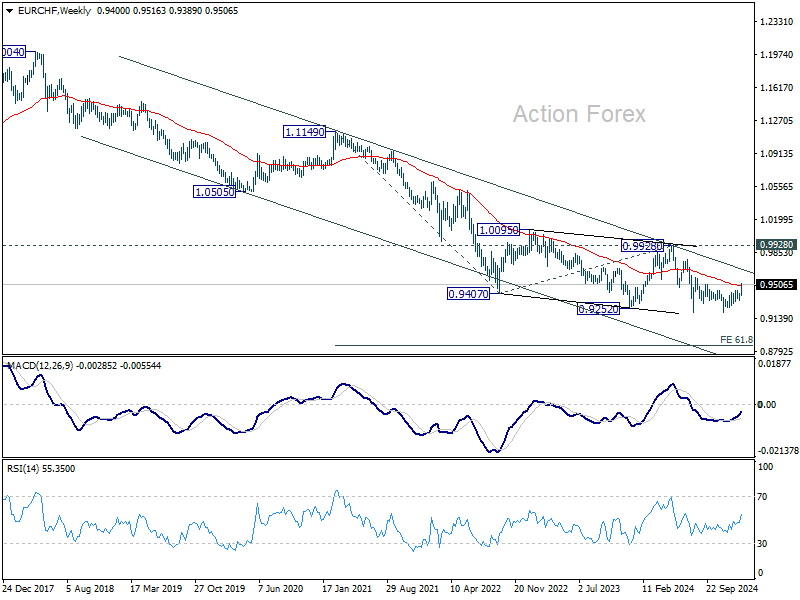
EUR/CHF Weekly Outlook
EUR/CHF's choppy rise from 0.9209 extended higher last week and there is no sign of topping yet. Initial bias stays on the upside this week for next fibonacci resistance at 0.9651. For now, further rally will remain in favor as long as 0.9424 support holds, in case of retreat.
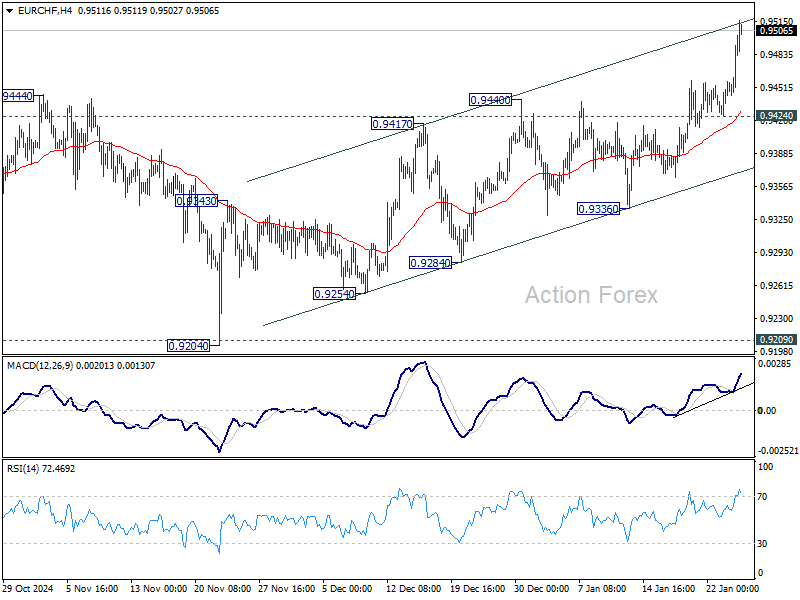
In the bigger picture, fall from 0.9928 should have completed at 0.9204 with the current strong rebound, after failing to sustain below 0.9252 (2023 low). It's still early to confirm long term bullish reversal. But even as a corrective move, current rebound would extend to 61.8% retracement of 0.9928 to 0.9204 at 0.9651. On the downside, firm break of 55 D EMA (now at 0.9385) will maintain medium term bearishness and bring retest of 0.9204 low.
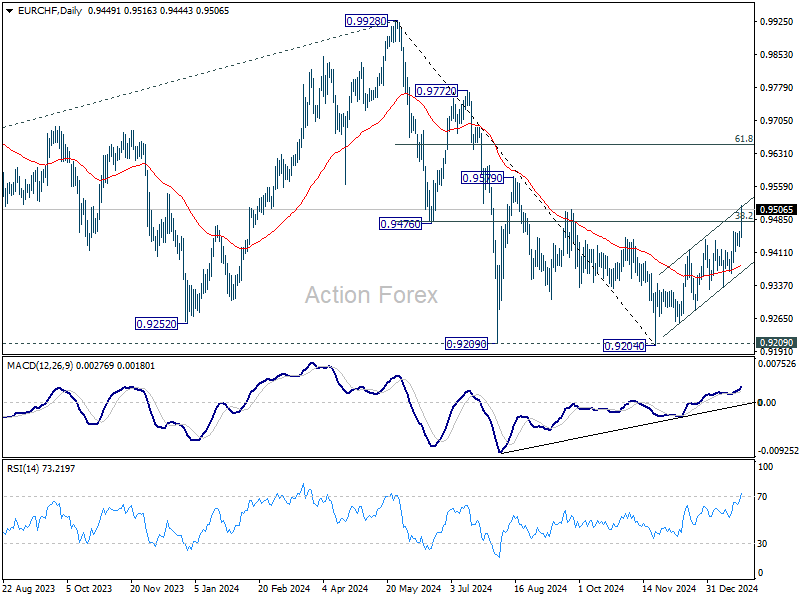
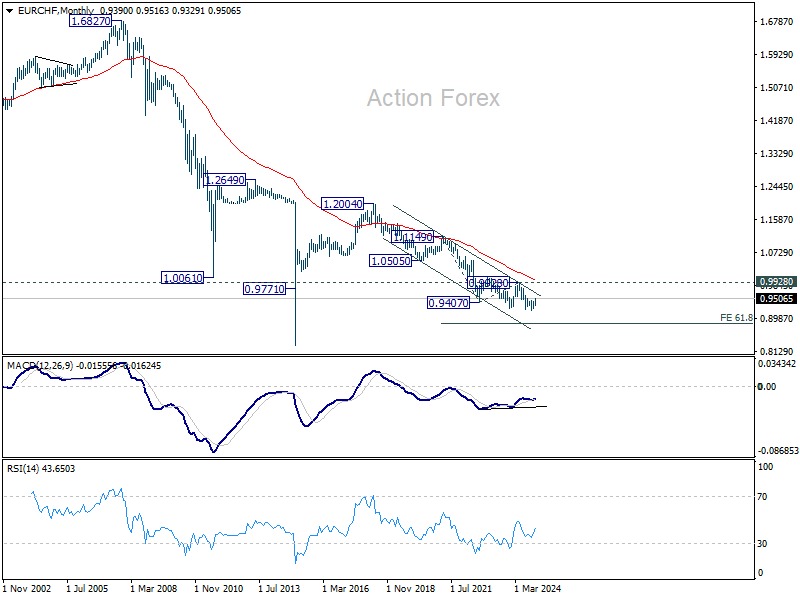
In the long term picture, as long as 0.9928 resistance holds, the multi-decade down trend remains intact, with fall from 1.2004 (2018 high) as another falling leg. Decisive break of 0.9252 (2023 low) will confirm long term down trend resumption to 61.8% projection of 1.1149 to 0.9407 from 0.9928 at 0.8851.
Summary 1/27 – 1/31
Monday, Jan 27, 2025
| GMT | Ccy | Events | Consensus | Previous |
|---|---|---|---|---|
| 01:30 | CNY | NBS Manufacturing PMI Jan | 50.1 | 50.1 |
| 01:30 | CNY | NBS Non-Manufacturing PMI Jan | 52 | 52.2 |
| 05:00 | JPY | Leading Economic Index Nov | 107 | 107 |
| 09:00 | EUR | Germany IFO Business Climate Jan | 84.6 | 84.7 |
| 09:00 | EUR | Germany IFO Current Assessment Jan | 85.4 | 85.1 |
| 09:00 | EUR | Germany IFO Expectations Jan | 84 | 84.4 |
| 15:00 | USD | New Home Sales Dec | 669K | 664K |
| 23:50 | JPY | Corporate Service Price Index Y/Y Dec | 3.20% | 3.00% |
| GMT | Ccy | Events | |
|---|---|---|---|
| 01:30 | CNY | NBS Manufacturing PMI Jan | |
| Forecast: 50.1 | Previous: 50.1 | ||
| 01:30 | CNY | NBS Non-Manufacturing PMI Jan | |
| Forecast: 52 | Previous: 52.2 | ||
| 05:00 | JPY | Leading Economic Index Nov | |
| Forecast: 107 | Previous: 107 | ||
| 09:00 | EUR | Germany IFO Business Climate Jan | |
| Forecast: 84.6 | Previous: 84.7 | ||
| 09:00 | EUR | Germany IFO Current Assessment Jan | |
| Forecast: 85.4 | Previous: 85.1 | ||
| 09:00 | EUR | Germany IFO Expectations Jan | |
| Forecast: 84 | Previous: 84.4 | ||
| 15:00 | USD | New Home Sales Dec | |
| Forecast: 669K | Previous: 664K | ||
| 23:50 | JPY | Corporate Service Price Index Y/Y Dec | |
| Forecast: 3.20% | Previous: 3.00% | ||
Tuesday, Jan 28, 2025
| GMT | Ccy | Events | Consensus | Previous |
|---|---|---|---|---|
| 00:30 | AUD | NAB Business Confidence Dec | -3 | |
| 00:30 | AUD | NAB Business Conditions Dec | 2 | |
| 13:30 | USD | Durable Goods Orders Dec | 0.80% | -1.20% |
| 13:30 | USD | Durable Goods Orders ex Transport Dec | 0.40% | -0.20% |
| 14:00 | USD | S&P/CS Composite-20 HPI Y/Y Nov | 4.10% | 4.20% |
| 14:00 | USD | Housing Price Index M/M Nov | 0.20% | 0.40% |
| 15:00 | USD | Consumer Confidence Jan | 105.7 | 104.7 |
| 23:50 | JPY | BoJ Meeting Minutes |
| GMT | Ccy | Events | |
|---|---|---|---|
| 00:30 | AUD | NAB Business Confidence Dec | |
| Forecast: | Previous: -3 | ||
| 00:30 | AUD | NAB Business Conditions Dec | |
| Forecast: | Previous: 2 | ||
| 13:30 | USD | Durable Goods Orders Dec | |
| Forecast: 0.80% | Previous: -1.20% | ||
| 13:30 | USD | Durable Goods Orders ex Transport Dec | |
| Forecast: 0.40% | Previous: -0.20% | ||
| 14:00 | USD | S&P/CS Composite-20 HPI Y/Y Nov | |
| Forecast: 4.10% | Previous: 4.20% | ||
| 14:00 | USD | Housing Price Index M/M Nov | |
| Forecast: 0.20% | Previous: 0.40% | ||
| 15:00 | USD | Consumer Confidence Jan | |
| Forecast: 105.7 | Previous: 104.7 | ||
| 23:50 | JPY | BoJ Meeting Minutes | |
| Forecast: | Previous: | ||
Wednesday, Jan 29, 2025
| GMT | Ccy | Events | Consensus | Previous |
|---|---|---|---|---|
| 00:30 | AUD | Monthly CPI Y/Y Dec | 2.50% | 2.30% |
| 00:30 | AUD | CPI Q/Q Q4 | 0.40% | 0.20% |
| 00:30 | AUD | CPI Y/Y Q4 | 2.50% | 2.80% |
| 00:30 | AUD | RBA Trimmed Mean CPI Q/Q Q4 | 0.60% | 0.80% |
| 00:30 | AUD | RBA Trimmed Mean CPI Y/Y Q4 | 3.30% | 3.50% |
| 05:00 | JPY | Consumer Confidence Jan | 36.5 | 36.2 |
| 07:00 | EUR | Germany GfK Consumer Sentiment Feb | -20.5 | -21.3 |
| 09:00 | CHF | UBS Economic Expectations Jan | -20 | |
| 09:00 | EUR | Eurozone M3 Money Supply Y/Y Dec | 4.10% | 3.80% |
| 13:30 | USD | Goods Trade Balance (USD) Dec P | -105.4B | -102.9B |
| 13:30 | USD | Wholesale Inventories Dec P | 0.10% | -0.20% |
| 14:45 | CAD | BoC Rate Decision | 3.00% | 3.25% |
| 15:30 | CAD | BoC Press Conference | ||
| 15:30 | USD | Crude Oil Inventories | -1.0M | |
| 19:00 | USD | Fed Rate Decision | 4.50% | 4.50% |
| 19:30 | USD | FOMC Press Conference | ||
| 21:45 | NZD | Trade Balance (NZD) Dec | -437M |
| GMT | Ccy | Events | |
|---|---|---|---|
| 00:30 | AUD | Monthly CPI Y/Y Dec | |
| Forecast: 2.50% | Previous: 2.30% | ||
| 00:30 | AUD | CPI Q/Q Q4 | |
| Forecast: 0.40% | Previous: 0.20% | ||
| 00:30 | AUD | CPI Y/Y Q4 | |
| Forecast: 2.50% | Previous: 2.80% | ||
| 00:30 | AUD | RBA Trimmed Mean CPI Q/Q Q4 | |
| Forecast: 0.60% | Previous: 0.80% | ||
| 00:30 | AUD | RBA Trimmed Mean CPI Y/Y Q4 | |
| Forecast: 3.30% | Previous: 3.50% | ||
| 05:00 | JPY | Consumer Confidence Jan | |
| Forecast: 36.5 | Previous: 36.2 | ||
| 07:00 | EUR | Germany GfK Consumer Sentiment Feb | |
| Forecast: -20.5 | Previous: -21.3 | ||
| 09:00 | CHF | UBS Economic Expectations Jan | |
| Forecast: | Previous: -20 | ||
| 09:00 | EUR | Eurozone M3 Money Supply Y/Y Dec | |
| Forecast: 4.10% | Previous: 3.80% | ||
| 13:30 | USD | Goods Trade Balance (USD) Dec P | |
| Forecast: -105.4B | Previous: -102.9B | ||
| 13:30 | USD | Wholesale Inventories Dec P | |
| Forecast: 0.10% | Previous: -0.20% | ||
| 14:45 | CAD | BoC Rate Decision | |
| Forecast: 3.00% | Previous: 3.25% | ||
| 15:30 | CAD | BoC Press Conference | |
| Forecast: | Previous: | ||
| 15:30 | USD | Crude Oil Inventories | |
| Forecast: | Previous: -1.0M | ||
| 19:00 | USD | Fed Rate Decision | |
| Forecast: 4.50% | Previous: 4.50% | ||
| 19:30 | USD | FOMC Press Conference | |
| Forecast: | Previous: | ||
| 21:45 | NZD | Trade Balance (NZD) Dec | |
| Forecast: | Previous: -437M | ||
Thursday, Jan 30, 2025
| GMT | Ccy | Events | Consensus | Previous |
|---|---|---|---|---|
| 00:00 | NZD | ANZ Business Confidence Jan | 62.3 | |
| 00:30 | AUD | Import Price Index Q/Q Q4 | -1.50% | -1.40% |
| 06:30 | EUR | France Consumer Spending M/M Dec | 0.10% | 0.30% |
| 06:30 | EUR | France GDP Q/Q Q4 P | 0.00% | 0.40% |
| 07:00 | CHF | Trade Balance (CHF) Dec | 4.50B | 5.42B |
| 08:00 | CHF | KOF Economic Barometer Jan | 100.5 | 99.5 |
| 09:00 | EUR | Germany GDP Q/Q Q4 P | -0.10% | 0.10% |
| 09:30 | GBP | Mortgage Approvals Dec | 65K | 66K |
| 09:30 | GBP | M4 Money Supply M/M Dec | 0.20% | 0.00% |
| 10:00 | EUR | EurozoneGDP Q/Q Q4 P | 0.10% | 0.40% |
| 10:00 | EUR | Eurozone Unemployment Rate Dec | 6.30% | 6.30% |
| 10:00 | EUR | Eurozone Economic Sentiment Indicator Jan | 93.3 | 93.7 |
| 10:00 | EUR | Eurozone Industrial Confidence Jan | -14.1 | |
| 10:00 | EUR | Eurozone Services Sentiment Jan | 5.9 | |
| 10:00 | EUR | Eurozone Consumer Confidence Jan F | -14.2 | -14.2 |
| 13:15 | EUR | ECB Deposit Rate | 2.75% | 3.00% |
| 13:15 | EUR | ECB Main Refinancing Rate | 2.90% | 3.15% |
| 13:30 | USD | Initial Jobless Claims (Jan 24) | 225K | 223K |
| 13:30 | USD | GDP Annualized Q4 P | 2.60% | 3.10% |
| 13:30 | USD | GDP Price Index Q4 P | 2.50% | 1.90% |
| 13:45 | EUR | ECB Press Conference | ||
| 15:00 | USD | Pending Home Sales M/M Dec | -0.90% | 2.20% |
| 15:30 | USD | Natural Gas Storage | -223B | |
| 23:30 | JPY | Tokyo CPI Y/Y Jan | 3.00% | |
| 23:30 | JPY | Tokyo CPI Core Y/Y Jan | 2.50% | 2.40% |
| 23:30 | JPY | Tokyo CPI Core-Core Y/Y Jan | 2.40% | |
| 23:30 | JPY | Unemployment Rate Dec | 2.50% | 2.50% |
| 23:50 | JPY | Retail Trade Y/Y Dec | 2.90% | 2.80% |
| GMT | Ccy | Events | |
|---|---|---|---|
| 00:00 | NZD | ANZ Business Confidence Jan | |
| Forecast: | Previous: 62.3 | ||
| 00:30 | AUD | Import Price Index Q/Q Q4 | |
| Forecast: -1.50% | Previous: -1.40% | ||
| 06:30 | EUR | France Consumer Spending M/M Dec | |
| Forecast: 0.10% | Previous: 0.30% | ||
| 06:30 | EUR | France GDP Q/Q Q4 P | |
| Forecast: 0.00% | Previous: 0.40% | ||
| 07:00 | CHF | Trade Balance (CHF) Dec | |
| Forecast: 4.50B | Previous: 5.42B | ||
| 08:00 | CHF | KOF Economic Barometer Jan | |
| Forecast: 100.5 | Previous: 99.5 | ||
| 09:00 | EUR | Germany GDP Q/Q Q4 P | |
| Forecast: -0.10% | Previous: 0.10% | ||
| 09:30 | GBP | Mortgage Approvals Dec | |
| Forecast: 65K | Previous: 66K | ||
| 09:30 | GBP | M4 Money Supply M/M Dec | |
| Forecast: 0.20% | Previous: 0.00% | ||
| 10:00 | EUR | EurozoneGDP Q/Q Q4 P | |
| Forecast: 0.10% | Previous: 0.40% | ||
| 10:00 | EUR | Eurozone Unemployment Rate Dec | |
| Forecast: 6.30% | Previous: 6.30% | ||
| 10:00 | EUR | Eurozone Economic Sentiment Indicator Jan | |
| Forecast: 93.3 | Previous: 93.7 | ||
| 10:00 | EUR | Eurozone Industrial Confidence Jan | |
| Forecast: | Previous: -14.1 | ||
| 10:00 | EUR | Eurozone Services Sentiment Jan | |
| Forecast: | Previous: 5.9 | ||
| 10:00 | EUR | Eurozone Consumer Confidence Jan F | |
| Forecast: -14.2 | Previous: -14.2 | ||
| 13:15 | EUR | ECB Deposit Rate | |
| Forecast: 2.75% | Previous: 3.00% | ||
| 13:15 | EUR | ECB Main Refinancing Rate | |
| Forecast: 2.90% | Previous: 3.15% | ||
| 13:30 | USD | Initial Jobless Claims (Jan 24) | |
| Forecast: 225K | Previous: 223K | ||
| 13:30 | USD | GDP Annualized Q4 P | |
| Forecast: 2.60% | Previous: 3.10% | ||
| 13:30 | USD | GDP Price Index Q4 P | |
| Forecast: 2.50% | Previous: 1.90% | ||
| 13:45 | EUR | ECB Press Conference | |
| Forecast: | Previous: | ||
| 15:00 | USD | Pending Home Sales M/M Dec | |
| Forecast: -0.90% | Previous: 2.20% | ||
| 15:30 | USD | Natural Gas Storage | |
| Forecast: | Previous: -223B | ||
| 23:30 | JPY | Tokyo CPI Y/Y Jan | |
| Forecast: | Previous: 3.00% | ||
| 23:30 | JPY | Tokyo CPI Core Y/Y Jan | |
| Forecast: 2.50% | Previous: 2.40% | ||
| 23:30 | JPY | Tokyo CPI Core-Core Y/Y Jan | |
| Forecast: | Previous: 2.40% | ||
| 23:30 | JPY | Unemployment Rate Dec | |
| Forecast: 2.50% | Previous: 2.50% | ||
| 23:50 | JPY | Retail Trade Y/Y Dec | |
| Forecast: 2.90% | Previous: 2.80% | ||
Friday, Jan 31, 2025
| GMT | Ccy | Events | Consensus | Previous |
|---|---|---|---|---|
| 00:30 | AUD | PPI Q/Q Q4 | 0.90% | |
| 00:30 | AUD | PPI Y/Y Q4 | 3.90% | |
| 05:00 | JPY | Housing Starts Y/Y Dec | -3.40% | -1.80% |
| 07:00 | EUR | Germany Retail Sales M/M Dec | -0.20% | -0.60% |
| 07:30 | CHF | Real Retail Sales Y/Y Dec | 0.60% | 0.80% |
| 08:55 | EUR | Germany Unemployment Change Dec | 10K | |
| 08:55 | EUR | Germany Unemployment Rate Dec | 6.10% | |
| 13:00 | EUR | Germany CPI M/M Jan P | 0.00% | 0.50% |
| 13:00 | EUR | Germany CPI Y/Y Jan P | 2.60% | |
| 13:30 | CAD | GDP M/M Nov | 0.20% | 0.30% |
| 13:30 | USD | Personal Income M/M Dec | 0.40% | 0.30% |
| 13:30 | USD | Personal Spending M/M Dec | 0.50% | 0.40% |
| 13:30 | USD | PCE Price Index M/M Dec | 0.10% | |
| 13:30 | USD | PCE Price Index Y/Y Dec | 2.40% | |
| 13:30 | USD | Core PCE Price Index M/M Dec | 0.20% | 0.10% |
| 13:30 | USD | Core PCE Price Index Y/Y Dec | 2.80% | |
| 13:30 | USD | Employment Cost Index Q4 | 1.00% | 0.80% |
| 14:45 | USD | Chicago PMI Jan | 39.9 | 36.9 |
| GMT | Ccy | Events | |
|---|---|---|---|
| 00:30 | AUD | PPI Q/Q Q4 | |
| Forecast: | Previous: 0.90% | ||
| 00:30 | AUD | PPI Y/Y Q4 | |
| Forecast: | Previous: 3.90% | ||
| 05:00 | JPY | Housing Starts Y/Y Dec | |
| Forecast: -3.40% | Previous: -1.80% | ||
| 07:00 | EUR | Germany Retail Sales M/M Dec | |
| Forecast: -0.20% | Previous: -0.60% | ||
| 07:30 | CHF | Real Retail Sales Y/Y Dec | |
| Forecast: 0.60% | Previous: 0.80% | ||
| 08:55 | EUR | Germany Unemployment Change Dec | |
| Forecast: | Previous: 10K | ||
| 08:55 | EUR | Germany Unemployment Rate Dec | |
| Forecast: | Previous: 6.10% | ||
| 13:00 | EUR | Germany CPI M/M Jan P | |
| Forecast: 0.00% | Previous: 0.50% | ||
| 13:00 | EUR | Germany CPI Y/Y Jan P | |
| Forecast: | Previous: 2.60% | ||
| 13:30 | CAD | GDP M/M Nov | |
| Forecast: 0.20% | Previous: 0.30% | ||
| 13:30 | USD | Personal Income M/M Dec | |
| Forecast: 0.40% | Previous: 0.30% | ||
| 13:30 | USD | Personal Spending M/M Dec | |
| Forecast: 0.50% | Previous: 0.40% | ||
| 13:30 | USD | PCE Price Index M/M Dec | |
| Forecast: | Previous: 0.10% | ||
| 13:30 | USD | PCE Price Index Y/Y Dec | |
| Forecast: | Previous: 2.40% | ||
| 13:30 | USD | Core PCE Price Index M/M Dec | |
| Forecast: 0.20% | Previous: 0.10% | ||
| 13:30 | USD | Core PCE Price Index Y/Y Dec | |
| Forecast: | Previous: 2.80% | ||
| 13:30 | USD | Employment Cost Index Q4 | |
| Forecast: 1.00% | Previous: 0.80% | ||
| 14:45 | USD | Chicago PMI Jan | |
| Forecast: 39.9 | Previous: 36.9 | ||
Markets Weekly Outlook – Fed to Extend Pause as Trump Era Begins
- US equities markets rose due to President Trump’s pro-business policies and decision to not impose tariffs on major trading partners yet.
- The Bank of Japan raised rates to 0.5%, the highest since 2008.
- The week ahead sees markets shift attention toward Central Bank policy with the ECB and Fed meeting in focus.
Week in Review: Trump Effect Takes Hold as Uncertainties Rise
Markets had a bit of a roller coaster ride this week thanks to the incoming Trump administration in the US. Markets got some of what they expected while they also received a fair amount of shocks to keep market participants guessing.
US equities got off to a flying start which was not a surprise as President Trump was always seen as pro business and growth. A number of executive orders followed the inauguration and focused on business growth and lowering taxes.
However, the biggest decision this week and one which shows some form of growth and maturity from President Trump as opposed to his first term, was his take on tariffs.
Even though President Trump talked tough about protectionist trade policy during his campaign, he decided not to impose tariffs on major trading partners this week. On Thursday night, he eased tensions with China by saying he’d prefer not to use tariffs against them. This sparked a positive reaction in the markets that pushed the S&P 500 to fresh all-time highs.
The S&P 500 has risen 2% this week (at the time of writing), putting it on course for the best start for a new president since Ronald Reagan took office in 1985.
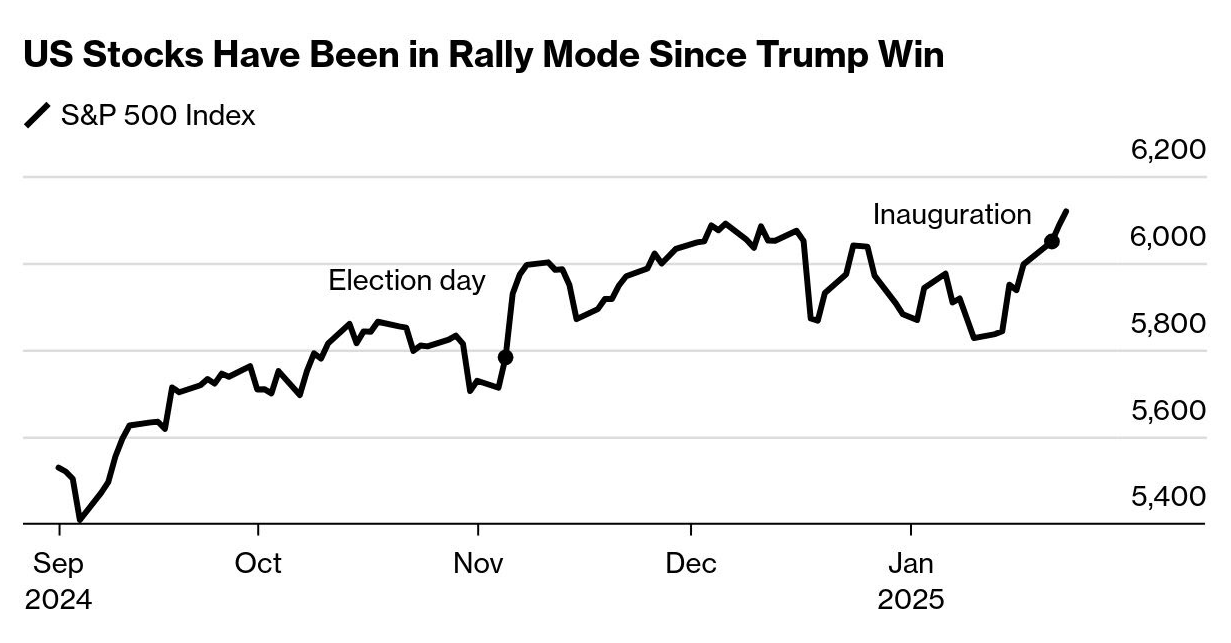
Source: Bloomberg (click to enlarge)
On the FX front, the US dollar faced challenges because President Trump’s tariff strategy wasn’t expected to drive inflation as much as immediate tariffs would. This coupled with his pledge to bring the cost of living down has stoked hopes that inflation may continue to fall and rate cuts may arrive at a quicker pace than previously thought.
This is a fluid situation and could change as more data and tariff discussions take place.
The Bank of Japan meanwhile did proceed with the expected rate hike of 25 bps as discussed in last week’s market outlook. This brings the policy rate to 0.5%, its highest level since October 2008, during the global financial crisis. The Japanese yen climbed sharply after the decision but was unable to consolidate these gains. For a full breakdown on the decision, read BoJ hikes rates, yen pares gains.
The Euro and the GBP have put in impressive runs at the back end of the week with both breaking out of periods of consolidation and run into key levels of resistance.
The commodities complex saw Gold run toward its all time highs, falling just short at the time of writing with a daily high of 2786.88. The gains in Gold look to be down to concerns around tariffs as despite President Trump holding off on tariffs now he did also mention that Canada, Mexico and China may be hit with tariffs on February 1.
Oil prices struggled and President Trump once again played his part. The US President stated on Thursday and Friday that he wants to see OPEC cut the price of Oil. This as well as the potential of tariffs affecting global growth weighed on Oil prices this week.
The crypto sector like US equities were significant beneficiaries of the incoming administration and its policies. For a full read on the impact and way forward for Bitcoin, read Bitcoin (BTC/USD) Volatility Measures are Tightening Up. Is it Time for Another Major Move?
The Week Ahead: Central Bank Meetings to the Fore, ECB and Fed
Asia Pacific Markets
The main focus this week in the Asia Pacific region is month-end data from Japan and another look at China’s manufacturing sector with PMI data being released.
From Japan we will be getting the month-end data dump, covering inflation, labor, industrial production, and retail sales. The Tokyo CPI is expected to drop from 3.0% in December to 2.6% in January, thanks to the government’s utility subsidies.
The Bank of Japan should watch service prices, which may rise due to better household incomes. The job market remains tight, with unemployment at 2.5%. This will be interesting after the Bank of Japan’s rate hike this week, with hope that data continues to trend in a positive direction.
China’s Lunar New Year holiday starts next week, so most key data will be released on Monday. Before that, January’s PMI data will be out, and I do think a slight increase in the manufacturing PMI to 50.3 from 50.1 in December. Also on Monday, China’s December industrial profits are expected to show a year-on-year decline for 2024, and the MLF rate is likely to stay at 2.0%.
Lastly we look at Australia, where we have Q4 inflation data being released with markets expecting a YoY print of 2.5% down from the previous print of 2.8%.
Europe + UK + US
In developed markets, the FOMC and European Central Bank meetings will be the main focus.
The US Fed cut rates by 100 basis points in late 2024 and now wants to see signs of economic weakness and lower inflation before making more cuts. Fed policymakers also remained concerned about the impact of potential tariffs on inflation as indicated by the previous meeting minutes.
The tone adopted by Fed Chair Powell as well as his remarks will no doubt be closely monitored. Any references to slower or more aggressive rate cuts are likely to shake up markets.
In Europe we have the European Central Bank meeting. Unlike the lead-up to the ECB’s December meeting, there’s been little public discussion before next week’s meeting. There’s a growing agreement on the need for more rate cuts as growth continues to struggle. ECB President Christine Lagarde hinted that a 25 basis point rate cut next week is almost certain, and more cuts are likely to follow.
GDP data for the Euro Area will also be released which should confirm the sluggish growth mentioned as the reason for further rate cuts. The Euro Area may also be suffering from a weaker winter as well before growth improves which leads me to believe that a rate cut is necessary.
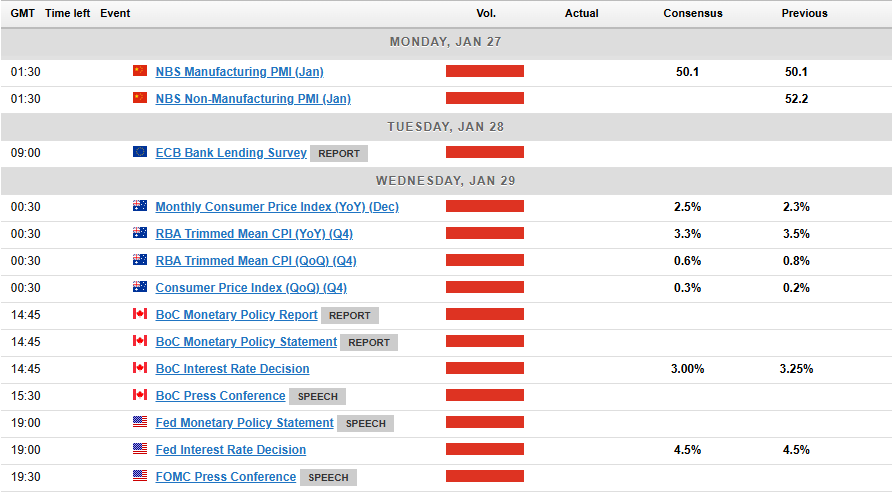
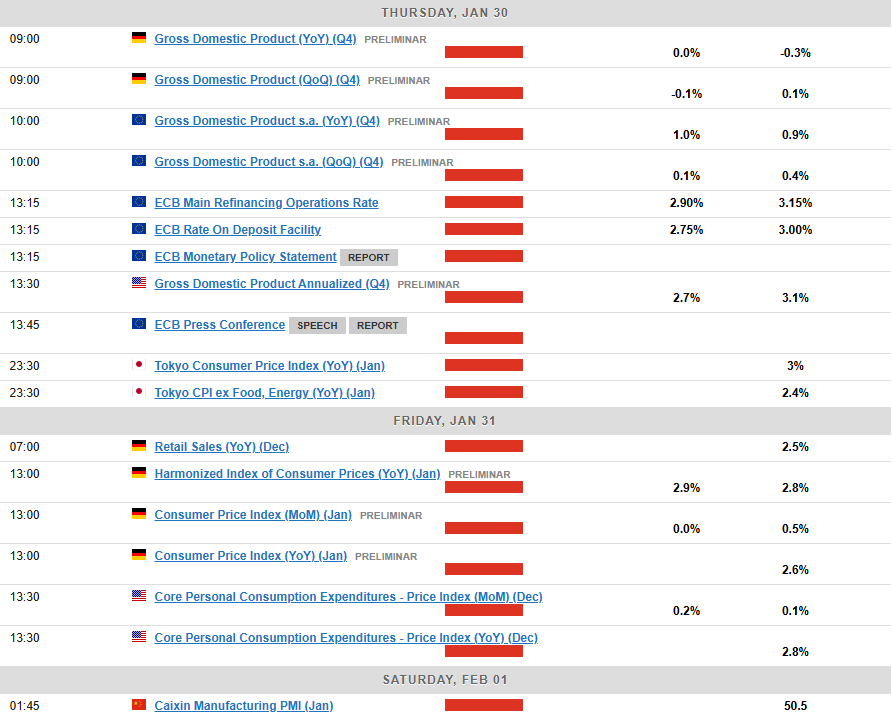
Chart of the Week
This week’s focus is on the US Dollar Index (DXY) after it continued its descent from two-year highs.
The Dollar Index struggled this week after breaking below the ascending trendline on Monday in the aftermath of the Presidential Inauguration.
Since then the DXY has extended its losses with a bearish Thursday and Friday.
The index has now bounced off a key area of support at the 107.20 handle which is the upper band of the support zone that stretches till 106.85.
A bounce from here could push the DXY back toward resistance at the 108.00 handle before the 108.50 and 109.00 come into focus.
Now if the DXY is able to break below the support zone between 107.20 106.85 then attention turns to key support areas at 106.13 and 105.63.
US Dollar Index (DXY) Daily Chart – January 24, 2025
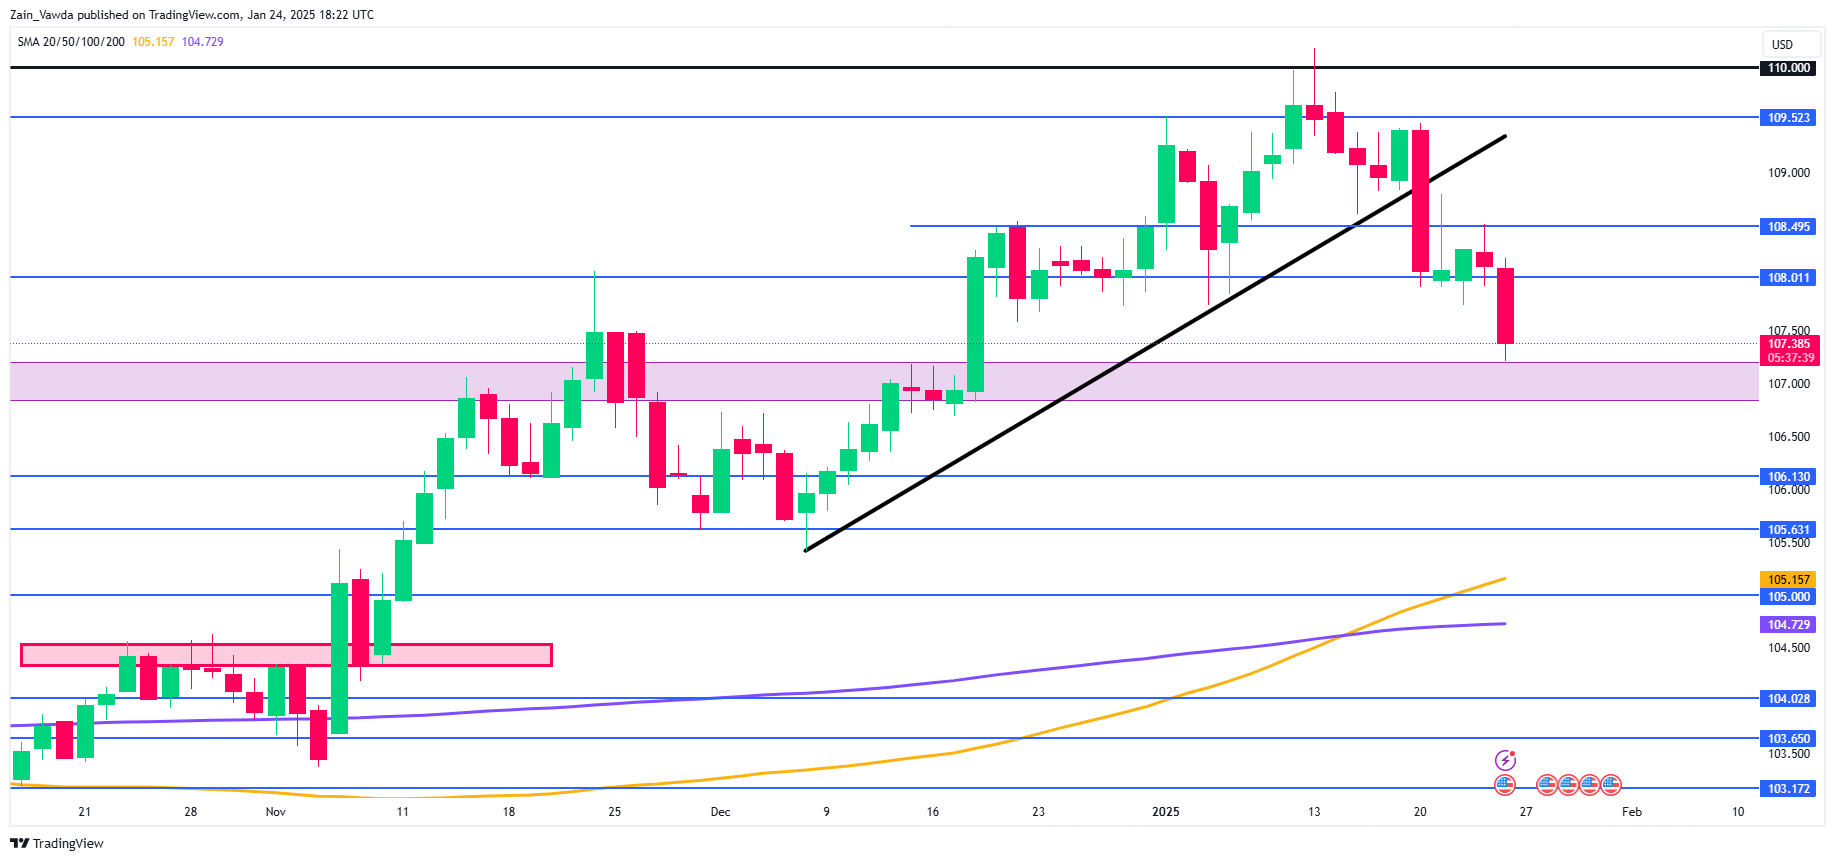
Source: TradingView.Com (click to enlarge)
Key Levels to Consider:
Support
- 106.85
- 106.13
- 105.63
Resistance
- 108.00
- 108.49
- 109.00
The Weekly Bottom Line: A Wild First Week
Canadian Highlights
- The inaugural week of Trump’s presidency reminded markets how quickly sentiment can shift. The looming threat of tariffs could raise costs for businesses and consumers on both sides of the border.
- For now, inflation is easing. December inflation data moved closer to the Bank of Canada’s target, with consumer inflation expectations anchoring around historical norms.
- Retail sales were weak in November, but December’s rebound in the flash estimate suggest stronger year-end activity, supporting a more gradual 25-basis-point cut next week.
U.S. Highlights
- President Donald Trump was sworn in as 47th President on Monday and wasted no time signing a barrage of executive orders.
- While President Trump did not impose any tariffs in Week 1, he threatened Canada and Mexico with a 25% tariff (and later China with a 10% tariff) as early as February 1st.
- But without any immediate action, financial markets breathed a sigh of relief, though this could be short lived as the February 1st deadline quickly approaches.
Canada – Tariff Threat Looms Just as Economy Shows Improvement
If the inaugural week is anything to go by, the next four years of Trump’s presidency promise to be a roller coaster for Canada. Volatility in the Canadian dollar underscores how quickly sentiment can shift: reports of delayed tariffs early Monday lifted the Loonie by more over 1%, only for it to erase those gains later in the day, when Trump announced plans for tariffs as high as 25% on Mexico and Canada by February 1st. At the time of writing, the exchange rate has stabilized around $0.698 per CAD, about a percent lower than last week.
As history shows tariffs beget tariffs. The Canadian government warned that if imposed, these tariffs will trigger retaliatory measures on up to C$150 billion worth of U.S. goods. Our report this week sets the record straight: Canada is America’s largest export market, with nearly US$350 billion goods and services crossing Canada’s border over the first three quarters of 2024. The negative impact of tariffs would ripple through business supply chains, raising costs and creating inflationary pressures at the retail level – far from the economic relief Trump promised during his campaign.
A full-blown trade war remains an outlier scenario, but even targeted tariffs could undermine consumer demand on both sides of the border. The Bank of Canada’s recent Business Outlook Survey, sheds light on how firms perceived these risks in the fourth quarter of last year. Conducted after the presidential election but before Trump’s 25% tariff threat on Canada and Mexico in late November, businesses reported concerns over potentially higher input costs due to trade tensions. These costs, if realized, are likely to be passed on to consumers to some extent.
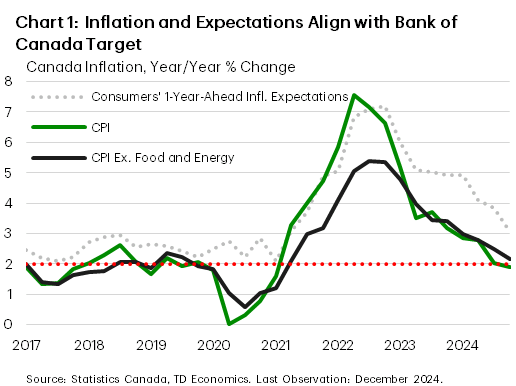
This disruption comes just as the Canadian economy shows signs of recovery. December’s inflation data moved closer to the Bank of Canada’s 2% target (Chart 1). While some price categories were temporarily affected by GST tax break, others, like shelter inflation, have seen relief from lower rates. In addition, consumer inflation expectations – as measured by the Canadian Survey of Consumer Expectations – are settling around historical norms, reinforcing confidence in the Bank’s ability to instill price stability.
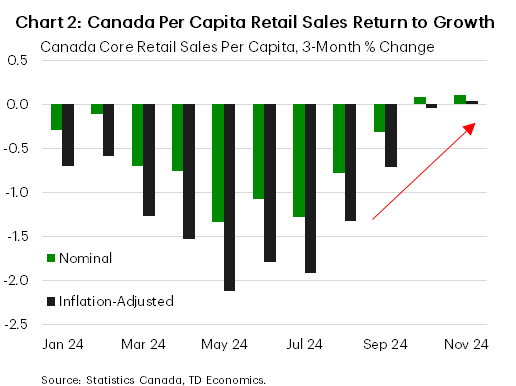
Consumer demand, though soft, continues to recover. November’s retail sales data showed core retail sales (excluding autos and gas) declined by a sizeable 1.0%, but the three-month trend in real core retail sales per capita continued to recover (Chart 2). Spending at restaurants also saw robust gains in November, suggesting consumers are increasing outlays on discretionary areas. Furthermore, the strong flash estimate for December is encouraging, as the GST tax break would weigh on nominal spending tallies as they include GST receipts. On balance, this week’s data suggests that the Bank of Canada still needs to continue easing its key rate but proceed more cautiously, with a 25-basispoint cut next week. Markets will also scrutinize the accompanying Monetary Policy Report for insights into how the Bank is incorporating trade risks to its outlook.
U.S. – A Wild First Week
President Trump started his second term in office with a blitz of executive orders targeted at overhauling border and energy policies, pulling out of the global tax deal, unwinding signature Biden administration policies, and imposing a temporary freeze on federal hiring. But perhaps the most surprising development of the week was what didn’t materialize – an executive order to impose universal tariffs on major trading partners.
However, President Trump did put Canada and Mexico (and later China) on notice, threatening each with a 25% tariff (10% on China) as early as February 1st, citing increased illegal immigration and drug flows as the primary motive. In addition, the President directed federal agencies to investigate “unfair and unbalanced” trade practices with the U.S. and has set a deadline of April 1st for specific policy recommendations. For now, President Trump has said “he isn’t ready to move ahead with universal tariffs on goods from around the world”, but his actions this week suggest that the tariff threats shouldn’t be taken lightly.
Financial markets appeared to breath a sigh of relief, with the S&P 500 ending the week 2% higher. However, longer-term Treasury yields were little changed on the week, with the 10-year Treasury yield at 4.65% at the time of writing. Fed funds futures also remained largely unchanged, with 40 bps of cuts priced in by year-end.
Should President Trump follow through on his tariff threats to Canada and Mexico, he would likely have to invoke the International Emergency Economic Powers Act due to both the tight timeline and the fact that he’s tying the tariffs to non-trade related issues. But we view this scenario as unlikely and see the tariff threats as a way of applying pressure to extract concessions. This would include tighter border security from its neighbors and perhaps and early reopening of the North American Trade deal ahead of the scheduled 2026 joint review.
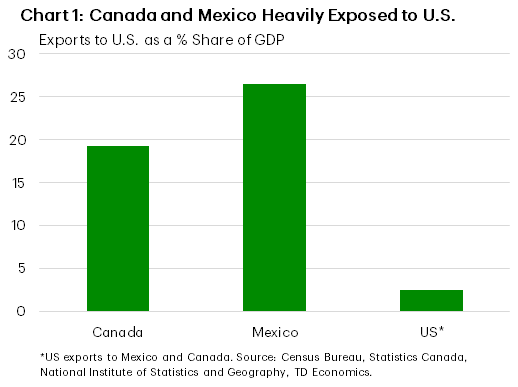
While a full blown North American trade war would benefit no one, it’s clear that the northern and southern neighbors would feel the brunt of the impact. Measured as a share of GDP, exports from Canada and Mexico to the U.S. account for roughly 19% and 26% of their economies. However, combined U.S. exports to these two countries account for little more than 2% of its GDP (Chart 1). But beyond the hit to growth, there’s also the inflation impact to consider. Nearly 60% of the oil & gas imported into the U.S. comes from Canada. Should the U.S. impose a 25% tariff on these imports, or Canada restrict its oil exports as a retaliatory measure, then that alone would have an immediate price impact on U.S. consumers. Beyond the energy dependencies, the North American auto supply chain is also heavily intertwined. Disentangling the production process would be a costly endeavor.
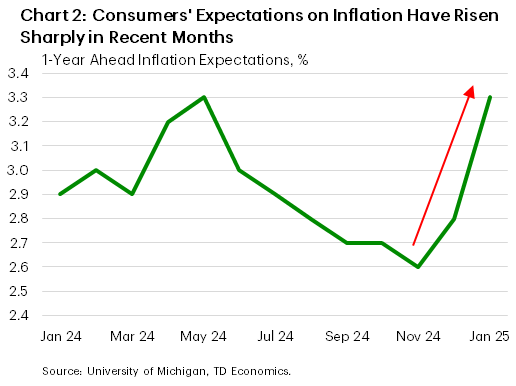
Recent surveys of consumer confidence have already shown a growing unease on the future economic outlook and a jump in inflation expectations (Chart 2). Heighten inflation played a huge role in getting President Trump reelected, and it’ll likely serve as a governor on how far the Republicans are willing to push on tariffs.
Weekly Economic & Financial Commentary: 100 Basis Points Lower & 100 Basis Points Higher
Summary
United States: Changing of the Guard
- Considering a reasonably light domestic indicator schedule this week and the Fed's media blackout period ahead of next week's FOMC meeting, attention was understandably focused on the changing of the guard in Washington and the eagerly anticipated policy details from the new administration which will heavily influence the economic performance over the coming years.
- Next week: FOMC Statement (Wed.), GDP (Thu.), Personal Income and Spending (Fri.)
International: Tariff Discussions Circulate During Trump's First Week
- International economic data flow was relatively light this week. The majority of market participants' attention has been directed toward President Trump's first few days in office, especially pertaining to tariff discussions. Foreign central banks were not particularly active this week, but the Turkish central bank and Bank of Japan met to assess monetary policy.
- Next week: China PMIs (Mon.), Bank of Canada Policy Rate (Wed.), European Central Bank Policy Rate (Thu.)
Interest Rate Watch: 100 Basis Points Lower & 100 Basis Points Higher
- No change in the fed funds rate is expected at next week’s Fed meeting. We explore how a rise in longer-dated Treasury yields could provide a restrictive offset to the Fed’s accommodative moves at the short end of the curve.
Credit Market Insights: Credit Spread Slide
- Credit spreads continued their fall last year, indicating an ongoing uptick in optimism toward the economy among market participants. While spreads have been performing better, investors still remain cautious.
Topic of the Week: Impact of L.A. Wildfires on Shelter Inflation
- The fires that have devastated Los Angeles have led to a frenzied search for rental properties in the area as residents whose homes have been lost or damaged seek new housing. The shock to the region's housing market will materially affect costs in L.A., but will the inflationary impact be felt more broadly in the national macroeconomy?