
Sample Category Title
BoC to Slow Rate Cut Speed as U.S. Fed Moves to the Sidelines
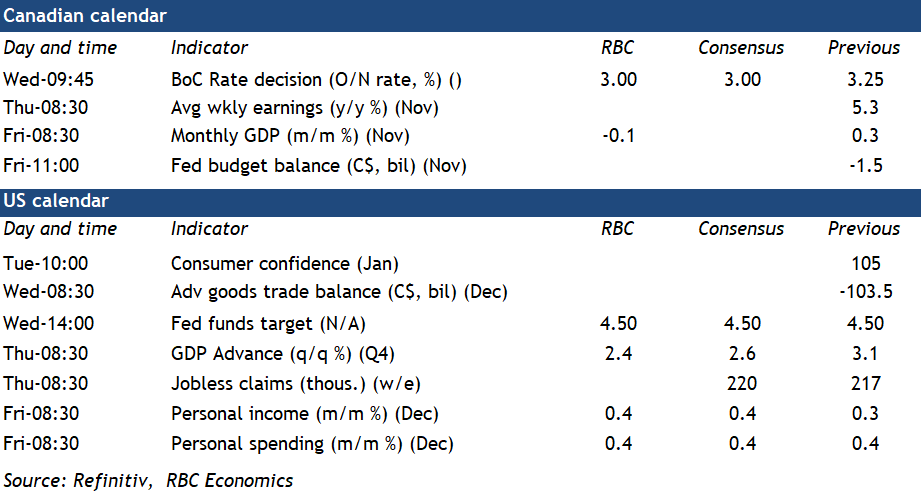
The Bank of Canada is expected to cut interest rates at a more gradual 25 basis-point pace on Wednesday following 50 bps cuts in each of the two prior meetings—widening a gap with U.S. policy rates as the Federal Reserve is widely expected to forego a January rate cut.
A weak Canadian economy has prompted earlier and more aggressive interest rate cuts from the BoC compared to other advanced economy central banks. But the 3.25% current overnight rate is still at the top end of the BoC’s 2.25% to 3.25% estimated range for “neutral,” which would not put upward or downward pressure on growth or inflation over time. It is also well above the 1.75% peak rate in the decade before the global pandemic.
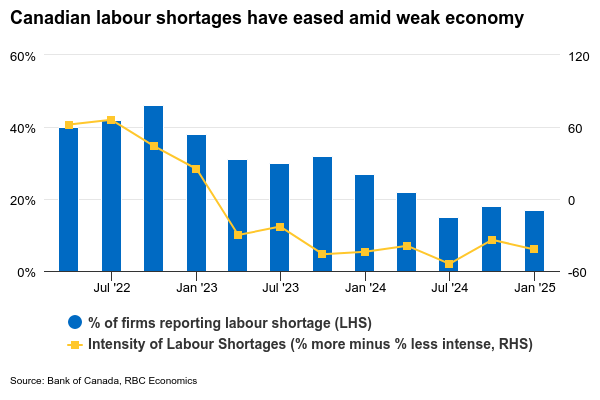
The BoC clearly communicated in its December policy decision that with the interest rate no longer at obviously “restrictive” levels, the pace of future rate cuts would likely be more gradual, and contingent on economic data. Recent Canadian gross domestic product growth and inflation data have been mixed. Q4 GDP growth is tracking close to the BoC’s 2% October forecast and inflation, excluding indirect taxes, ticked higher in December. The BoC’s Q4 business outlook survey flagged some improvement in business sentiment. But, labour markets are still soft enough to argue that more interest rate cuts are needed for the economy to rebound enough to prevent inflation from undershooting the 2% target. We continue to expect the BoC will ultimately need to cut the overnight rate to a slightly stimulative 2% this year.
In December, Governor Tiff Macklem also flagged downside risks to the growth outlook from potential protectionist U.S. trade policy as a “major new uncertainty.” Those concerns have likely only become more pronounced with the new Trump administration threatening to impose aggressive tariffs on imports from Canada as early as next month. We expect policymakers would be more likely to cut interest rates faster and further should those downside risks materialize with the ultimately disinflationary growth and labour market implications from tariff hikes more a concern than a one-time increase in prices. See more on potential tariff impacts here.
The backdrop in the U.S. economy is very different. GDP growth remained firm in Q4 (we expect an 2.4% annualized increase to be reported in the week ahead) and progress on further reducing inflation has been slow. We continue to think an overly stimulative government spending backdrop is helping keep a floor under growth and inflation. Interest rates will need to stay higher for longer to keep growth in consumer prices on a downward trajectory back to the Fed’s 2% objective. The Fed is widely expected to stand pat on interest rates in January. Our base case assumption is the Fed will remain on the sidelines and not cut interest rates this year.
Week ahead data watch
Friday’s Canadian November GDP report should show a 0.1% contraction from October. Manufacturing, retail, and wholesale sale volumes all posted declines in November and oil production in Alberta appears to have largely reversed a sizable October gain. But, early data for December looks firmer with household spending bouncing back in part tied to delayed holiday shopping ahead of Cyber Monday and the start of the GST/HST holiday in mid-December.
We will be watching job openings in Canada’s November payroll report for signs on if a persistent rise in the unemployment rate is getting closer to its end. Job openings in October were still running 23% below year ago levels, but more recent data from indeed.com has shown some improvement late last year and into January.
We expect U.S. personal spending edged up 0.4% in December, mainly driven by higher auto sales and price-related sales increases at gas stations. U.S. personal income likely rose 0.4% in December, in line with the 0.3% increases in average hourly earnings during that month.
Weekly Focus – Sell the Rumour, Buy the Fact?
It was a sell the rumour, buy the fact kind of week, apparently. The fears of Donald Trump imposing massive tariffs on his first day in office did not materialise, and markets cheered. With previous week's US inflation data also still providing solace, equity markets gained, S&P 500 made a new record-high, and the dollar retreated. Tech stocks got a fresh boost from Trump's announced Stargate AI venture, a USD 500 billion private-funded investment program aiming to ensure "the future of technology" in the US. A bit paradoxically, considering the massive number of components the projects will need, the program will further underpin US reliance on Taiwan for chips and other critical inputs.
With regards to Trump's economic policies - tariffs or taxes - we did not get much wiser this week. Thus far, Trump has announced a likely 10% increase to tariffs against China but added he would "rather not use it", and 25% tariffs for Canada and Mexico, in line with his campaign promises. We believe more tariff hikes are in the pipeline, but in the absence of tax cuts, we think the inflationary impact from tariffs alone in the US would be short-lived. Higher prices would dampen consumption, while structural growth is set to slow down in sync with lower immigration and decelerating labour force growth.
With this in mind and considering that lending data points to US interest rates being above neutral, we think the Fed can afford to resume cutting rates in March. However, next week we expect them to pause. As this is also what the market expects, and we expect no strong forward guidance from Powell, we think market reaction will be limited. All eyes remain on Trump, read more on Research US: Fed preview - Not stealing the spotlight, 23 January.
If December rate moves by the Fed and the ECB were essentially a coin-toss, this time around markets have a strong conviction on both. For the ECB meeting next week, we and the consensus expect a 25bp cut. But similar to our Fed call, our expected ECB rate path diverges from market expectations. Markets expect ECB policy rate to land at 2%, we expect two more cuts, and policy rate to reach 1.5% by September. Euro area PMIs provided some relief in December, and hard data from the labour market remains strong. However, soft indicators paint a weaker picture, and we expect wage growth to moderate further, leaving room for the ECB to adjust rates significantly lower. Read more on Flash: ECB preview - No new signals, 23 January.
This week's central bank meetings provided no surprises. Norges Bank kept rates unchanged at 4.5% and firmly guided towards a March cut. The Bank of Japan hiked its policy rate by 0.25% to 0.50% as expected. Recent USD depreciation has been a relief for Japanese authorities and enabled a long-anticipated cut.
Next week, central bank meetings aside, we get a flurry of interesting data releases from the euro area: German Ifo index on Monday, and GDP country data on Thursday. On Thursday, we get euro area Q4 flash GDP data and January flash inflation from Spain (ahead of German and French figures on Friday, and the EA release the week after). In the US, Tuesday brings January durable goods orders ahead of Q4 GDP release on Thursday and PCE inflation on Friday.
Bank of Japan Hikes Rates, Signals More To Come
Summary
- In a widely expected decision, the Bank of Japan (BoJ) took another step along its monetary policy normalization path at this week's meeting, raising its policy rate by 25 bps to 0.50%. In raising interest rates, the BoJ cited firming wage and price developments, while also observing that global markets have remained relatively calm for now.
- The BoJ also forecast underlying inflation to remain at or above its 2% inflation target over the medium term, in our opinion a strong signal of further tightening to come. Comments from Governor Ueda also leaned hawkish, as he said the current policy rate is still far from its “neutral” level, and that he was not considering some specific rate level as a barrier.
- Against this backdrop, we continue to forecast a 25 bps rate hike to 0.75% at the BoJ's April announcement. We now also forecast a final 25 bps rate increase to 1.00% in July, while acknowledging that the timing of that final rate hike could get pushed back depending on how local and global economic conditions evolve. Overall, we think the outlook for Bank of Japan tightening and eventual Fed easing could lead to a reasonably resilient yen through 2025, with more sustained and substantial yen weakness perhaps more likely in 2026 as the U.S. economy recovers.
Bank Of Japan Takes A Further Step Along Its Monetary Policy Normalization Path
In a widely expected decision, the Bank of Japan (BoJ) took another step along its monetary policy normalization path at this week's meeting, raising its policy rate by 25 bps to 0.50%. In raising interest rates, the BoJ said growth and inflation have been developing generally in line with its forecasts, and also cited reasons for a firming in wage and price trends. The BoJ said:
- There have been many views expressed by firms stating that they will continue to raise wages steadily in this year's annual spring labor-management wage negotiations; and
- With wages continuing to rise, there has been an increase in moves to reflect higher costs, such as increased personnel expenses and distribution costs, in selling prices.
The Bank of Japan also noted relative stability in global financial markets, saying “while attention has been drawn to various uncertainties, global financial and capital markets have been stable on the whole, as overseas economies have followed a moderate growth path.”
The Bank of Japan's encouraging assessment of recent economic trends was also reinforced by upward revisions to its economic outlook. While the forecasts for GDP growth were little changed, there were some notable upward revisions to the central bank's inflation forecasts. CPI ex-fresh food inflation is forecast at 2.7% for FY2024 (previously 2.5%), 2.4% for FY2025 (previously 1.9%) and 2.0% for FY2026 (previously 1.9%). In a similar vein, the outlook for CPI ex-fresh food and energy inflation was revised higher to 2.2% for FY 2024 (previously 2.0%), 2.1% for FY2025 (previously 1.9%) and 2.1% for FY2026 (unchanged). The forecast for Japan's underlying inflation to remain at or above the central bank's 2% inflation target over the medium term is, in our opinion, a strong signal of further tightening to come. The Bank of Japan indicated as much in its monetary policy announcement, saying that:
- Given that real interest rates are at significantly low levels, if the outlook for economic activity and prices presented in the January Outlook Report will be realized, the Bank will accordingly continue to raise the policy interest rate and adjust the degree of monetary accommodation.
Hawkish Comments Hint at a Higher Terminal Policy Rate
In addition to the Bank of Japan's announcement, in our view, comments from Governor Ueda also point to multiple further rate hikes from the Bank of Japan over the balance of 2025. Ueda said he expected solid results from this year's spring wage negotiations, a development we think would be supportive of another rate increase in April. Ueda also suggested global markets have been relatively calm in the initial days of President Trump's administration. Interestingly, Ueda also said that even after this week's rate increase, the current policy rate is still far from its “neutral” level, and that he was not considering some specific rate level as a barrier. He indicated that one BoJ analysis suggested the neutral rate could be somewhere between 1.00% and 2.50%. So long as overall economic trends remain encouraging, we view those comments as consistent with the BoJ eventually raising its policy rate to 1.00%, perhaps by its July announcement.
Regarding recent economic trends, labor cash earnings rose 3.0% year-over-year in November and expectations for this year's spring wage talks are upbeat. Inflation also remains elevated, with CPI ex-fresh food inflation at 3.0% year-over-year in December. Sentiment surveys, most notably the Tankan survey, have generally improved in recent quarters, consistent with steadier economic growth ahead. While these encouraging economic trends remain in place, and with global economic conditions perhaps more benign during the early part of this year as the U.S. economy advances at a steady pace and with Fed policy on hold, we view these conditions as most conducive for further Bank of Japan rate hikes. Against this backdrop, we continue to forecast a 25 bps rate hike to 0.75% at the BoJ's April announcement. We now also forecast a final 25 bps rate increase to 1.00% in July, while acknowledging that the timing of that final rate hike could get pushed back depending on how local and global economic conditions evolve. Overall, we think the outlook for Bank of Japan tightening and eventual Fed easing could lead to a reasonably resilient yen through 2025, with more sustained and substantial yen weakness perhaps more likely in 2026 as the U.S. economy recovers.
Dollar’s Accelerated Decline and Indices’ Growth
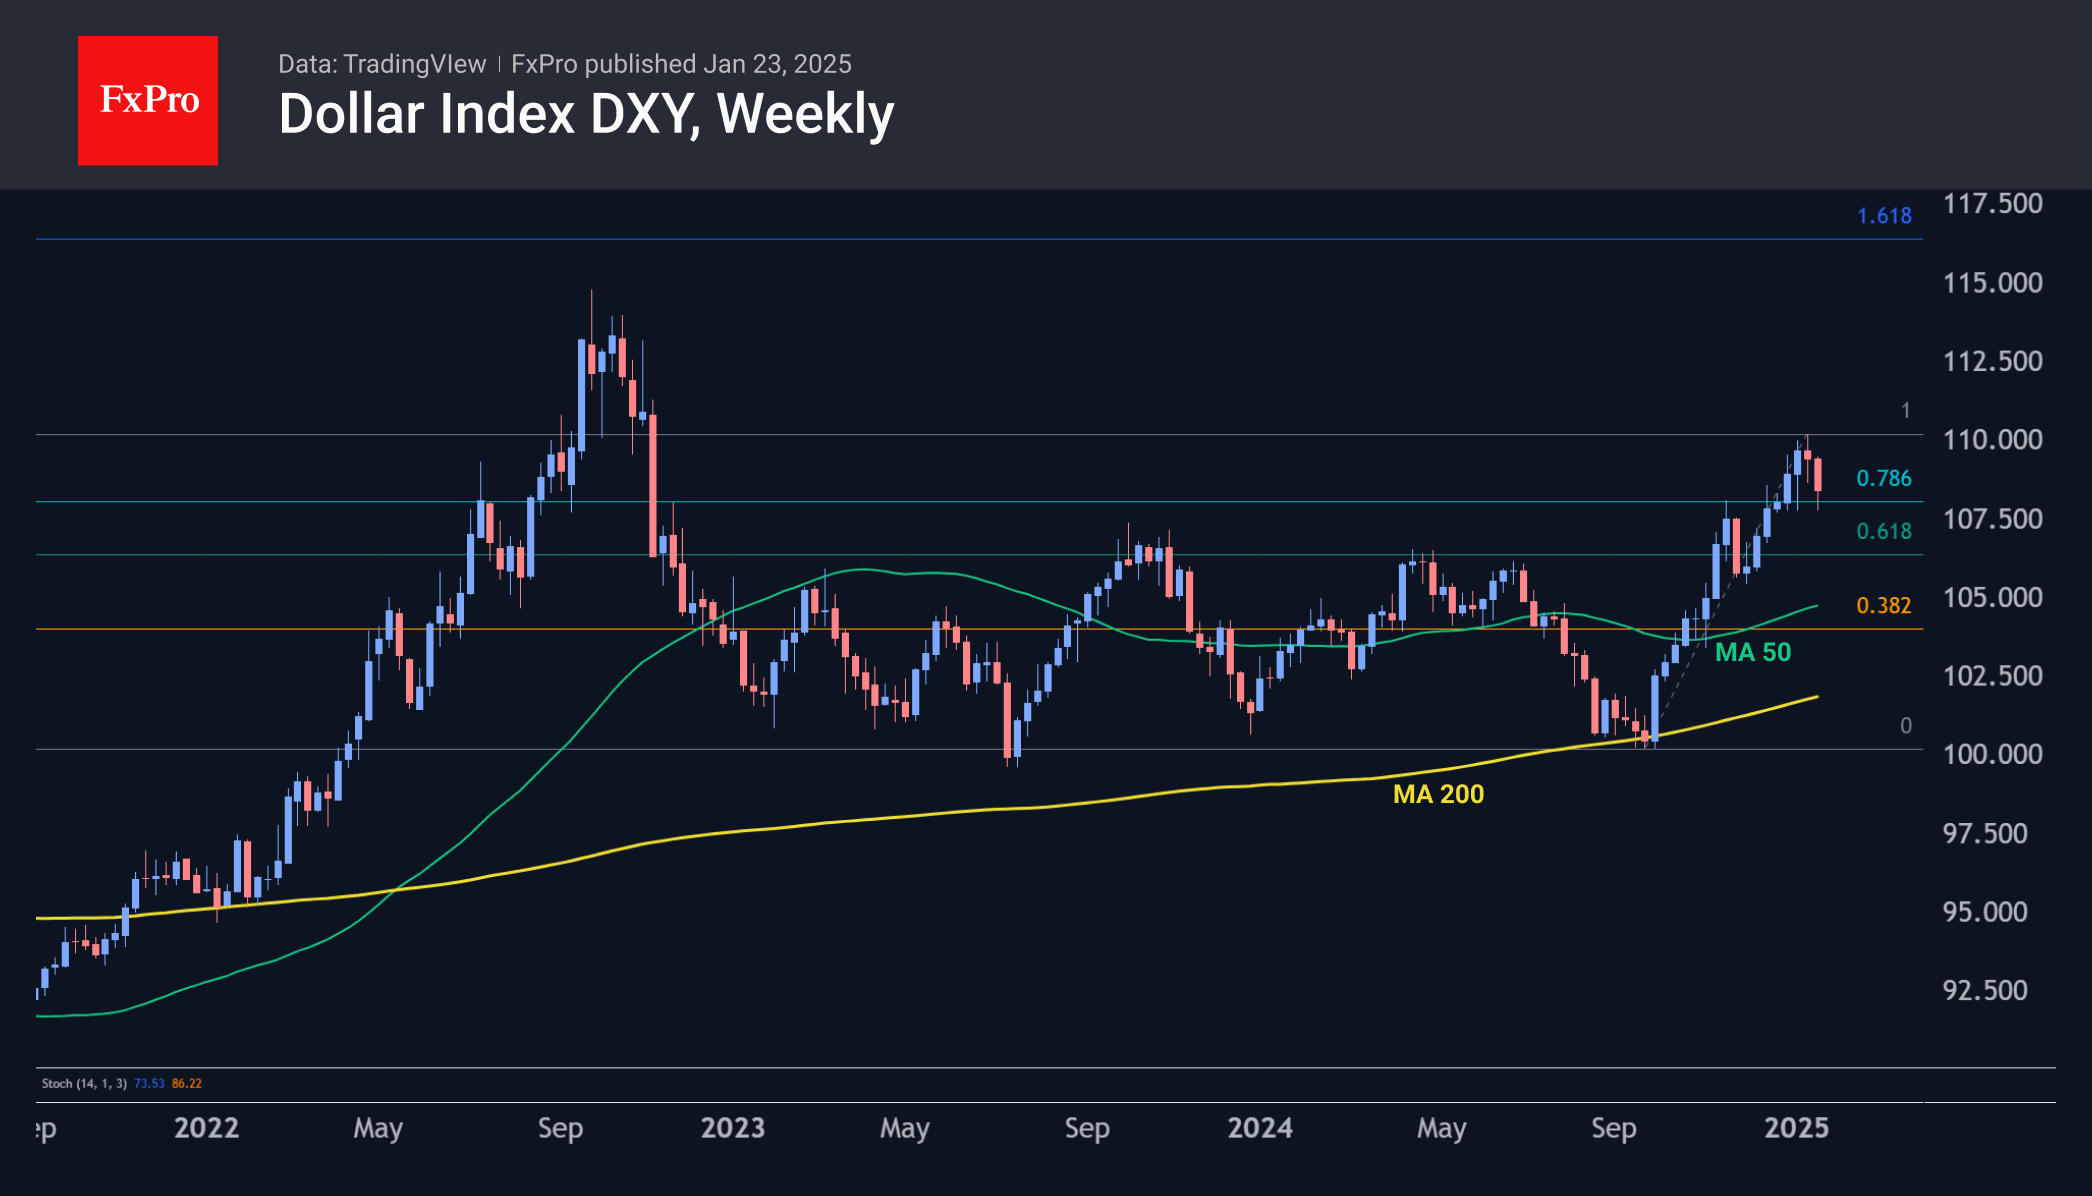
The US dollar accelerated its decline against its major peers, losing almost 2% to 107.1 this week before trimming some losses. Fundamentally, behind the dollar’s corrective pullback is the resurgence of expectations that the Fed will cut its key rate once or twice later this year. We recall that in early January, markets were pricing in a 30% chance of no rate change.
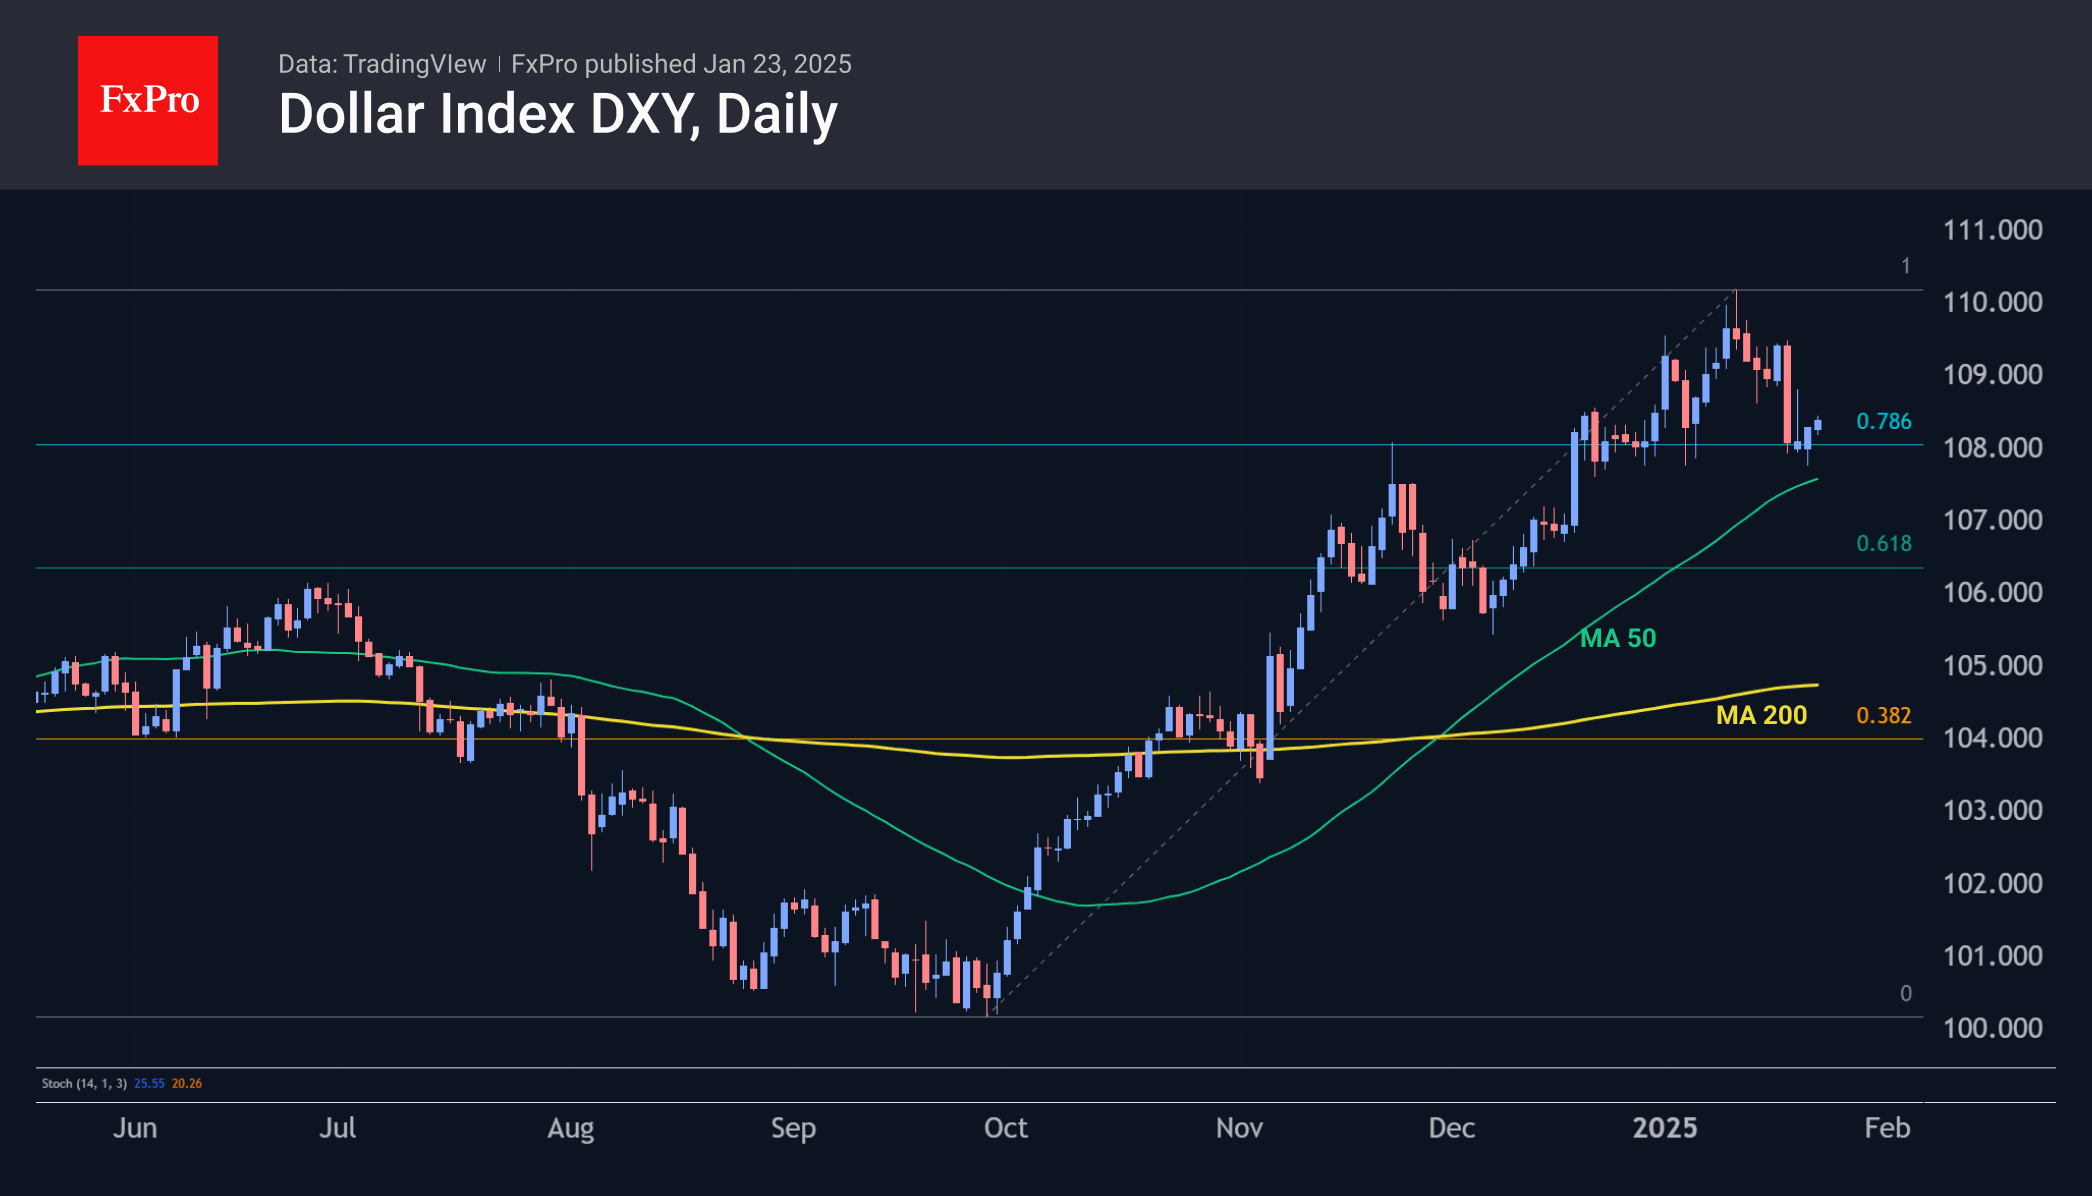
On the tech analysis side, the DXY pullback from 110 to 108 is within the scope of a typical correction. Also in favour of a corrective scenario is that the dollar got support this week on the decline to the 50-day moving average, near the November peaks. A test of this could be repeated next week. A close of the week under 107.40 (50-day MA) would force a deeper decline to 106 or potentially even 105. The ability to quickly return to the 110 area would make the 115-116 area the next bullish target.
Indices
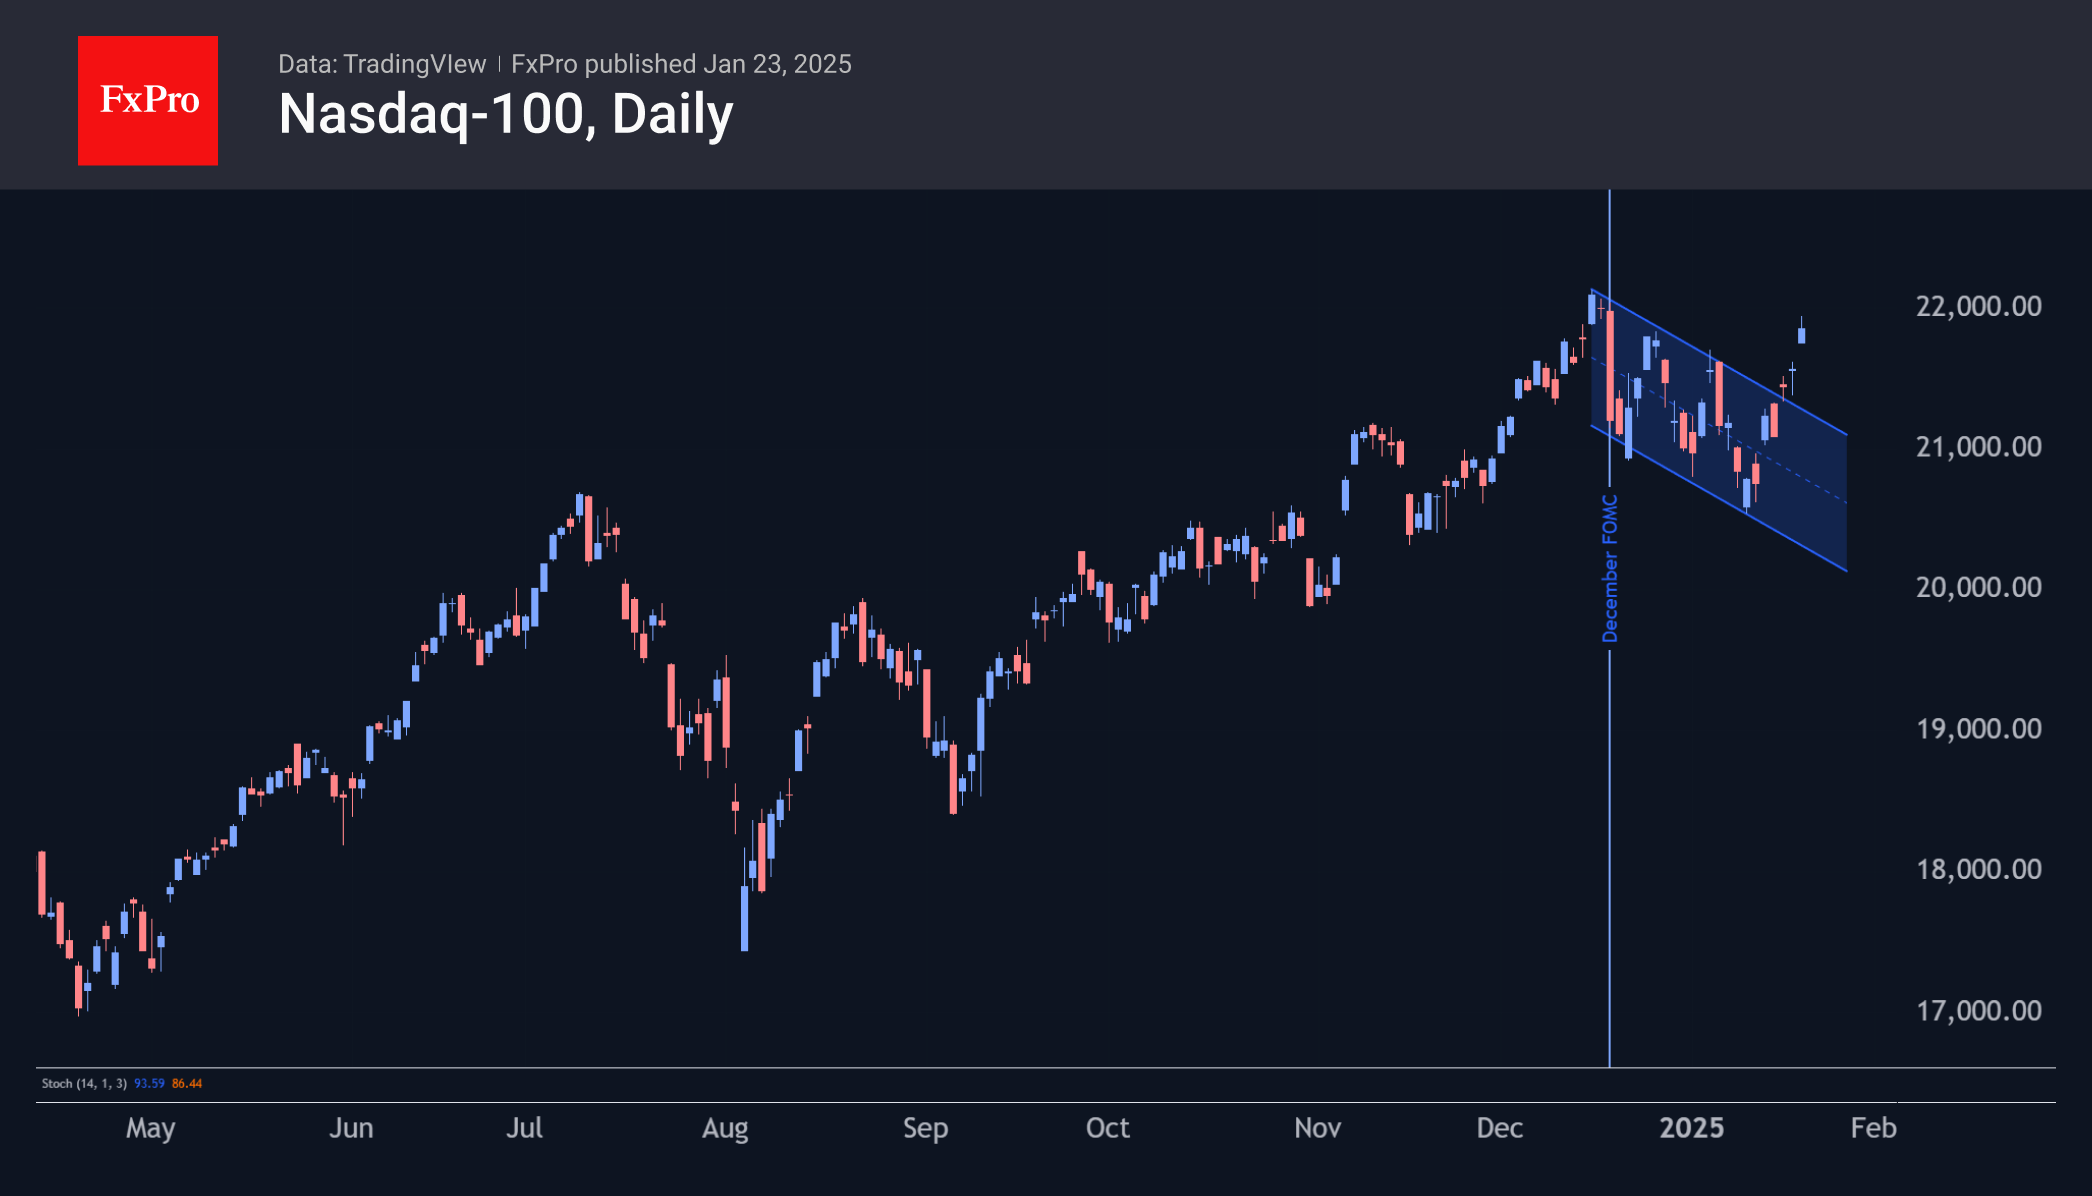
US indices maintained a positive trend for the second week in a row, with the S&P 500 setting a new all-time high above 6100. The Nasdaq100 and Dow Jones are about 1.5% below their records but have broken the downtrend that has been building since the second half of December.
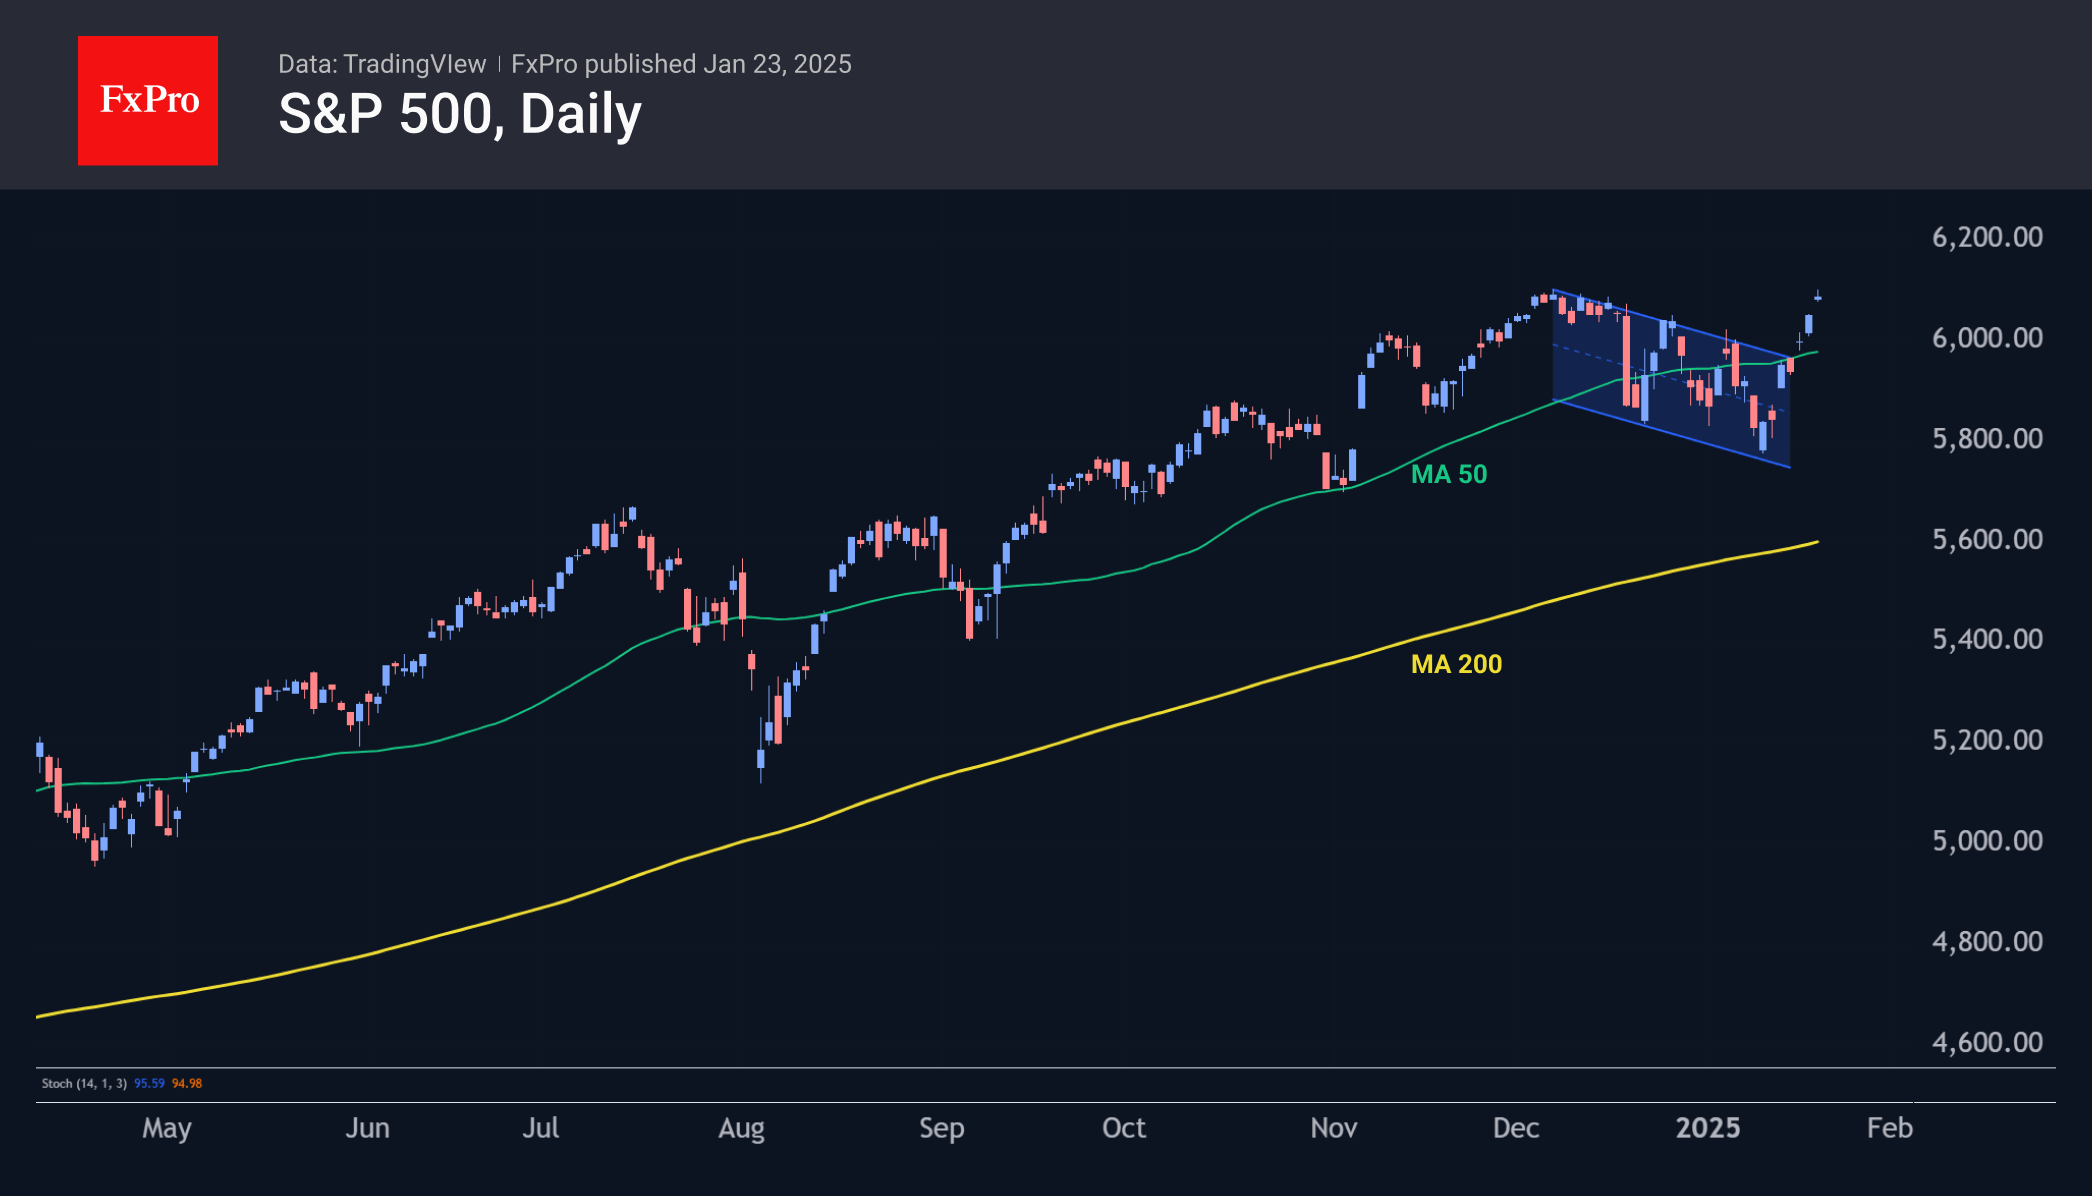
Next week’s central event will be the Fed meeting. In December, the central bank’s tough tone took about 4% off each of the key US stock indices. The markets managed to recover these losses due to strong macroeconomics and company reports. Nevertheless, there are still some concerns that the Fed’s stance may once again deliver an unpleasant surprise.
Gold Extends Gains on Trump’s Latest Comments, Nears Record High
Gold price accelerated higher on Friday, offsetting initial negative signal that was developing on daily chart, from Thursday’s Hanging man candlestick.
Fresh gains (up 1% until early US session on Friday) came ticks ahead of gold’s record high ($2790, posted on Oct 31) and signaling that bulls remain firmly in play.
The yellow metal is on track for a fourth consecutive weekly gain and about 6% advance in January, with recent rally being sparked by uncertainty surrounding President Trump’s trade policies, particularly the latest signals about softer approach to China tariffs and possible trade deal, as well as his calls to lower interest rates.
Contradicting signals in first few days of Trump’s new term in the White House weakened dollar and boosted demand for safe haven gold.
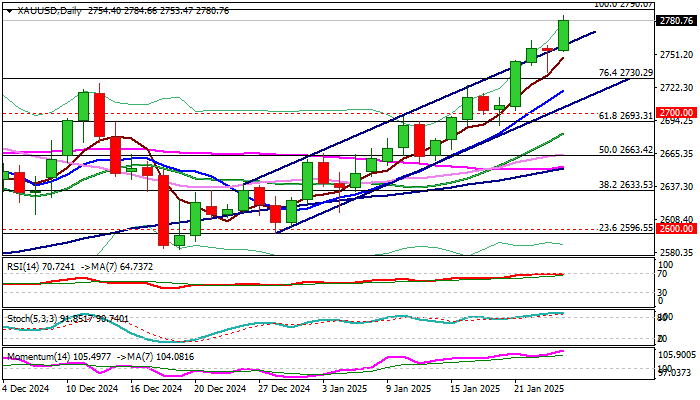
Retest of new all time high and attack at nearby $2800 psychological barrier could be likely scenario in coming sessions, with sustained break higher to signal continuation of larger uptrend, which was on hold during past nearly three months for consolidation.
Fundamentals are likely to remain favorable as reality somewhat diverges from Trump’s post-election rhetoric, particularly in foreign policies, while technical studies remain in firm bullish configuration on daily and weekly chart and underpin the action.
Recent break above bull channel resistance trendline signaled that bulls tighten grip.
However, bulls may face increased headwinds from very significant $2790/$2800 resistance zone and enter consolidative phase before resuming higher.
Dips are likely to be shallow (if current environment remains unchanged) and offer better levels to re-enter bullish market.
Former breakpoints at $2730/21 zone now act as solid supports which should keep the downside protected.
Res: 2784; 2790; 2800; 2850
Sup: 2761; 2748; 2730; 2721
USD/JPY Mid-Day Outlook
Daily Pivots: (S1) 155.59; (P) 156.23; (R1) 156.71; More...
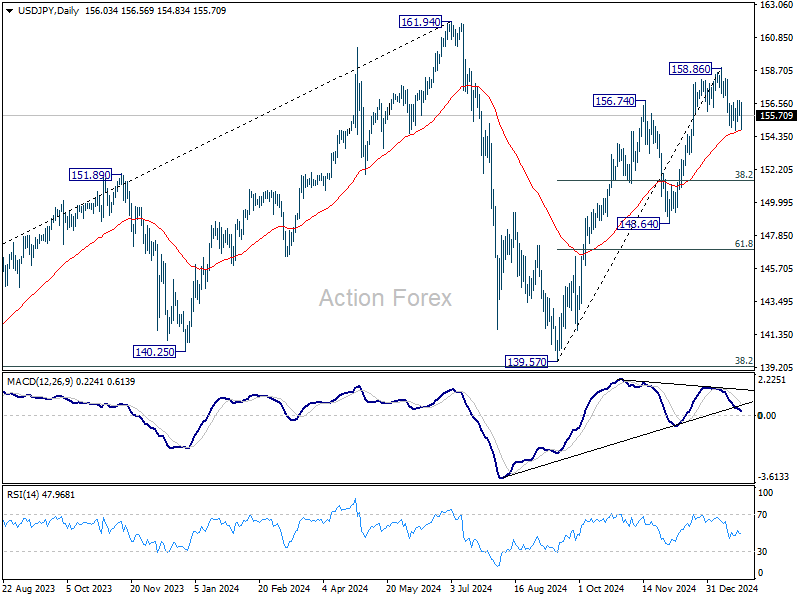
USD/JPY is still bounded in range above 154.77 and intraday bias remains neutral. Further decline remains in favor for now. Sustained trading below 55 D EMA (now at 154.73) will extend the correction from 158.86 to 38.2% retracement of 139.57 to 158.86 at 151.49 next. On the upside, though, above 156.74 minor resistance will bring retest of 158.86 instead.
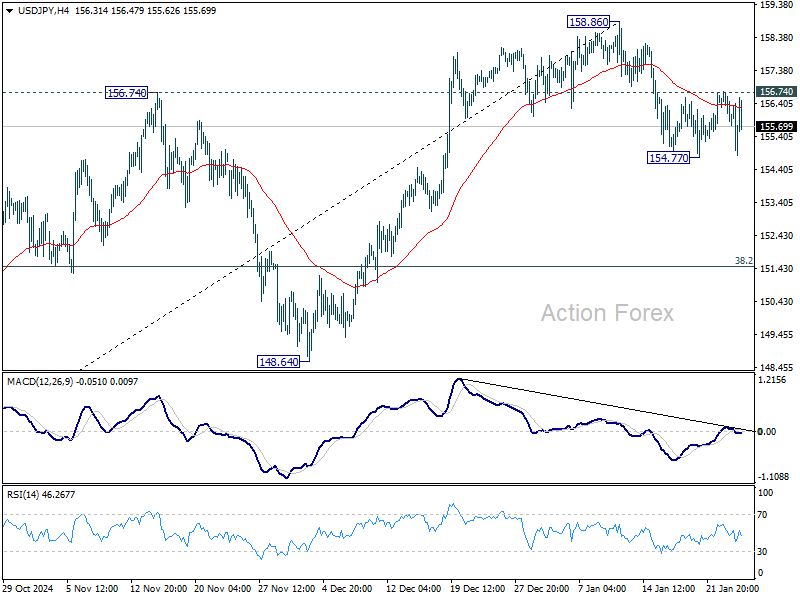
In the bigger picture, price actions from 161.94 are seen as a corrective pattern to rise from 102.58 (2021 low). The range of medium term consolidation should be set between 38.2% retracement of 102.58 to 161.94 at 139.26 and 161.94. Nevertheless, sustained break of 139.26 would open up deeper medium term decline to 61.8% retracement at 125.25.
USD/CHF Mid-Day Outlook
Daily Pivots: (S1) 0.9051; (P) 0.9080; (R1) 0.9103; More…
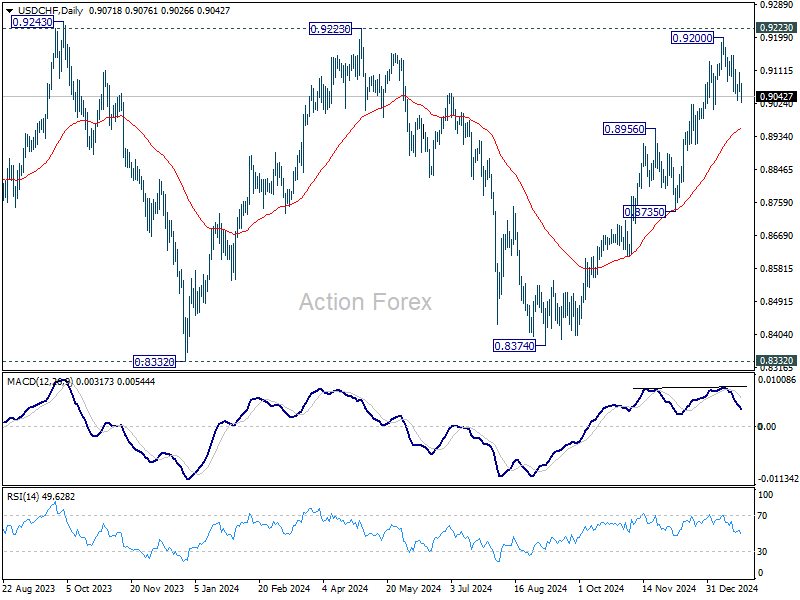
Intraday bias in USD/CHF stays neutral for the moment. Further rally is in favor with 0.9007 support intact. Above 0.9107 minor resistance will turn bias back to the upside for retesting 0.9200 and 0.9223 key resistance. However, firm break of 0.9007 will turn bias back to the downside for deeper pull back to 55 D EMA (now at 0.8954) and possibly below.
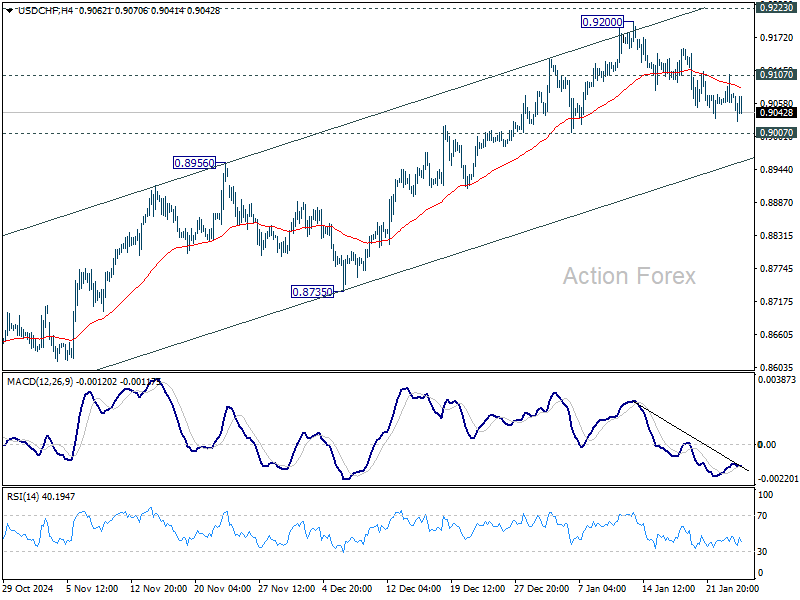
In the bigger picture, as long as 0.9223 resistance holds, price actions from 0.8332 (2023 low) are seen as a medium term corrective pattern. That is, long term down trend is in favor to resume through 0.8332 at a later stage. However, sustained break of 0.9223 will be an important sign of bullish trend reversal.
GBP/USD Mid-Day Outlook
Daily Pivots: (S1) 1.2305; (P) 1.2340; (R1) 1.2388; More...
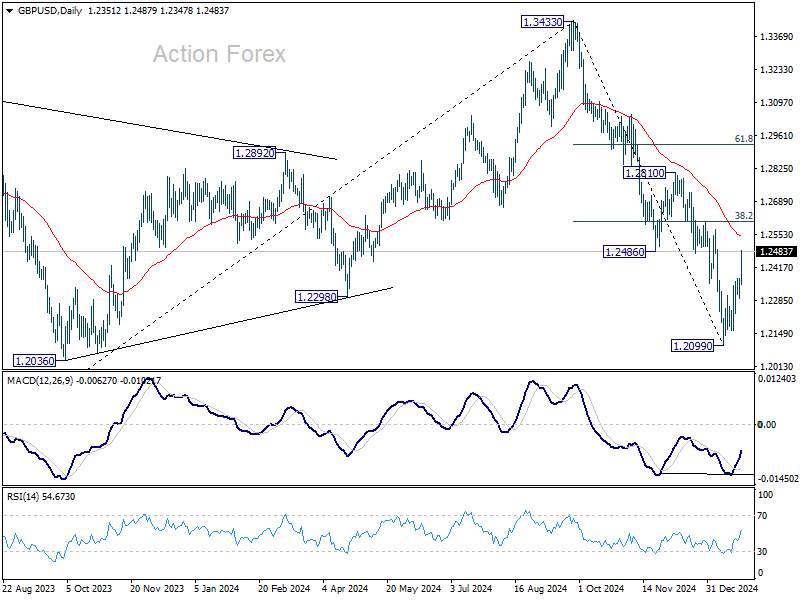
Immediate focus is now on 1.2486 support turned resistance as GBP/USD's rebound from 1.2099 extends. Decisive break there will pave the way to 38.2% retracement of 1.3433 to 1.2099 at 1.2609, and possibly further to 1.2810 resistance. For now, further rally is in favor as long as 1.2292 minor support holds, in case of retreat.
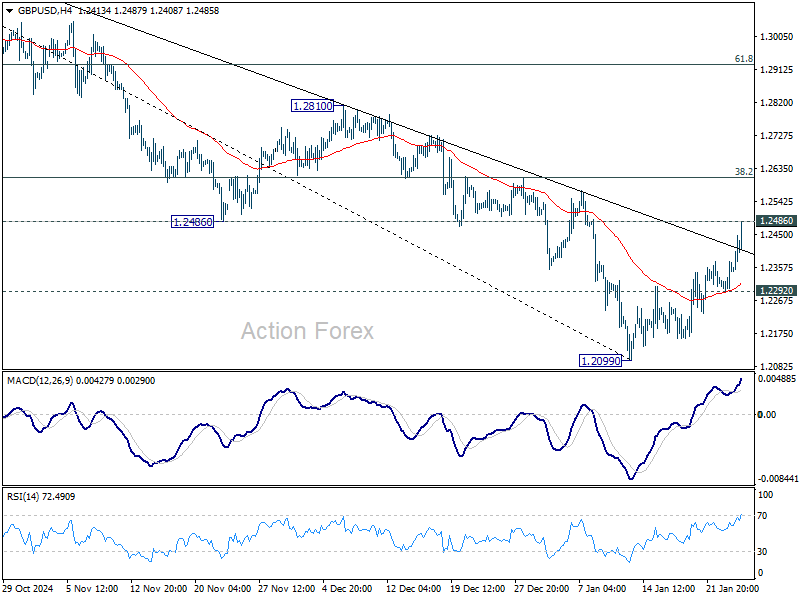
In the bigger picture, rise from 1.0351 (2022 low) should have already completed at 1.3433, and the trend has reversed. Further fall is now expected as long as 1.2810 resistance holds. Deeper decline should be seen to 61.8% retracement of 1.0351 to 1.3433 at 1.1528, even as a corrective move.
EUR/USD Mid-Day Outlook
Daily Pivots: (S1) 1.0379; (P) 1.0409; (R1) 1.0445; More...
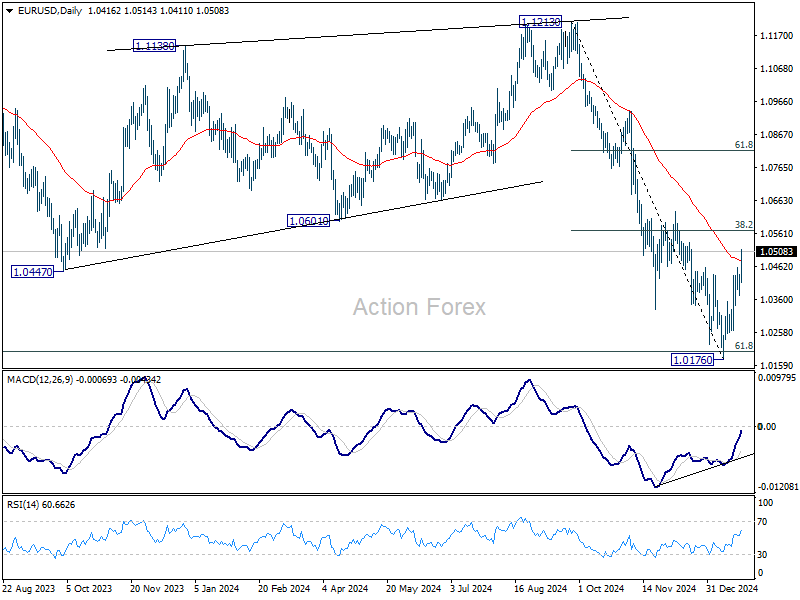
Intraday bias in EUR/USD remains on the upside as rebound from 1.1076 is in progress. Strong resistance might be seen from 38.2% retracement of 1.1213 to 1.0176 at 1.0572 to limit upside. Break of 1.0371 minor support will bring retest of 1.0176 low. However, sustained break of 1.0572 will raise the chance of bullish reversal, and target 61.8% retracement at 1.0817.
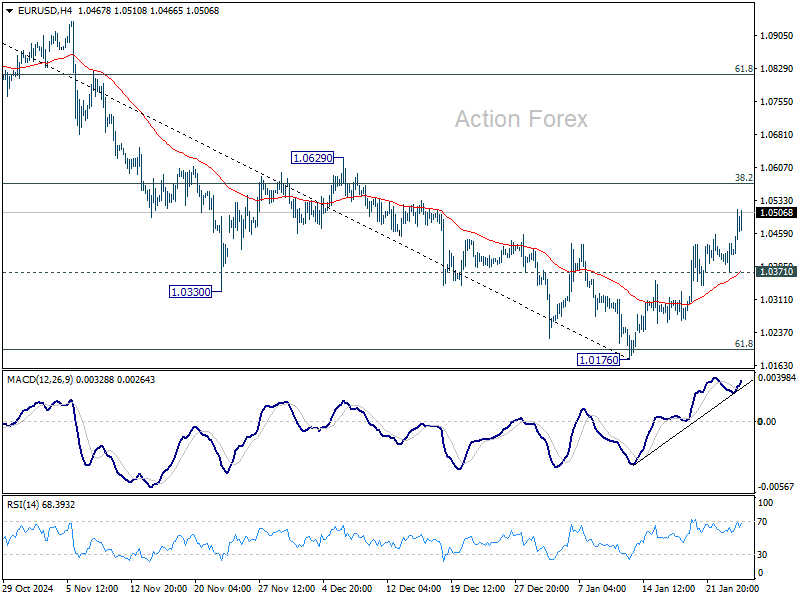
In the bigger picture, fall from 1.1274 (2023 high) should either be the second leg of the corrective pattern from 0.9534 (2022 low), or another down leg of the long term down trend. In both cases, sustained break of 61.8 retracement of 0.9534 to 1.1274 at 1.0199 will pave the way back to 0.9534. For now, outlook will stay bearish as long as 1.0629 resistance holds, even in case of strong rebound.
Euro Strengthens on Optimistic PMI Data; Dollar and Yen Under Pressure
Euro posted notable gains today as lifted by encouraging Eurozone PMI data that suggests the region is beginning the year on firmer footing. Private sector activity showed cautious growth, with reduced drag from manufacturing and moderate expansion in services. Most surprisingly, Germany, which struggled throughout 2024, returned to expansion. Sterling also gained on better PMI readings even though stagnation risks persist, particularly due to accelerated job cuts in the UK.
Dollar extended its decline as risk-on sentiment dominated markets, despite US equity indices taking a breather after strong rallies earlier this week. The greenback is currently the weakest performer for the day, followed by Yen, which gave back its brief gains following BoJ’s widely anticipated rate hike. The Swiss Franc also underperformed, completing a trio of safe-haven currencies that lagged behind in today’s risk-driven market environment.
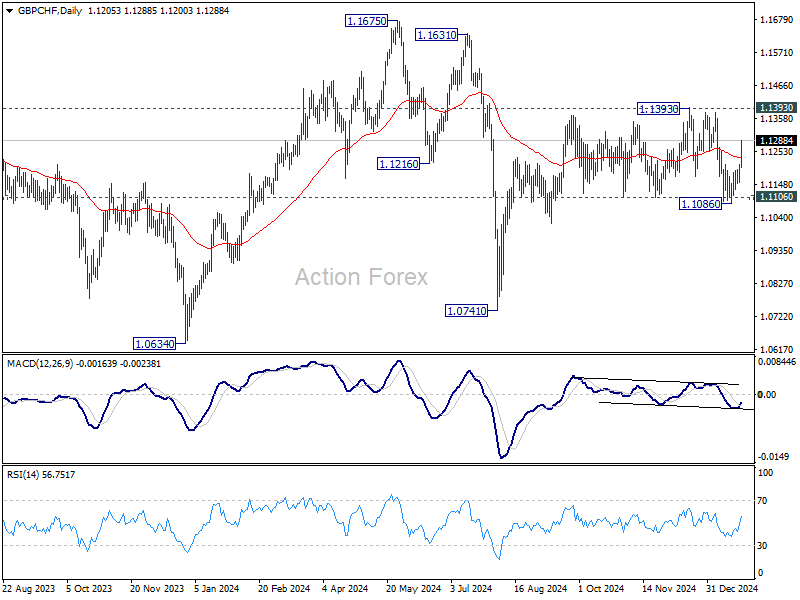
Technically, Swiss Franc’s weakness warrants closer attention. The strong rally in GBP/CHF today suggest that fall from 1.1393 has completed at 1.1086 after defending 1.1106 support. The development keeps the rally from 1.0741 alive. Retest of 1.1393 would be seen next, and firm break there will extend the rise towards 1.1675 high.
In Europe, at the time of writing, FTSE is down -0.75%. DAX is down -0.20%. CAC is up 0.36%. UK 10-year yield is down -0.001 at 4.639. Germany 10-year yield up 0.028 at 2.579. Earlier in Asia, Nikkei fell -0.07%. Hong Kong HSI rose 1.86%. China Shanghai SSE rose 0.70%. Singapore Strait Times fell -0.06%. Japan 10-year JGB yield rose 0.0255 to 1.235.
US PMI composite falls to 9-mth low, optimism holds despite slowing growth and rising costs
US PMI data for January painted a mixed picture. PMI Manufacturing rose from 49.4 to 50.1, reaching a seven-month high and signaling a return to slight expansion. However, PMI Services dropped sharply from 56.8 to 52.8, a nine-month low, dragging PMI Composite down from 55.4 to 52.4, also a nine-month low.
Chris Williamson, Chief Business Economist at S&P Global Market Intelligence, highlighted that US businesses are starting 2025 in an "upbeat mood," with optimism about the new administration driving stronger economic growth. Despite the slowdown in output growth, "sustained confidence" among businesses suggests this deceleration may be temporary. Encouragingly, hiring has surged, with job creation reaching its fastest pace in two and a half years, signaling resilience in the labor market.
However, inflationary pressures are resurfacing, posing risks to the economic outlook. Companies have reported "supplier-driven price hikes" and "wage growth amid poor staff availability." Inflation in input costs and selling prices has been "broad-based across goods and services," which, if sustained, could fuel concerns about hawkish policy approach from the Fed.
UK PMI composite edges higher to 50.9, but stagflation risks cloud economic outlook
UK PMI Composite rose slightly from 50.4 to 50.9 in January, indicating marginal growth. Manufacturing PMI improved from 47.0 to 48.2, while services PMI ticked up from 51.1 to 51.2. Despite these increases, the overall outlook remains gloomy, with underlying concerns about economic weakness and inflationary pressures persisting.
Chris Williamson, Chief Business Economist at S&P Global Market Intelligence, warned that the data "add to the gloom" surrounding the UK economy.
Companies are cutting jobs at the fastest rate since the global financial crisis in 2009, reflecting falling sales and bleak business prospects. Business optimism remains at its lowest levels in two years, accompanied by subdued activity across sectors.
Inflationary pressures have also "reignited," creating what Williamson described as a "stagflationary environment" and a "policy quandary" for BoE.
Eurozone PMI composite hits 50.2 as Germany returns to growth
Eurozone PMI data for January showed cautious improvement, with PMI Composite rising from 49.6 to 50.2, a five-month high, signaling a return to marginal growth. Manufacturing PMI increased to 46.1, its highest in eight months, while services PMI slipped slightly to 51.4 but remained in expansion.
Germany led the improvement, with its PMI Composite climbing from 48.0 to 50.1, marking a seven-month high and a return to expansionary territory. Meanwhile, France lagged behind, with its PMI Composite increasing to 48.3 but remaining below the 50 threshold, indicating continued contraction.
Cyrus de la Rubia, Chief Economist at Hamburg Commercial Bank, described the data as "mildly encouraging." He noted that the private sector had entered a phase of cautious growth, with reduced drag from manufacturing and moderate expansion in services. Germany’s strong rebound played a key role in offsetting the continued weakness in France.
Inflationary pressures, however, remain a concern ahead of next week’s ECB meeting. Input prices in manufacturing rose for the first time in four months, driven by a weaker euro and Germany’s increased CO2 tax. In the services sector, cost inflation persisted, largely due to higher wages. Selling prices in services also remained elevated.
Due to persistent inflation risks and the fragile state of the economy, ECB is likely stick to its gradual pace of cutting interest rates.
BoJ delivers expected rate hike, upgrades core inflation forecasts
BoJ raised its uncollateralized overnight call rate by 25bps to 0.50% as widely expected, marking the highest level since 2008. The decision, made by an 8-1 vote, saw dissent from board member Nakamura Toyoaki, who advocated for a delay until March.
In the new economic projections, core CPI forecasts were significantly revised upward from 1.9% to 2.4% for fiscal 2025, and slightly from 1.9% to 2.0% for fiscal 2026. Core-core CPI (excluding energy and fresh food) forecast was also raised from 1.9% to 2.1% for fiscal 2025, remaining unchanged at 2.1% for fiscal 2026. Real GDP growth projections were left steady at 1.1% for fiscal 2025 and 1.0% for fiscal 2026.
At the post-meeting press conference, Governor Kazuo Ueda downplayed the sharp inflation forecast revisions, stating, "The rise in underlying inflation is moderate. I don't think we are seriously behind the curve in dealing with inflation."
He reiterated the importance of a gradual approach to policy adjustments, and there no "preset idea" on the timing and pace of rate hikes. He also highlighted the estimated neutral range of 1%-2.5%, emphasizing that the current rate of 0.5% still has "some distance" to reach neutral.
Also released, CPI core (ex-food) jumped from 2.7% yoy to 3.0% yoy in December, marking the highest rate in 16 months. CPI core-core (ex-food & energy) was unchanged at 2.4% yoy. Headline CPI rose from 2.9% yoy to 3.6% yoy.
EUR/USD Mid-Day Outlook
Daily Pivots: (S1) 1.0379; (P) 1.0409; (R1) 1.0445; More...
Intraday bias in EUR/USD remains on the upside as rebound from 1.1076 is in progress. Strong resistance might be seen from 38.2% retracement of 1.1213 to 1.0176 at 1.0572 to limit upside. Break of 1.0371 minor support will bring retest of 1.0176 low. However, sustained break of 1.0572 will raise the chance of bullish reversal, and target 61.8% retracement at 1.0817.
In the bigger picture, fall from 1.1274 (2023 high) should either be the second leg of the corrective pattern from 0.9534 (2022 low), or another down leg of the long term down trend. In both cases, sustained break of 61.8 retracement of 0.9534 to 1.1274 at 1.0199 will pave the way back to 0.9534. For now, outlook will stay bearish as long as 1.0629 resistance holds, even in case of strong rebound.