Sample Category Title
Reality Bites
Market exuberance about the US growth outlook has pushed up interest rates and the US dollar, as has the stance of US fiscal policy. But can high interest rates and a seemingly overvalued exchange rate be compatible with ‘US exceptionalism’?
If one ever needed confirmation that financial markets price things primarily based on beliefs about the future, this week gave it. Once it became clear that, no, President Trump was not going to enact sweeping tariffs by executive order on Day 1, the ‘Trump trade’ and ‘American exceptionalism’ drivers of pricing reversed somewhat. The US dollar depreciated, bond yields declined and US share prices slipped. The Australian dollar bounced about three-quarters of a cent against the US dollar in the space of a few hours. These moves did not entirely undo the shifts seen since the US election, but they highlighted just how overbought the Trump trade was. People trade the belief, and then reverse course when reality turns out differently. (And then reverse course again on some actual announcements, but that’s another story.)
The deeper question of the future path of US interest rates remains.
Contrary to last year’s recession worries, US economic growth remains well above past assessments of trend. Unemployment remains low and employment growth robust. Inflation has declined but remains sticky above the Federal Reserve’s 2% target. Compared with other major advanced economies, the United States has been remarkably resilient to tight monetary policy. The US economy has powered along almost as if the fed funds rate had not been so high.
This resilience has been a bit of a puzzle. Low fixed-rate mortgages have long been a factor there, so they cannot fully explain this divergence. Macroeconomic statistics being what they are, one can never completely rule out ‘it was all a mirage and will be revised away eventually’ as an explanation. Stronger balance sheets in the wake of the policy support during the pandemic may be contributing. Also relevant, though, is the role of fiscal policy working in the opposite direction to monetary policy. This is a theme we have highlighted previously.
Conventional macro analysis tells you that it’s the change in the fiscal deficit – sometimes called the ‘fiscal impulse’ – that contributes to economic growth. That said, the level of the deficit surely matters for the level of output, and thus any assessment of how demand and supply compare. And at more than 5% of GDP, the US federal deficit is helping to supercharge demand in an already fully employed US economy. By contrast, because burgeoning public spending in Australia is being more or less matched by rising taxation, the boost to the level of overall demand is smaller.
At this scale, differences in fiscal stance can influence the paths of monetary policy interest rates. In broad terms, the narrative for the last couple of years has been that central banks needed to set monetary policy to be restrictive to get inflation back down to target. Once they were reasonably sure that the disinflation was on track, central banks would start cutting interest rates back towards neutral, wherever that was. Because monetary policy works with a lag, this process needs to start before inflation has returned all the way back to target.
The idea that monetary policy needs to become less restrictive as inflation approaches target remains intact. Less clear, though, is whether interest rates need to converge to ‘neutral’ (r* in the economics jargon) in the short term, or to some other rate.
Where policy rates end up troughing in different economies over the next year or so therefore rests on the answer to two questions.
First, how does the (long-run) neutral rate relate to the central bank’s estimates of it?
It has long been our house view that, wherever neutral is, it is higher than it used to be. The Federal Reserve and other central banks have seen the same developments and revised up their estimates of neutral over the past year or so. Based on the ‘dot plot’ of FOMC members’ views on the ‘long-run’ level of rates, the Fed’s estimates of neutral are centred on 3% or a touch below. This is still a little below our own view that this longer-run concept of neutral is likely to be somewhere in the low to mid 3s.
Depending on how quickly central banks pivot their thinking, it is therefore possible that some central banks will need to backtrack as they discover that the neutral rate they were aiming for is actually higher than they thought. This evolution, and the likely policy actions of the Trump administration, underpin our current forecast that the Fed will start raising rates again in 2026. Policymakers never forecast that they will end up backtracking, so the ‘dot plot’ shows a smoother convergence without a turning point. But it’s also plausible that the smoother path implied by the ‘dot plot’ occurs because policymakers revise up their estimate of neutral further.
(We don’t think the RBA is subject to the same risk of upward revision to their estimates of neutral in the near term. Their models already imply that the neutral nominal cash rate is in the mid 3s, and the recently adopted checklist approach to assessing broader monetary conditions will reduce the risk that statistical inertia in those models leads to underestimates of neutral.)
Second, is long-run ‘neutral’ where monetary policy needs to converge to, or is there something (like fiscal policy) that monetary policy will end up needing to lean against to keep inflation at target?
One could argue that this is making a distinction without a difference: those forces are just the things that cause ‘true r*’ to move around. The issue is that the standard models used by central banks to estimate the neutral rate do not include the impetus from fiscal policy or other factors over which monetary policy has no direct influence. The researchers in this field acknowledge that persistent changes in fiscal policy could affect the level of neutral. But because their models omit any fiscal variables, they cannot quantify the effect.
Despite these shortcomings in the models, FOMC members clearly recognise the issue. The ‘dot plot’ shows that they do not expect the fed funds rate to reach ‘neutral’ until after 2027. So even if their view on neutral is still too low, their recognition that other factors lean against a swift return to neutral will help counterbalance this.
Because other major economies have different fiscal (and growth) outlooks, the shifting market view on US rates has implied shifts in views on interest rate differentials, and so exchange rates. But this puts the US dollar even further above levels at which purchasing powers are at parity, an anchor point that exchange rates tend to gravitate towards over a run of years. Most published measures of the real effective US dollar exchange rate show it at levels surpassed only by the mid-1980s era that ended in the Plaza Accord.
Higher interest rates and a seemingly overvalued exchange rate. One can’t help thinking that reality will bite the US exceptionalism narrative sooner or later.
Cliff Notes: A Flurry of Activity
Key insights from the week that was.
Amid a relatively quiet week for domestic data, the Westpac-DataX Consumer Panel was published for Q4. Using an anonymised sample of over one million Westpac customers, the panel offers detailed insights on income, spending and saving. Over the past six months, it has proven well suited to tracing the impact of the Stage 3 tax cuts. On average, Australian consumers continue to save the vast majority of this income boost, an estimated marginal propensity to consume of 0.25, i.e. 25% of the increase in income, half the assumption used by the Federal Treasury and RBA ahead of time.
The marginal impact of the tax cuts on spending behaviour is also corroborated by Westpac’s Card Tracker. Both sets of analyses imply that, having experienced one of the most severe and prolonged shocks to real disposable incomes in modern history, Australian households are firmly focused on rebuilding savings buffers. The longer this preference remains in place, the greater the likelihood that the rebound in consumer spending will take longer to eventuate, even as pressure eases on disposable income through 2025. With public sector support for GDP expected to moderate, a ‘shaky handover’ of the growth baton from the public to private sector is a distinct possibility.
The timing of interest rate cuts could prove pivotal in deciding the strength and stability of the growth trend. Thankfully, next week’s official update on inflation will offer a clear indication of the near-term rates outlook. As per our preview, we anticipate headline inflation will print at 0.3% (2.5%yr) in Q4 and the trimmed mean at 0.6% (3.3%yr), with risks skewed modestly to the downside. The two key determinants underlying the Q4 results will be the degree to which cost-of-living assistance (including energy rebates and rental assistance) pulls headline inflation lower, and the persistence of the disinflationary trend in the housing group. Ahead of the Australian data, it is worth noting New Zealand’s own Q4 CPI was favourable this week, with both core and domestic inflation continuing to ease, setting the scene for another 50bp cut by the RBNZ at their February meeting.
In the northern hemisphere, the inauguration of Donald Trump as the 47th President of the United States dominated headlines. Political priorities were made clear in speeches given after his inauguration in both Washington and, via video link, at the World Economic Forum in Davos, but policy detail and timing remains in question.
Cutting through the noise, the swath of executive orders largely focussed on reducing energy prices, removing protections for undocumented migrants and investing in AI. On energy, President Trump left the Paris Climate Agreement and abandoned the 'green new deal' while declaring an 'energy emergency' to help bypass regulatory impediments for US oil and gas exploration/ production. Safeguards for AI development were reduced, and Trump also announced an AI infrastructure deal with SoftBank, Open AI and Oracle. There was little clarity around tariffs, a formal directive for relevant government departments to study trade relationships and report back followed quickly by repeated references to the potential for tariffs against a number of nations within weeks. Intriguingly, it was Mexico, Canada and European countries who have trade surpluses with the US that were President Trump’s focus, not China. The intent mentioned in his Davos speech, to use tariffs as a means to encourage US investment and jobs, arguably gives a sense as to why he may be taking this line. Chinese firms, and some from other Asian nations such as South Korea and Taiwan, have a far greater capacity to invest in production facilities in the US than European and Canadian firms – if allowed to and the terms deemed agreeable.
Westpac Chief Economist Luci Ellis this week considered the market’s expectations for monetary policy and the US dollar following inauguration and how these factors, along with the stance of fiscal policy, are likely to impact the health of the US economy.
In China meanwhile, further measures were announced to support their equity market. Broadly, as reported by Bloomberg, the policy adjustments seek to promote equity investment by institutional investors and share buybacks by corporates, with help from the central bank's lending vehicle, while also attracting more retail investors into the equity market through new mutual fund issuance. These are medium-term initiatives, but the timing of the announcements indicates authorities are keen to promote stability in the near term and to take advantage of forthcoming stimulus initiatives to rebuild household wealth through 2025.
Elsewhere, employment data in the UK showed a further easing in the labour market in December. The payrolled employees count was down by 47k in December, while three-month growth in the official employment measure slowed to a seven-month low of 36k, leaving the headline three-month unemployment rate at 4.4%, 0.3ppts higher than three months ago. The ratio of vacancies-to-unemployment, an indicator of the overall labour market situation Bank of England officials follow closely, fell again and is now below pre-pandemic levels. Wages rose a steep 0.4ppts to 5.6%yr in November, however. This increase seems alarming, especially compared to the BoE’s 5.1% forecast for Q4 2024, but it follows more-timely survey data pointing to decelerating pay growth. The BoE’s MPC is therefore likely to look through this pick up in wage inflation and continue cutting interest rates at the next policy meeting, due early February.
BOJ as Expected Raised Policy Rate by 25 bps to 0.50%
Markets
Markets initially still looked for direction as they tried to take stock of the communication avalanche during the first days of the new Trump administration in the US. A tentative steepening move was already developing early in US dealings and this pattern was rubberstamped as US president Trump in a remote address spoke to the Davos World Economic Forum. He elaborated on wide range of topics of his political agenda. Tariffs remain on the table for Canada and Mexico, China and Europe, but he still didn’t give any additional specifications yet. In an interview with Fox later, he even indicated that he rather would prefer not to have to impose taxes on China. However, markets probably mainly reacted to his call/push for OPEC to lower the cost of oil. Trump sees this as an important factor to mitigate inflation and a strong argument for the Fed (and other central bankers) to cut rates. The comments further helped to cap short-term yields. At the end of the day, US yields varied between -0.9 bps (2-y) and +4.25 bps for the long end of the curve (30-y). Even so, Trump’s analysis at least didn’t help to mitigate longer term inflation expectations, being the main driver from the rise at the long and of the US yield curve. German yields rose between 0.9 bps (2-y) and 2.4 bps (30-y). After some hesitation, US equities resumed their uptrend with the S&P 500 (+0.53%) closing at an all-time record. A constructive risk sentiment and a steepening US yield curve weighed on the US dollar. DXY closed marginally lower at 108.05 regained the 1.04 barrier (1.0415). Brent oil extended its decline (close $78.3 p/b).
This morning, the BOJ as expected raised its policy rate by 25 bps to 0.50% (cf. infra). A stronger yen this morning causes Japanese equities to underperform the region (Nikkei -0.1%). At the same time, Chinse markets are drawing some additional comfort from Trump taking a ‘guarded’ approach on raising tariffs. The CSI 300 gains 0.8%. CNY ‘jumps’ against the dollar with USD/CNY declining to currently trade near 7.245 (from 7.282). First indications this morning suggest the steepening of the US yield curve to continue (2-y -3.5 bps) keeping the dollar on the backfoot. DXY drops further testing the 107.6 support area. USD/JPY in a similar pattern is near the YTD lows (154.8 area). EUR/USD is testing (minor) resistance in the 1.0460 area. Later today, markets’ still will mainly be driven by investors adapting positions to the ‘guidance’ from the new Trump administration. However, in Europe we also keep an eye at the first estimate of the January PMI’s. The consensus expects them to remain at levels pointed to limited to no growth (composite PMI 49.7). Maybe there is room for a small upward surprise. We also keep a close look at the price/cost indicators as the ECB is coming closer to a neutral policy stance and as a re-evaluation of its easing trajectory might be on the table at the March policy meeting.
News & Views
The Bank of Japan raised its policy rate by 25 bps to “around 0.50%”, the highest level since 2007-2008. Japan’s economic activity and prices have been developing generally in line the BoJ’s outlook and the likelihood of realizing the outlook has been rising. In such scenario, the BoJ will accordingly continue to raise the policy rate and adjust the degree of monetary accommodation. Especially as the BoJ is less concerned about the future course of overseas economies, particularly the US and developments in financial and capital markets. They dropped that reference, replacing it by “stability on the whole”. The central bank left its GDP forecasts for fiscal year 2024-2026 broadly unchanged at 0.5%-1.1%-1% while rather significantly raising the inflation path: from 2.5%-1.9%-1.9% for headline CPI to 2.7%-2.4%-2% and from 2%-2%-2.1% for core CPI (ex fresh food and energy) to 2.2%-2.1%-2.1%. Core CPI is thus expected to remain above the 2%-target over the policy horizon. The BoJ points out that firms expressed the view that they will continue to raise wages steadily, following the solid wage increases last year. There’s also a reference to higher import prices stemming from the Japanese yen’s depreciation. BoJ governor Ueda will start his press conference as we finish this report. Japanese bond yields add up to 2.5 bps this morning with the belly of the curve underperforming the wings. JPY is slightly stronger, testing the YTD lows around 155. Today’s rate hike was flagged in advance with markets looking for clues in Ueda’s comments on how quick and how much more tightening to expect later this year. Currently, one more 25 bps rate hike is discounted by year-end.
Trump Rocks the Boat
US yields and crude oil fell, and the S&P500 extended gains to a fresh ATH yesterday, as US President Donald Trump said – in his virtual speech in Davos – that he would push for further interest rate cuts and ask OPEC to lower crude prices. He also brought the tariff talk on the table, saying that the EU countries must consider bringing some production to the US to avoid penalties, he said that he will ask NATO members to increase military spending to 5% of their GDP, and that he is willing to lower the corporate tax rate from 21% to 15%. Except for the aim of lowering energy prices, most of Trump’s wishes are inflation-boosters.
PS: interfering with a central bank’s independence has never been a good idea. If the monetary policy starts serving the government goals – so explicitly – you end up like Turkey – roasted.
Anyway, the US 2-year yield eased further below the 4.30% yesterday, but the 10-year yield rose to 4.66% on worries that lower tax rates would increase deficit. Activity on Fed funds futures still show hesitation regarding the next rate in May meeting, with around 50-50 chance. But stock investors are optimistic. The S&P500 went straight up to close the session at a fresh all-time high, the small caps and Nasdaq 100 gained as well.
Chip stocks couldn’t fully benefit from yesterday’s rally as the Korean chipmaker SK Hynix cautioned that the 2025 memory demand outlook was uncertain due to inventory adjustments by PC and smartphone manufacturers, along with heightened trade protections and geopolitical risks. SK Hynix is down for the second session despite a 75% revenue growth in the October-December quarter compared with the same time last year, while its operating profit surged more than 2200% to above 8.08 trillion won, that’s more than $5.5bn (!) In the US, Nvidia recovered early losses and managed to eke out a 0.10% advance, while Broadcom eased 0.27% and AMD dropped 0.57%. The Dutch ASML suffered a decent selloff of more than 4% due to the worries of broader export curbs by the US. But the Stoxx 600 didn’t need ASML’s help to advance to a fresh ATH yesterday. The French CAC 40 extended gains for the 7th straight session, the DAX index advanced to a fresh high.
Could this last? Well, why not. The stock markets being at record highs is a usual thing – really – and prospects of lower rates and strong earnings are supportive of gains.
In the FX
The US dollar’s broad-based weakness lets major peers take a breather and recover. The EURUSD trades above its 50-DMA this morning and prepares to test the next technical resistance: 1.0460 – the minor 23.6% Fibonacci retracement on September to January selloff. Breaching this minor level won’t be a gamechanger, therefore the recovery could extend toward the 1.06 level, the major 38.2% retracement, before raising questions about the overall direction of the EURUSD. Fundamentally speaking, we start hearing incoming bets of a potential 50bp cut from the European Central Bank (ECB) rates by mid-year. As such, topsellers will sure be chasing interesting topselling opportunities as the pair climbs toward the 1.05/1.06 range.
Cable extends gains on the back of a broad-based dollar weakness too and should gain field until the 1.2650 Fibonacci mark without being caught by the fundamental radar. But the fundamentals are not shiny, shiny in the UK. The consumer confidence, there, dropped to a 14-month low and Sainsbury’s just announced to cut 3000 jobs to reduce expenses to deal with the upcoming tax hikes.
In Japan, the USDJPY is testing the 155 support - which also matches the 50-DMA - to the downside this morning, after the Bank of Japan (BoJ) delivered a widely expected 25bp hike. The BoJ’s determination in policy normalization should increase confidence among the yen bulls and lead to a gradual, and hopefully a sustainable appreciation of the yen. The pair could be expected to return toward the 150/153 range (including the 200-DMA and the major 38.2% Fibonacci retracement on the September to January rebound).
In energy, crude oil sank into its own medium-term bearish consolidation zone yesterday, in a selloff triggered by Donald Trump’s push for lower oil prices. The price of US crude consolidates below the 200-DMA this morning, and testing this level to the upside. A weekly close below the $75.20/75.40pb range – including the 200-DMA and the major 38.2% Fibonacci retracement on December to January rebound respectively - should give a stronger hand to oil bears from next week and pave the way for further losses, while regaining the major support levels could maintain hope for the recent rally to stay alive, but the risks are tilted to the downside.
In nat gas, the European nat gas prices – which have risen by more than 120% since last February – continue to push higher with strong support from the news flow. Italy, which has the EU’s second biggest storage sites after Germany, is worried about the falling underground storages – that are just around 58% full right now compared to 74% last year – and is willing to replenish them as early as next month, instead of waiting until April.
Europe Faces ‘Peak Pessimism’
In focus today
Today, we receive the January PMI index for both the euro area and the US. This index has recently significantly impacted financial markets especially in Europe as attention has shifted to growth amid continued lower inflation momentum. In the euro area, we anticipate a slight rise in the composite PMI to 50.0, with slow growth in the service sector and manufacturing gradually moving back up towards 50, indicating an ongoing but slower decline.
In Sweden, December PPI and Labour Force Survey are released.
Economic and market news
What happened overnight
In Japan, the Bank of Japan hiked its policy rate by 25bp to 0.50% in a long-anticipated move. The decision followed just a couple of hours after December CPI inflation (excluding fresh food) was released with a 0.3 percentage point increase to 3.0%, driven by a removal of government energy subsidies. The BoJ also adjusted its inflation forecast 0.5 percentage points higher to 2.4% in the fiscal year 2025 (starting in April). The move dragged USD/JPY about 0.5% lower to 155.
Next, investors will look at the press conference later this morning to get an idea of the BoJ's next move. We expect Ueda to signal a cautious stance, where further hikes will depend on the upcoming wage negotiations and global market sentiment. We think, the BoJ will find room for another two rate hikes this year once continued wage growth has been confirmed.
What happened yesterday
In the US, President Trump used his speech at the World Economic Forum to insist global companies should manufacture their products in the US or face significant tariffs. He also called on Saudi Arabia and OPEC to lower oil prices to help end the war in Ukraine. With oil prices lowered, Trump would push for interest rates around the world to drop immediately.
In the euro area, European Central Bank President Christine Lagarde stated that Europe's "existential crisis" outlook is not pessimistic, on the back of Europe's vulnerability to a new 'America First' dynamic in the US relationship.
In a slightly more positive light, consumer confidence rose to -14.2 (cons: -14.1) in January from -14.5 in December. The rise in January gives some relief to the growth outlook as the downward movement we saw in November and December stopped. Consumer confidence is important for the growth outlook as private consumption is expected to be the main driver of growth this year.
In Norway, Norges Bank kept rates unchanged this morning at 4.5% and firmly guided towards March as the most likely time for the first rate cut. The market reaction was close to non-existent amid very little news.
Equities: Global equities were higher yesterday, rising for the eighth consecutive day. Gains were fairly broad-based, with defensives performing as well as cyclicals, while tech underperformed. In Europe, the advances were driven by banks, continuing their strong run from last year as both macroeconomic factors and earnings continue to support the sector. In the US yesterday, the Dow was up by 0.9%, the S&P 500 by 0.5%, the Nasdaq by 0.2%, and the Russell 2000 by 0.5%. Most Asian markets are higher this morning, led by China, in what appears to be a bit of trade war relief as the worst-case scenario seems less likely with the latest comments from Trump. Japanese equities are flat following the rate hike from the Bank of Japan, a strong yen, and higher yields across the curve. European futures are in the green this morning, while US futures are marginally lower.
FI: Global rates sold off from the long end yesterday, led yet-again by the US treasury market, in a steepening move. 10y UST rose 3bp to 4.64%. It was a day without significant news as markets await the euro PMIs out this morning, and the important central bank meetings week next week, where we have both the ECB and the Fed meeting
FX: USD lost some ground against the most of G10 yesterday, while GBP, AUD and NZD were top performers, as US President Trump spoke in Davos, but in the big picture his speech did not move the market. NOK was about unchanged following the Norges Bank's decision to keep interest rates unchanged.
USD/JPY Increase on Hold: Here’s Why The Pair Could Struggle
Key Highlights
- USD/JPY started a fresh increase above the 155.80 resistance.
- It cleared a connecting bearish trend line with resistance at 156.35 on the 4-hour chart.
- EUR/USD started a consolidation phase below the 1.0465 resistance.
- GBP/USD could face hurdles near the 1.2400 and 1.2420 levels.
USD/JPY Technical Analysis
The US Dollar found support at 154.80 against the Japanese Yen. USD/JPY surpassed 155.50 and 155.80 to enter a positive zone.
Looking at the 4-hour chart, the pair was able to clear the 38.2% Fib retracement level of the downward move from the 158.87 swing high to the 154.77 low. It cleared the 200 simple moving average (green, 4-hour) and traded close to the 100 simple moving average (red, 4-hour).
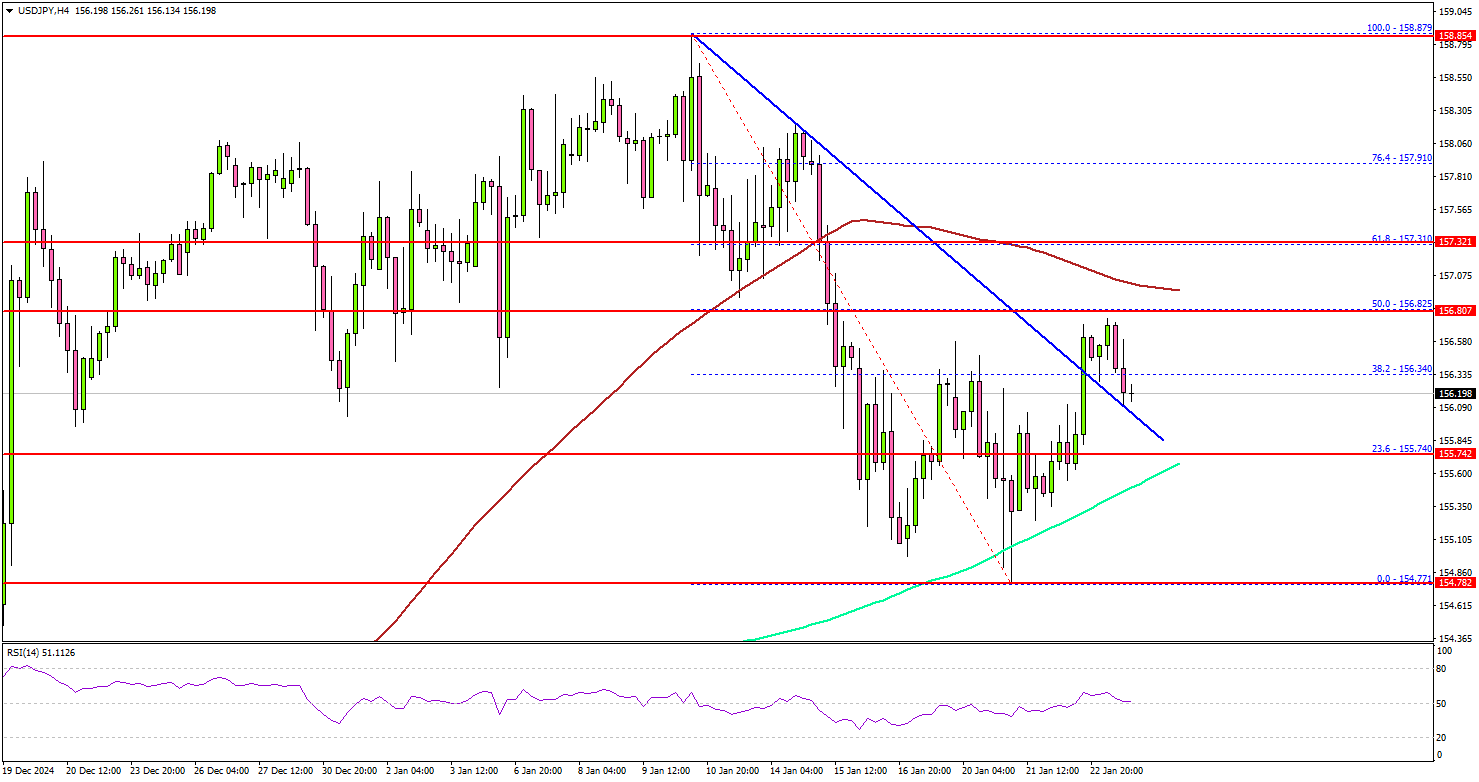
On the upside, the pair seems to be facing hurdles near the 156.80 level. It is close to the 50% Fib retracement level of the downward move from the 158.87 swing high to the 154.77 low.
The next major resistance is near the 157.30 level. A close above the 157.30 level could set the tone for another increase. In the stated case, the pair could even clear the 158.00 resistance.
On the downside, immediate support sits near the 155.80 level. The next key support sits near the 155.50 level. Any more losses could send the pair toward the 155.00 level.
Looking at GBP/USD, the pair started a short-term recovery wave but the bears might remain active near the 1.2400 resistance.
Upcoming Economic Events:
- Euro Zone Manufacturing PMI for Jan 2025 (Preliminary) – Forecast 45.3, versus 45.1 previous.
- Euro Zone Services PMI for Jan 2025 (Preliminary) – Forecast 51.6, versus 51.6 previous.
- US Manufacturing PMI for Jan 2025 (Preliminary) – Forecast 49.6, versus 49.4 previous.
- US Services PMI for Jan 2025 (Preliminary) – Forecast 56.5, versus 56.8 previous.
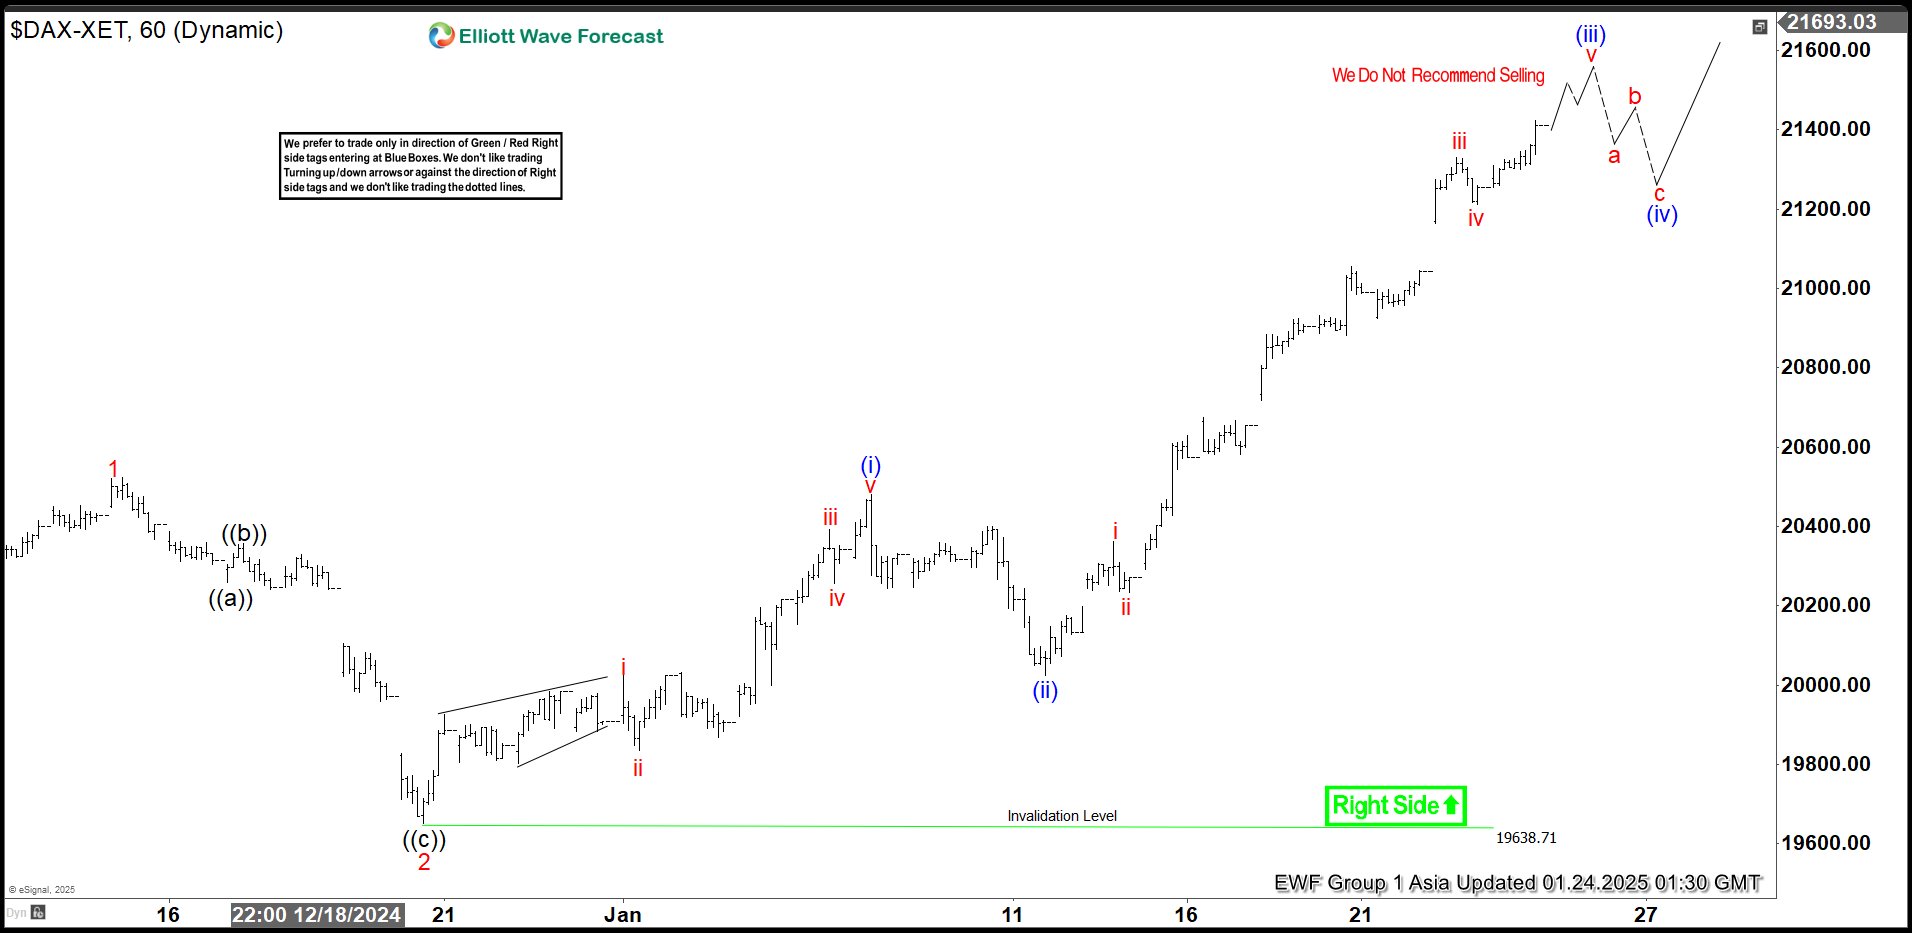
Elliott Wave View on DAX Nesting Higher in Impulsive Structure
Short Term Elliott Wave View in DAX shows that the Index breaks to new all-time high confirming the right side remains bullish. The rally from 11.19.2024 low looks to be nesting in an impulsive structure. Up from 11.19.2024 low, wave 1 ended at 20522.82 and pullback in wave 2 ended at 19649.87. The Index resumed higher from there in wave 3 in a nest.
Up from wave 2, wave i ended at 20024.79 and wave ii pullback ended at 19833.82. The Index resumed higher in wave iii which ended at 20391.17. Pullback in wave iv ended at 20255.85. The final leg wave v ended at 20480.49 which also completed wave (i) in higher degree. Index then pullback in wave (ii) which ended at 20025.28. Index has resumed higher again. Up from wave (ii), wave i ended at 20362.59 and pullback in wave ii ended at 20234.26. Wave iii higher ended at 21330.87 and pullback in wave iv ended at 21212.25. Expect wave v to end soon and this should complete wave (iii) in higher degree. Afterwards, pullback in wave (iv) should find support in 3, 7, or 11 swing for further upside.
DAX 60 Minutes Elliott Wave Chart
DAX Elliott Wave Video
https://www.youtube.com/watch?v=Ck_1vh-w78w
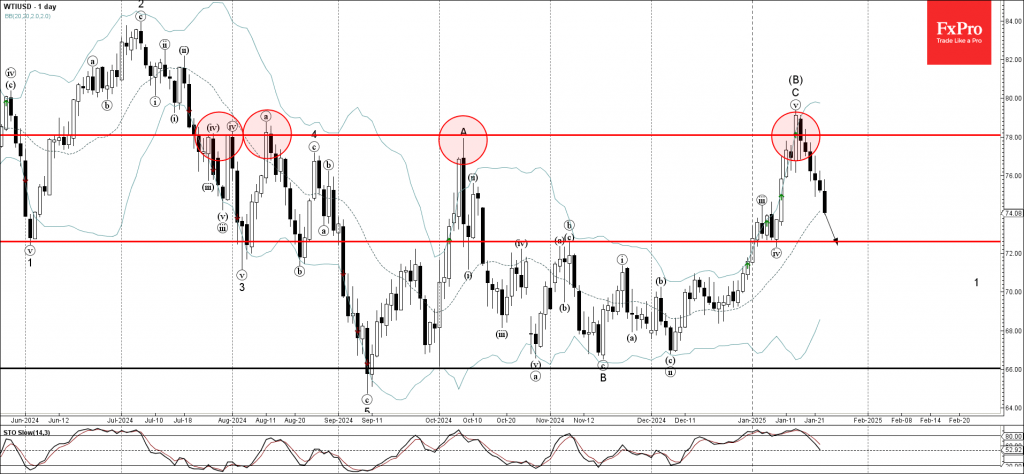
WTI crude oil Wave Analysis
- WTI crude oil reversed from resistance level 78.00
- Likely to fall to support level 72.60
WTI crude oil recently reversed down from the major resistance level 78.00 (has been repeatedly reversing the price from July, as can be seen from the daily WTI chart below)
The downward reversal from the resistance level 78.00 started the active intermediate impulse wave (3).
WTI crude oil can be expected to fall toward the next support level 72.60 (low of the previous short-term correction iv from the start of this month).
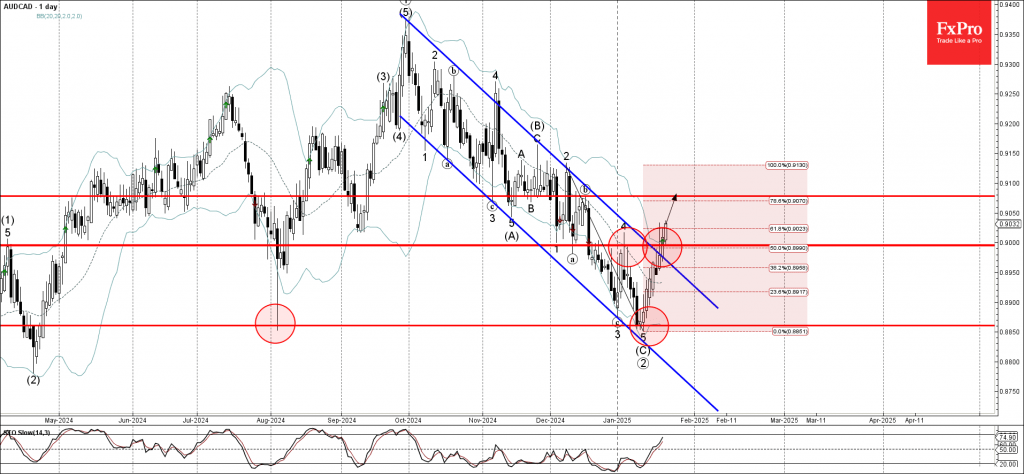
AUDCAD Wave Analysis
- AUDCAD broke round resistance level 0.9000
- Likely to rise to resistance level 0.9080
AUDCAD currency pair recently broke the round resistance level 0.9000 (which stopped the previous wave 4 at the start of January)
The breakout of the resistance level 0.9000 coincided with the breakout of the 50% Fibonacci correction of the previous downward impulse from December and the daily down channel from September – which accelerated the active impulse wave 1.
AUDCAD currency pair can be expected to rise toward the next resistance level 0.9080 (top of wave b from the middle of December).