Sample Category Title
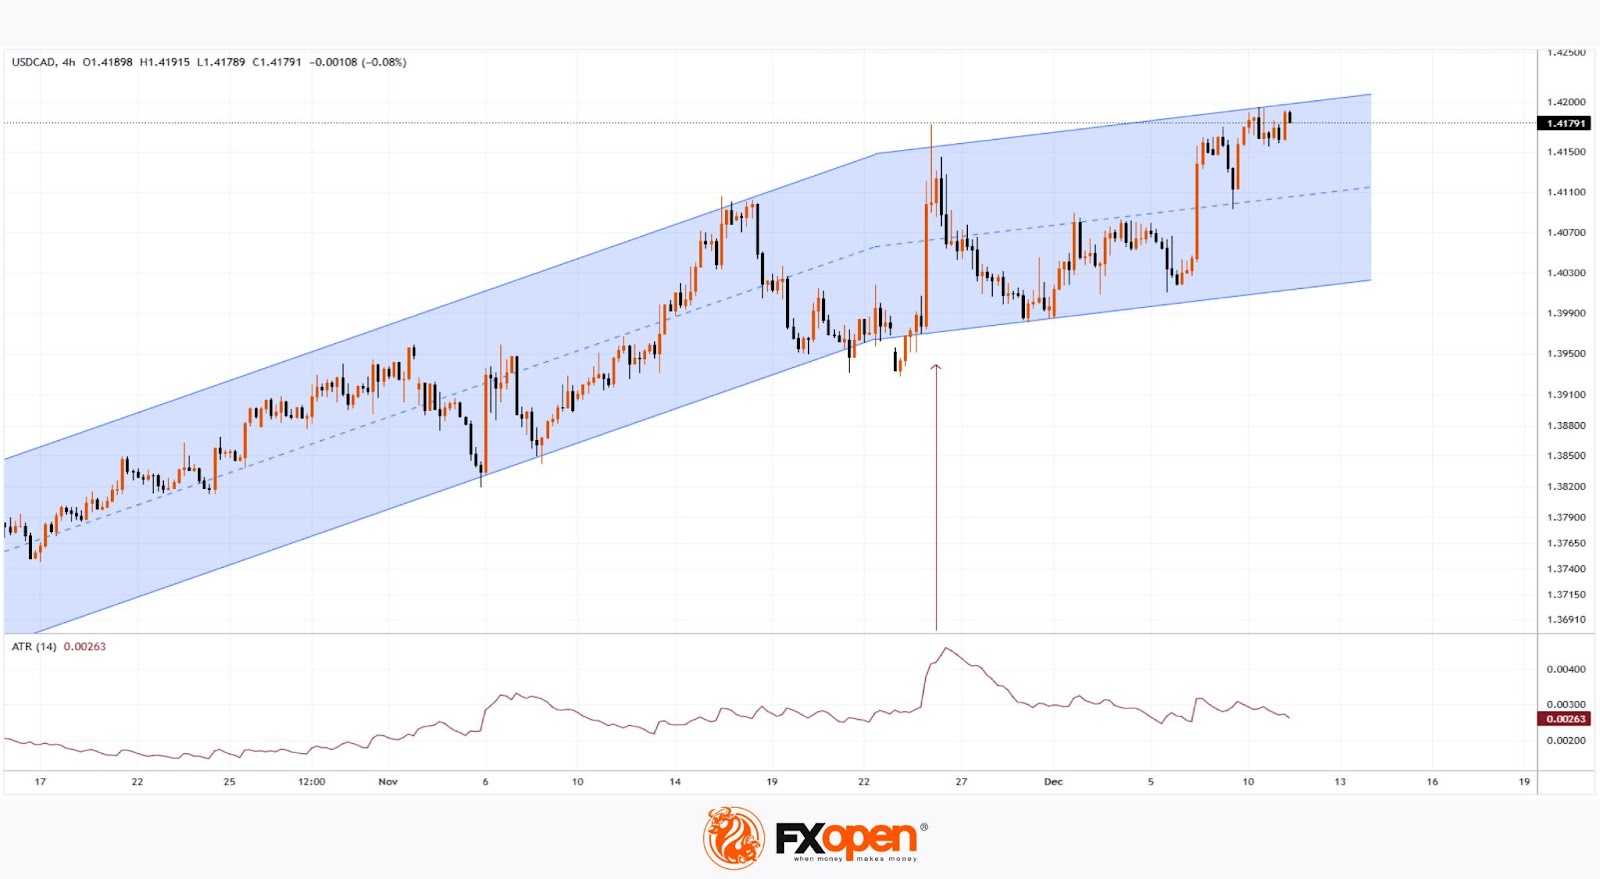
USD/CAD at a 56-Month High
As evidenced by the USD/CAD chart, yesterday the rate climbed above 1.4190 – a level not seen since April 2023, when the world was gripped by panic over the spread of the coronavirus.
Today, the weakness of the Canadian dollar relative to the USD is being influenced by a rich fundamental backdrop. As reported by the media:
→ Formerly elected President Donald Trump has previously stated that he would impose a 25% tariff on all goods from Mexico and Canada as soon as he takes office on 20 January, joking that Canada should become the 51st state. Yesterday, Trump posted on social media that he looks forward to meeting with Canadian Prime Minister Trudeau again to "continue our in-depth discussions on tariffs and trade."
→ At 17:45 GMT+3 today, the Bank of Canada will announce its decision. It is expected to cut its interest rate by 50 basis points to 3.25% and likely signal that further rate cuts are possible in light of the sharp rise in unemployment levels.
→ At 16:30 GMT+3 today, the Consumer Price Index (CPI) data will be released. It is expected that US inflation will remain unchanged.
As a result, heightened volatility is highly likely today, which could significantly affect the nature of the current upward trend.
Note that on 25–26 November, a spike in volatility was observed on the USD/CAD chart, visible through the ATR indicator, which caused the channel's slope to become less steep. Today’s batch of news carries the highest significance: traders should prepare for both the scenario of a new 56-month high being reached and an attempt by bears to reverse the trend.
Trade over 50 forex markets 24 hours a day with FXOpen. Take advantage of low commissions, deep liquidity, and spreads from 0.0 pips. Open your FXOpen account now or learn more about trading forex with FXOpen.
This article represents the opinion of the Companies operating under the FXOpen brand only. It is not to be construed as an offer, solicitation, or recommendation with respect to products and services provided by the Companies operating under the FXOpen brand, nor is it to be considered financial advice.
Between $95K and $100K, Bitcoin Changes Long-Term Holders
Market Picture
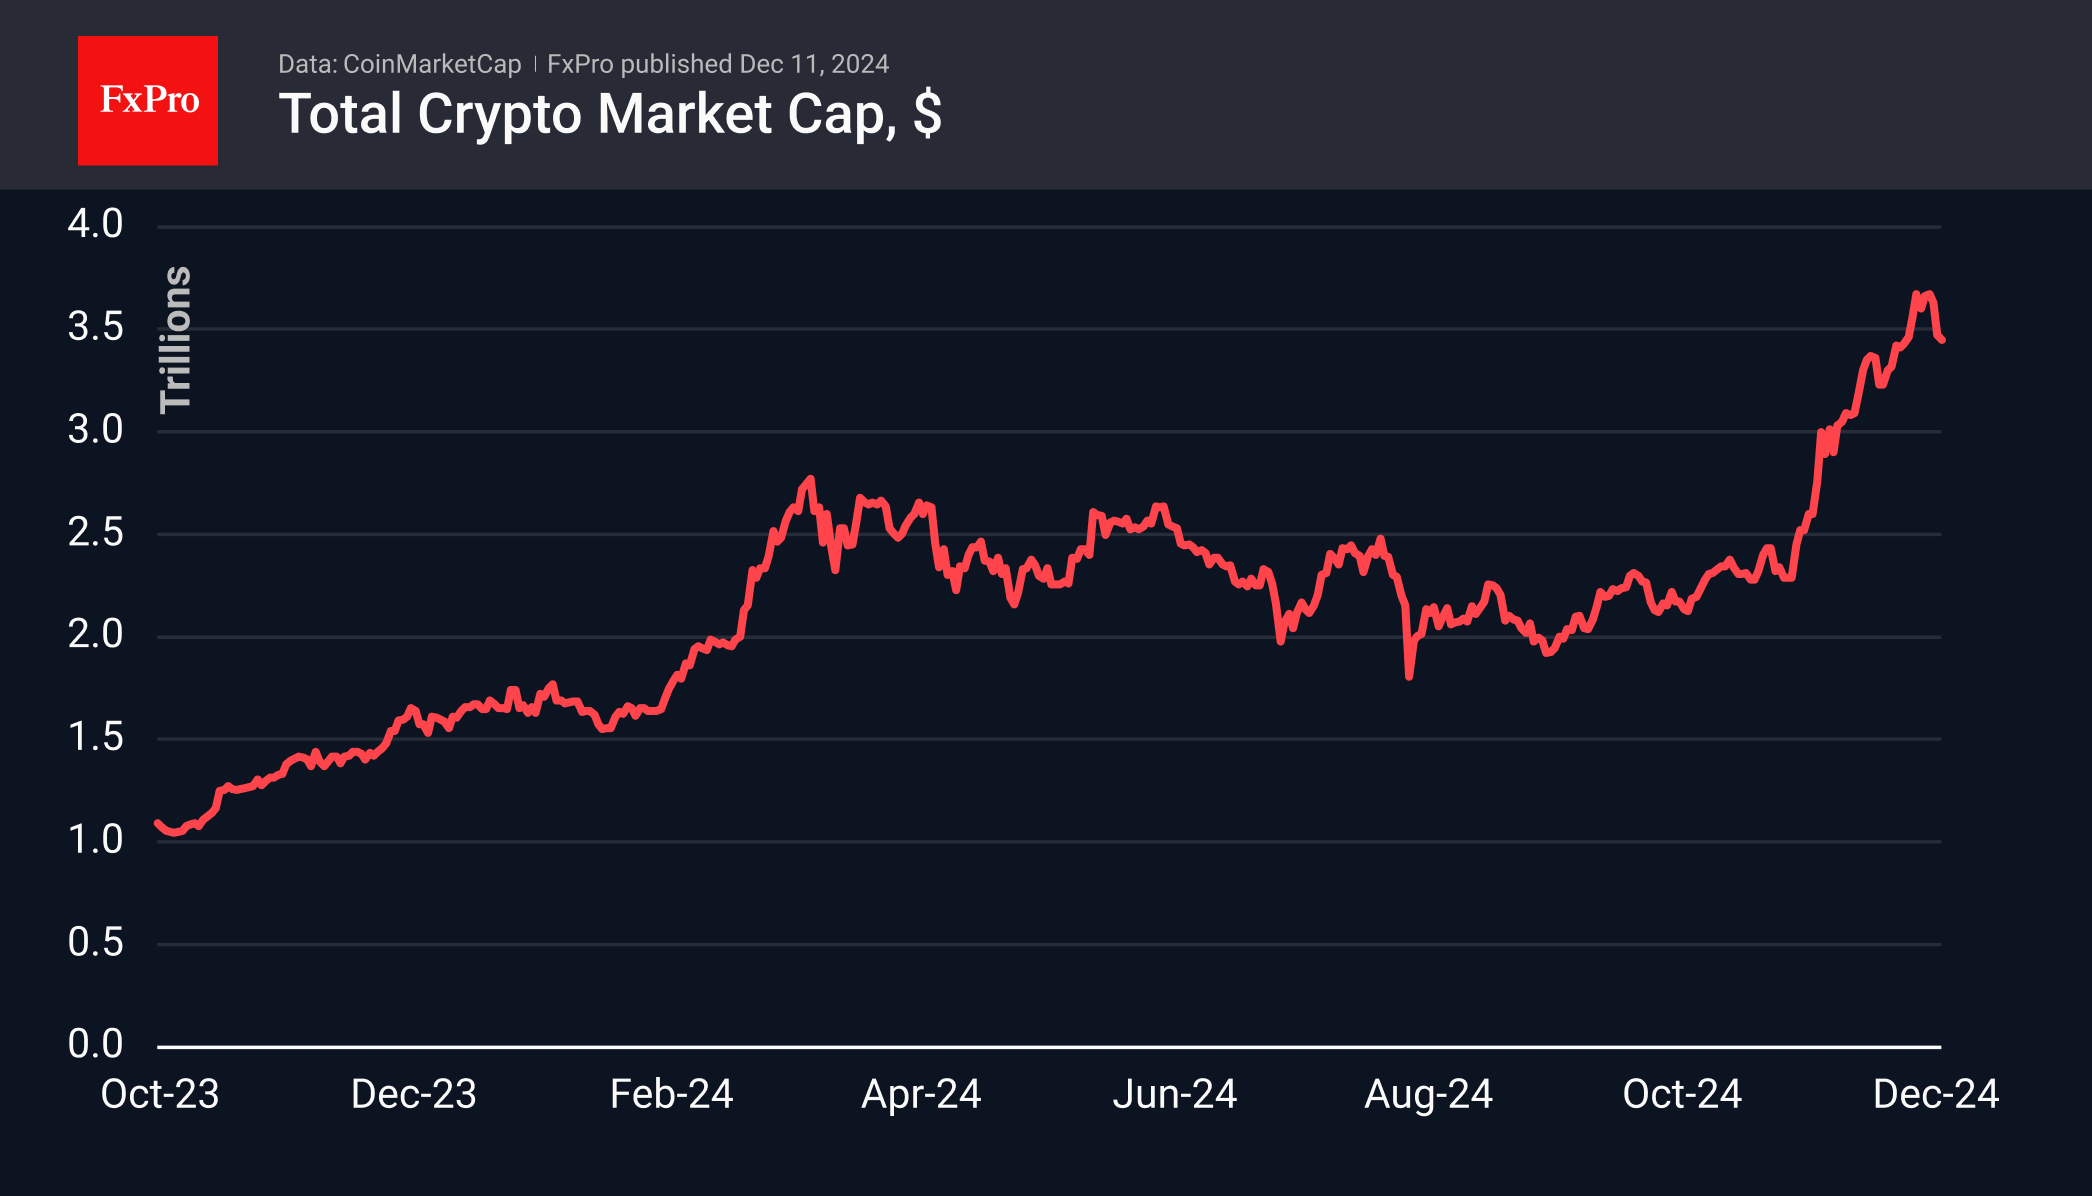
The cryptocurrency market remained roughly the same as the day before at $3.45 trillion, down 7% from its peak levels at the start of the week. The sentiment index rolled back to 74, in ‘greed’ territory. The altcoin season index has pulled back to 63 from a peak of 87 a week earlier. This is a typical story where Bitcoin’s inability to grow soon translates into pressure on altcoins.
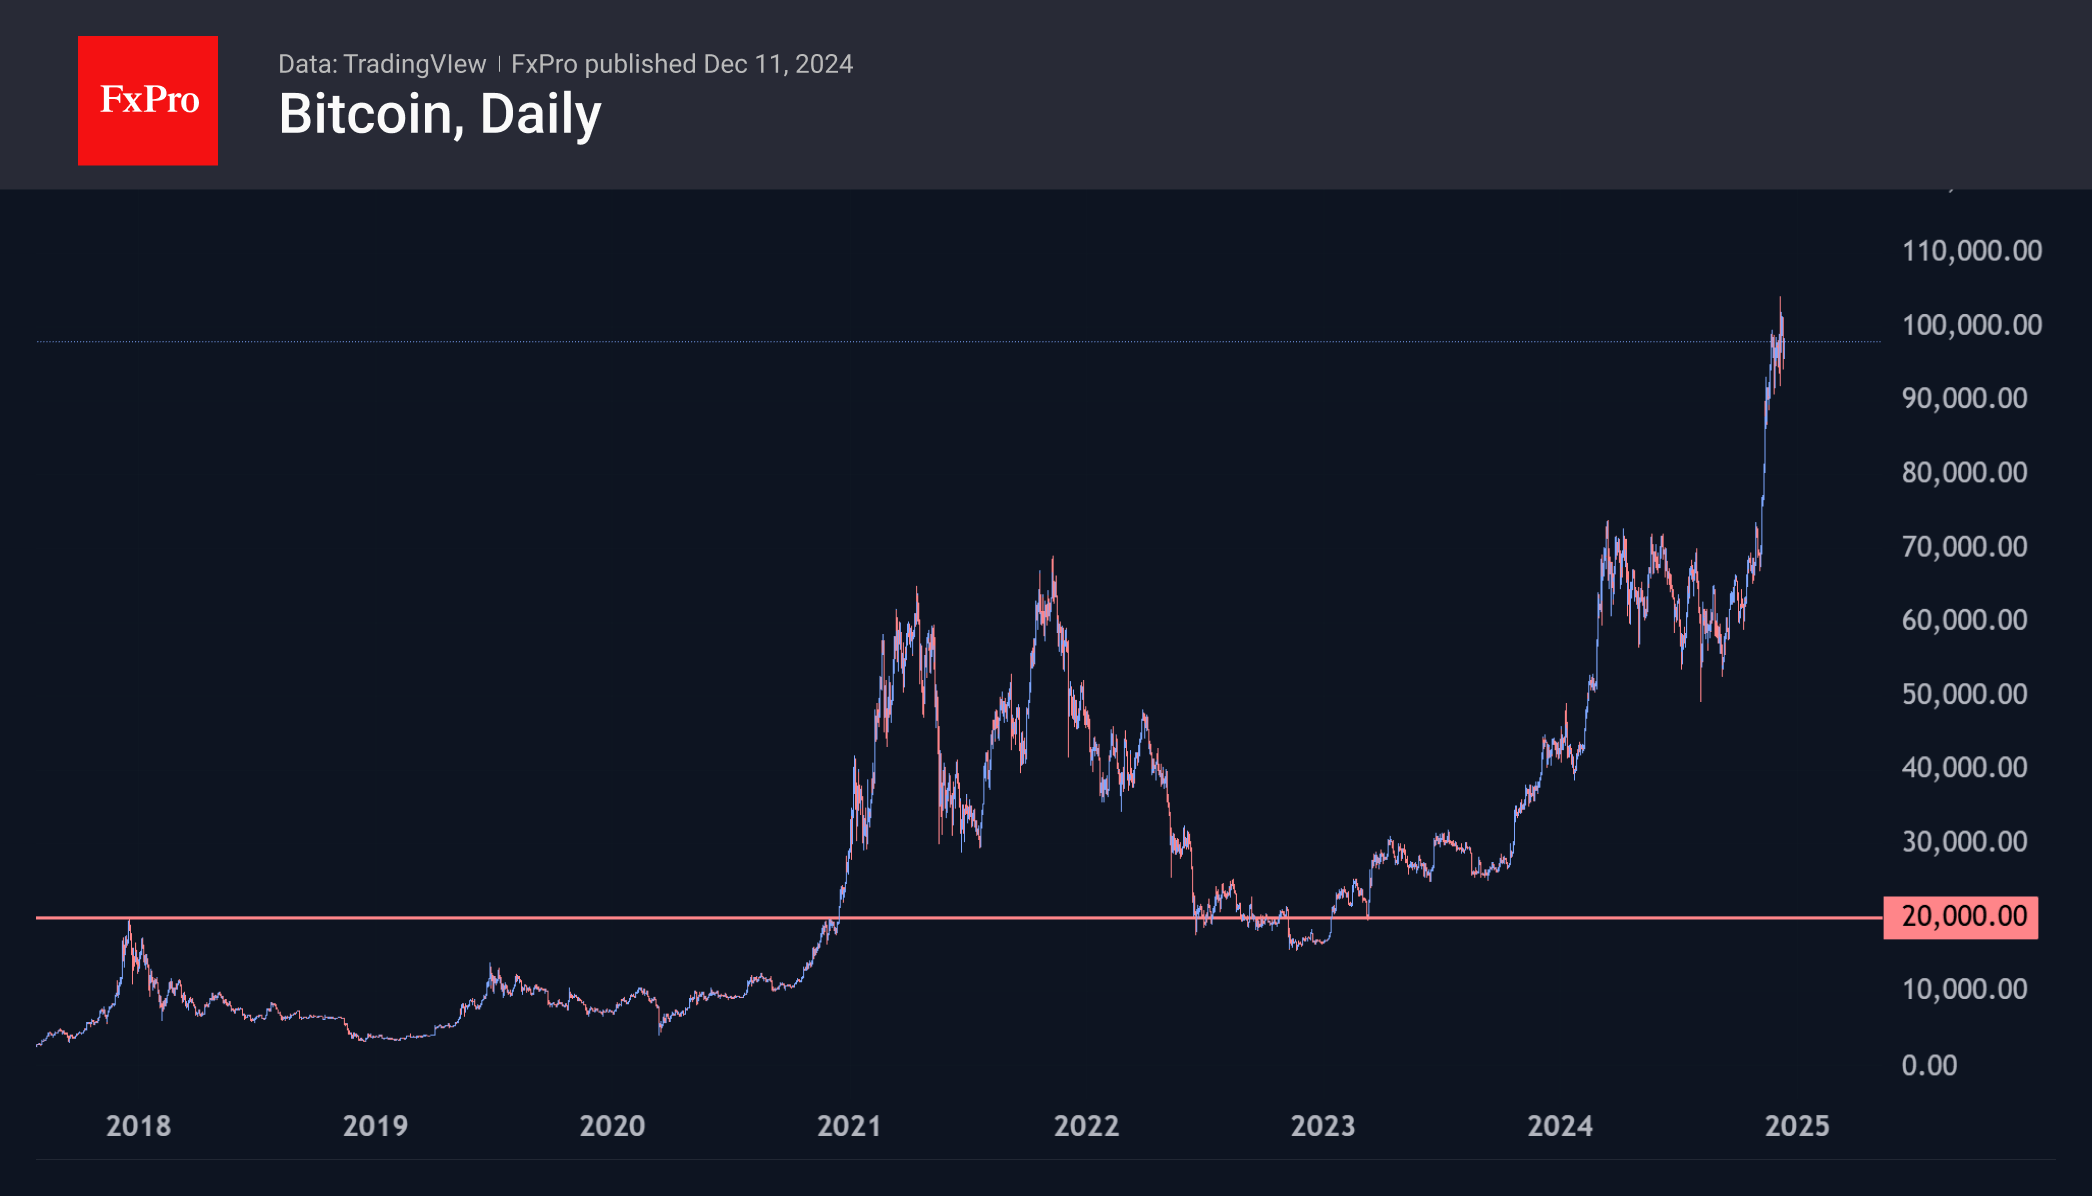
There is a meaningful change of ownership for Bitcoin in the $95-100k range. Bitcoin experienced another wave of selling in the US session on Tuesday, just as it did the day before. Once again, buyers retook the initiative when the price dipped under $95k, and at the time of writing, the price has recovered to $98k. The meaningful round level has prompted long-term private holders to sell. At the same time, there is a growing appetite for corporations to buy on their balance sheets. Then, there is the key to how governments holding impressive amounts of confiscated Bitcoins will behave.
For now, we believe Bitcoin is meeting psychological resistance like 2020, when it hesitated to cross $20K at year-end but eventually broke through, doubling in price shortly after. In this cycle, we see upside potential to $120-140K in the next couple of months before the next major shakeout.
News Background
CryptoQuant notes that on 5 December, when the price was at an all-time high, significant transfers from holders could have caused a sharp drop to $90,500.
Stablecoin market capitalisation has surpassed $200 billion, adding 3% in the last seven days. Coinbase attributed the dynamics to a sharp rise in on-chain lending rates.
Mining company MARA Holdings used the proceeds from the bond sale to buy 11,774 BTC for ~$1.1bn at an average price of around $96K per coin. The firm has 40,435 BTC worth $3.9bn in reserves.
Another mining company, Riot Platforms, plans to float $500 million in convertible bonds, using the funds to buy more bitcoins and for general corporate purposes.
EUR/USD Daily Outlook
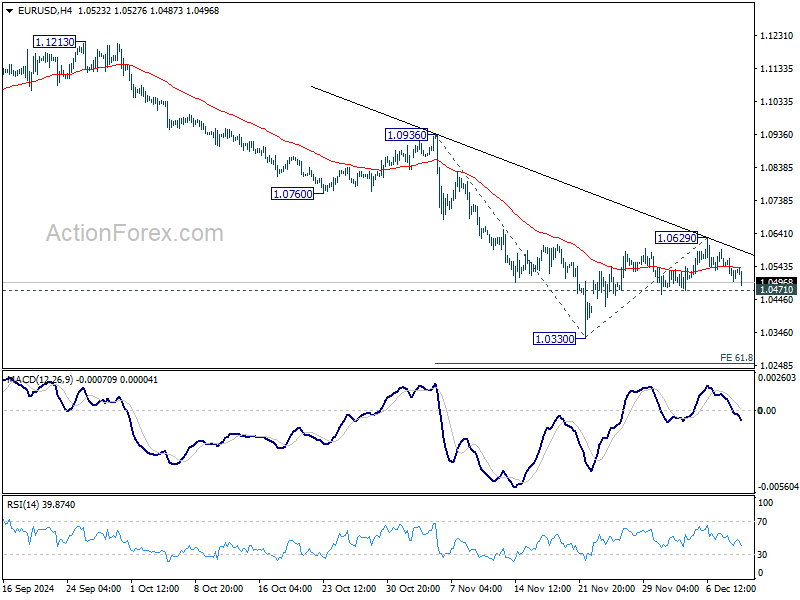
Daily Pivots: (S1) 1.0495; (P) 1.0531; (R1) 1.0565; More...
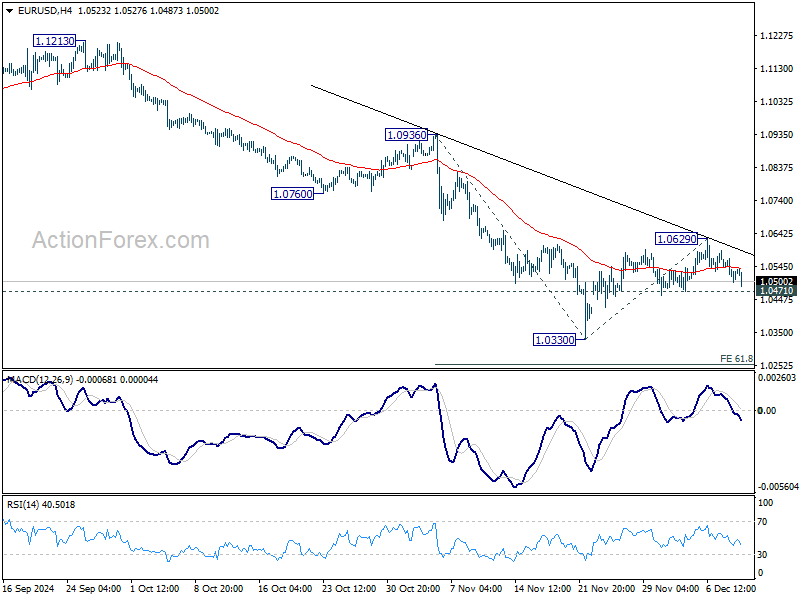
Intraday bias in EUR/USD remains neutral for the moment. On the downside, break of 1.0471 support will suggest that corrective recovery from 1.0330 has completed, and fall from 1.1213 is ready to resume. Intraday bias will be back on the downside for 1.0330 first, and then 61.8% projection of 1.0936 to 1.0330 from 1.0629 at 1.0254. Also, in this case, sustained trading below 1.0404 key fibonacci level will carry larger bearish implication.
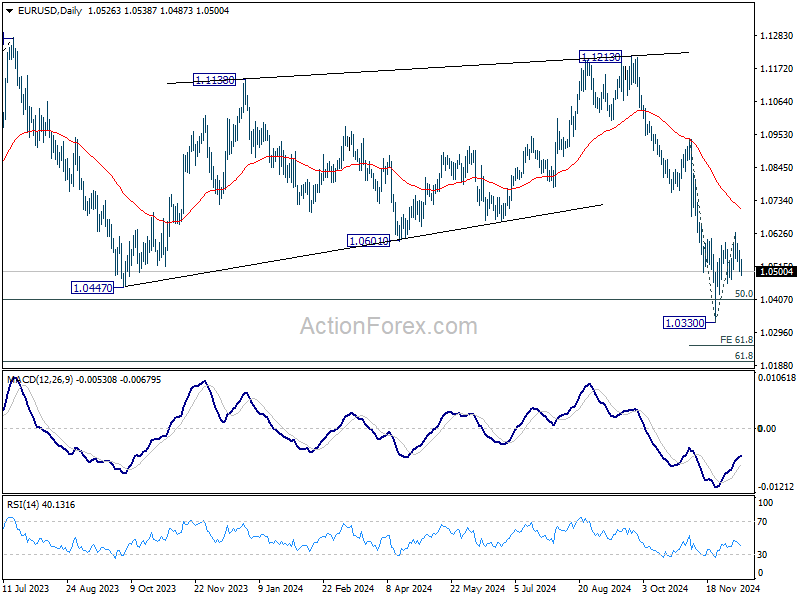
In the bigger picture, focus stays on 50% retracement of 0.9534 (2022 low) to 1.1274 at 1.0404. Strong rebound from this level will keep price actions from 1.1273 (2023 high) as a medium term consolidation pattern only. However, sustained break of 1.0404 will raise the chance that whole up trend from 0.9534 has reversed. That would pave the way to 61.8% retracement at 1.0199 first. Firm break there will target 0.9534 low again.
USD/JPY Daily Outlook
Daily Pivots: (S1) 151.18; (P) 151.69; (R1) 152.47; More...
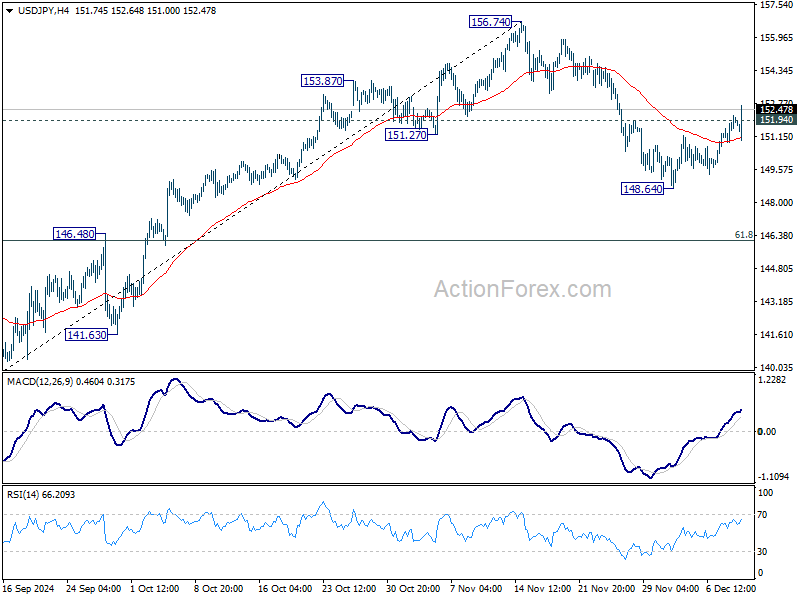
USD/JPY's break of 151.94 resistance suggests that pull back from 156.74 has completed as a correction at 148.64. That is, rise from 139.57 hasn't completed yet. Intraday bias is back on the upside for retesting 156.74 first. Firm break there will target 161.94 high next. For now, this will be the favored case as long as 148.64 support holds.
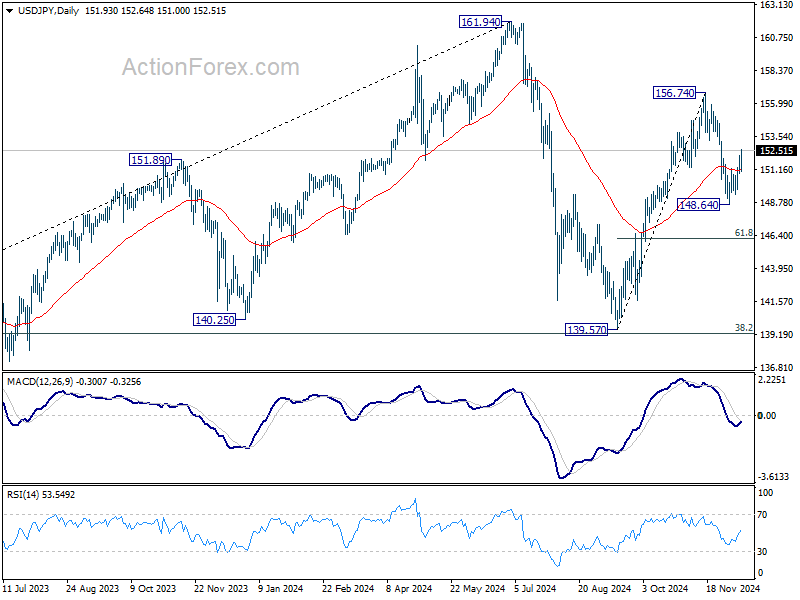
In the bigger picture, price actions from 161.94 are seen as a corrective pattern to rise from 102.58 (2021 low). The range of medium term consolidation should be set between 38.2% retracement of 102.58 to 161.94 at 139.26 and 161.94. Nevertheless, sustained break of 139.26 would open up deeper medium term decline to 61.8% retracement at 125.25.
GBP/USD Daily Outlook
Daily Pivots: (S1) 1.2737; (P) 1.2758; (R1) 1.2791; More...
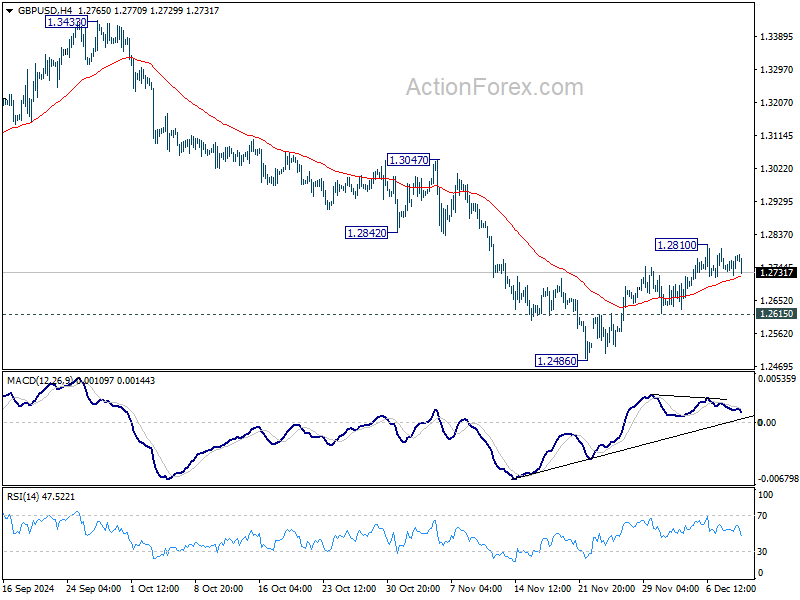
Intraday bias in GBP/USD remains neutral as range trading continues. Rebound from 1.2486 short term bottom could still extend higher. But outlook will stay bearish as long as 55 D EMA (now at 1.2840) holds. On the downside, below 1.2615 minor support will bring retest of 1.2486 first. Firm break there will target 1.2298 cluster support zone. However, sustained break of 55 D EMA will argue that the near term trend has reversed, and targets 1.3047 resistance for confirmation.
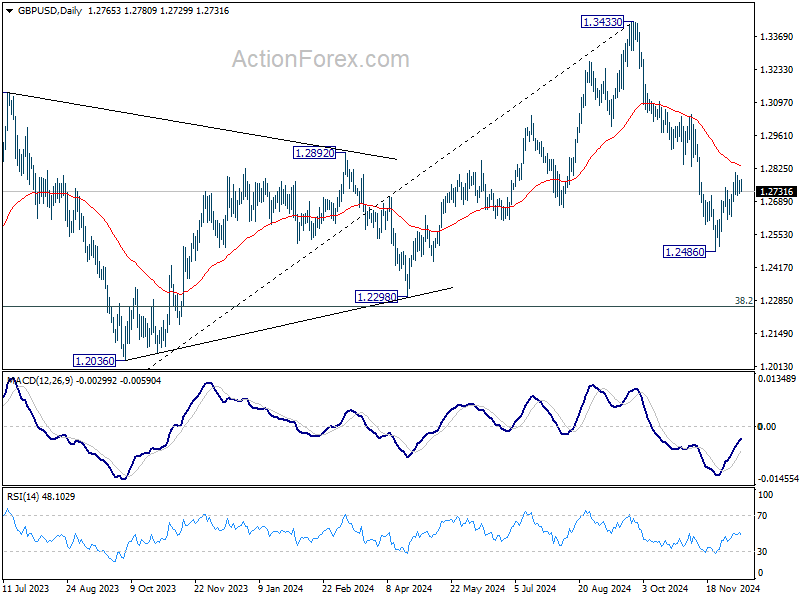
In the bigger picture, price actions from 1.3433 medium term are seen as correcting whole up trend from 1.0351 (2022 low). Deeper decline could be seen to 38.2% retracement of 1.0351 to 1.3433 at 1.2256, which is close to 1.2298 structural support. But strong support is expected there to bring rebound to extend the corrective pattern.
USD/CHF Daily Outlook
Daily Pivots: (S1) 0.8787; (P) 0.8810; (R1) 0.8853; More…
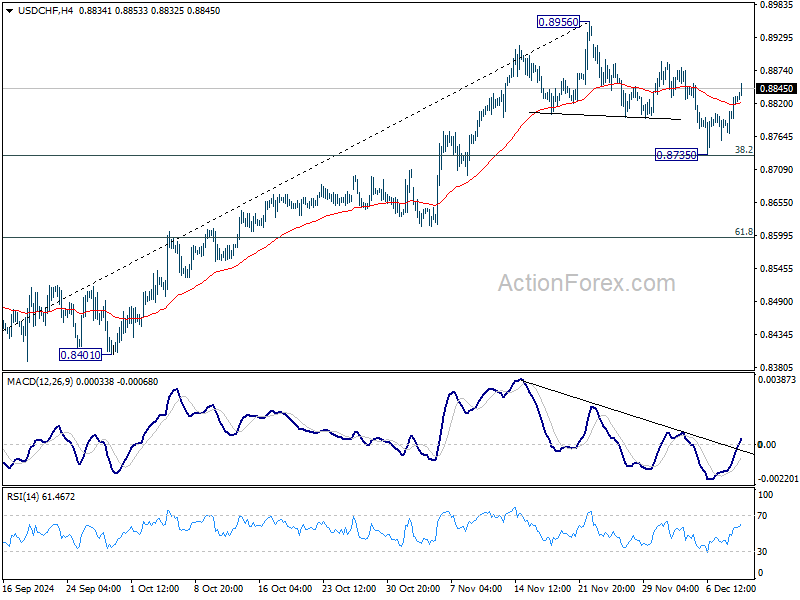
USD/CHF's rebound from 0.8735 continues today and intraday bias stays on the upside. As noted before, corrective fall from 0.8956 could have completed at 0.8735 after hitting 55 D EMA. Further rally is in expected to retest 0.8956 high first. Firm break there will resume the whole rise from 0.8374. This will remains the favored case as long as 0.8735 support holds, in case of retreat.
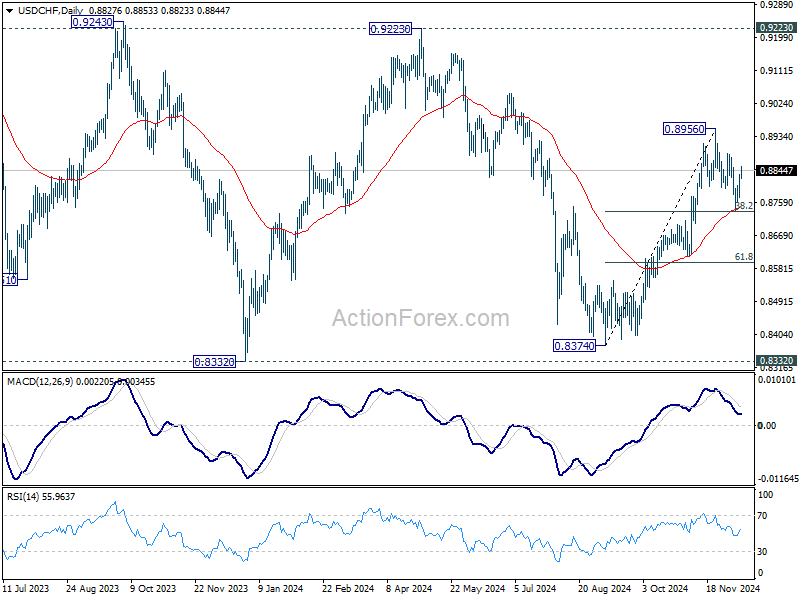
In the bigger picture, price actions from 0.8332 (2023 low) are currently seen as a medium term corrective pattern, with rise from 0.8374 as the third leg. Overall outlook will continue to stay bearish as long as 0.9223 resistance holds. Break of 0.8332 low is in favor at a later stage when the consolidation completes.
USD/CAD Daily Outlook
Daily Pivots: (S1) 1.4160; (P) 1.4178; (R1) 1.4199; More...
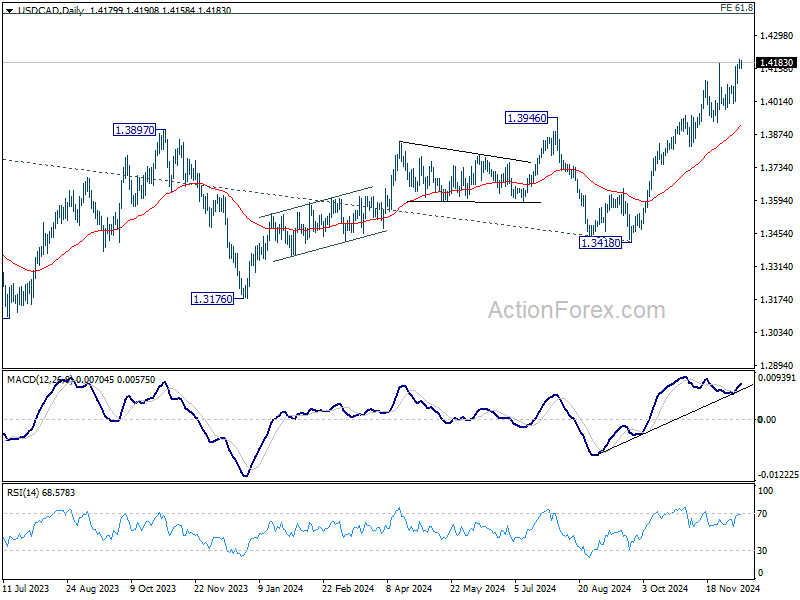
Intraday bias in USD/CAD remains on the upside for the moment. Current rally is part of the larger up trend and should target 1.4391 projection level. On the downside, below 1.4092 minor support will delay the bullish case, and bring more consolidations first, before staging another rise.
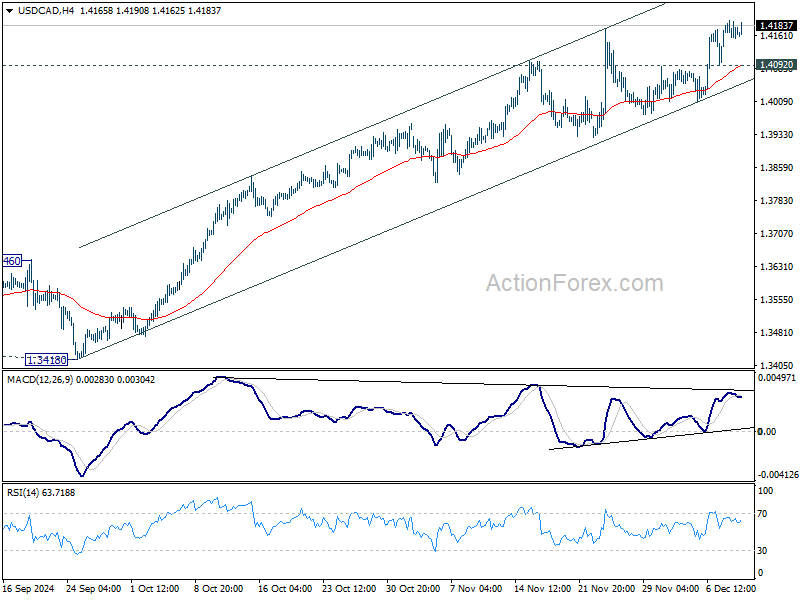
In the bigger picture, up trend from 1.2005 (2021) is in progress. Next target is 61.8% projection of 1.2401 to 1.3976 from 1.3418 at 1.4391. Now, medium term outlook will remain bullish as long as 1.3418 support holds, even in case of deep pullback.
RBA’s Hause: Australia more seriously affected by global trade war because of China reliance
RBA Deputy Governor Andrew Hauser addressed the implications of US President-elect Donald Trump’s proposed tariffs at an event today. He highlighted that while higher global tariffs could depress activity across supply chains, the full extent of the effects would depend on various factors, including currency adjustments and fiscal responses in affected economies.
“Given this uncertainty, it is important that we don’t prejudge the implications of tariffs for policy but monitor developments closely and stand ready to respond appropriately as the facts emerge,” Hauser stated.
Hauser pointed out Australia’s unique vulnerability due to its trade exposure, with over 80% of its iron ore exports destined for China, which accounts for three-quarters of global iron ore imports.
This heavy reliance on China increases the risk of significant disruptions if Beijing becomes the target of punitive tariffs or if global trade realigns along geopolitical lines.
“This seems to suggest that Australia could find itself more seriously affected by a global trade war than some of the average exposure data suggest,” Hauser noted.
Aussie Slumps on Yuan Depreciation Speculation; US CPI and BoC Loom
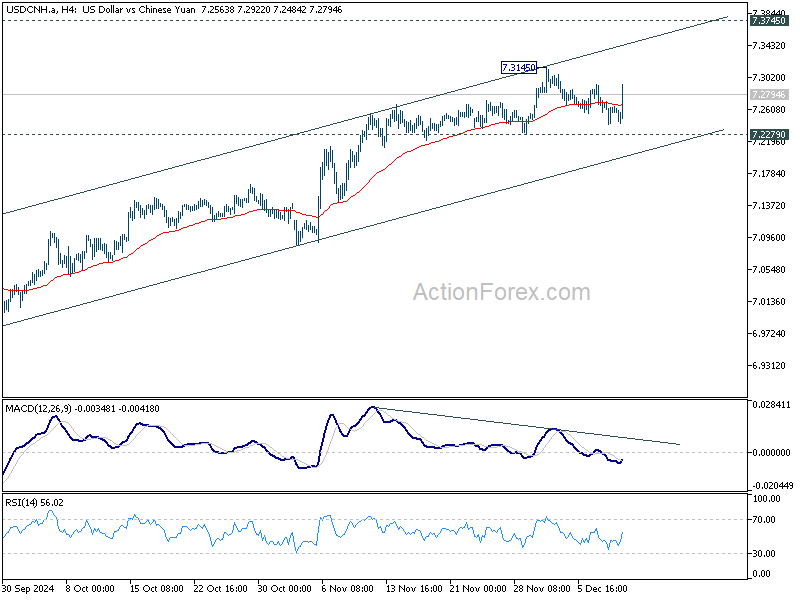
Australian Dollar continued its decline today as speculation mounted that China might allow Yuan to weaken in 2025 to counteract the economic impact of increased US trade tariffs under the incoming Trump administration. While no official announcement has been made, Beijing appears to ready to signal greater reliance on market-driven currency valuation. Also, according to a Reuters report, Chinese officials might tolerate depreciation of Yuan from its current level of 7.3 against Dollar to 7.5 if trade tensions intensify.
Technically, USD/CNH also bounces on the news but stays below 7.3145 short term top. Nevertheless, further rally is expected as long as 7.2279 support holds. Rise from 6.9709 is expected to continue. Break of 7.3145 will pave the way to 7.3745 key resistance (2022 high). The next rally is USD/CNH could give extra drag on AUD/USD.
Overall for the week so far, however, Yen is currently the worst performer, followed by Kiwi, and then Euro. Sterling is the best, followed by Dollar, and then Canadian. Swiss Franc and Aussie are mixed in the middle. The markets are now looking into today's US CPI and BoC rate decision for the next big moves.
BoC to flash rates by 50bps again in quick path to neutral
BoC is widely anticipated to lower its overnight rate by another 50bps at today’s meeting, reducing the policy rate to 3.25%. This follows a similar move in October, aimed at addressing a cooling economy where inflation has been at or below 2% for three months already, and core measures remain slightly above target. Last week’s data showing unemployment rate jumping to 6.8% from 6.5% solidified expectations of a significant rate reduction.
A recent Reuters poll highlighted this expectation, with 21 of 27 respondents predicting a 50bps cut and the remainder forecasting a more modest 25bps reduction. The primary argument for aggressive easing centers on the need to return interest rates to a neutral range, estimated between 2.25% and 3.25%. Following today's expected cut, rates would align with the upper bound of neutral, still potentially exerting a mildly restrictive effect on the economy.
However, there is an opposing view that recent resilience in consumer spending, inflation, and labor market data could justify a slower pace of easing. This argument suggests that BoC could take a more measured approach, affording time to assess the economy’s response to October’s 50bps cut before making further moves.
Regardless, the debate now shifts to determining the eventual terminal rate, with clarity likely, hopefully, to emerge only in January's Monetary Policy Report.
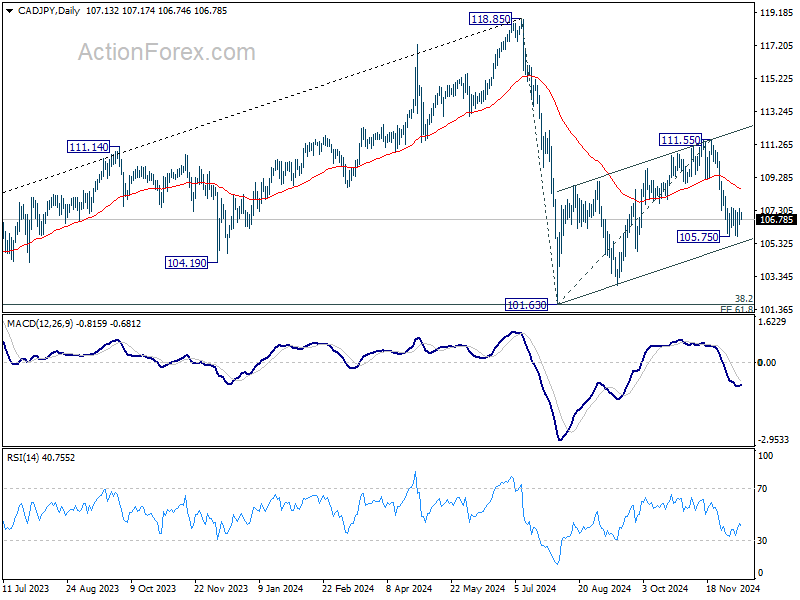
Technically, similar to other Yen crosses, CAD/JPY's corrective rebound from 101.63 should have completed with three waves up to 111.55. Further decline is expected as long as 55 D EMA (now at 108.65) holds. Break of last week's low at 105.75 will resume the fall from 111.55 towards 101.63 low, and possibly through it to resume the larger decline from 118.85. However, the speed of the decline could more hinge on the development in Yen than Loonie.
US CPI sets to drive EUR/USD for downside breakout
The spotlight today is firmly on the release of US CPI data for November. Expectations are for headline inflation to tick up from 2.6% to 2.7%, continuing its rebound from the September low of 2.4%. Meanwhile, core CPI is forecast to hold steady at 3.3%, staying in the 3.2%-3.2% range it has maintained since June.
Unless today’s data deviates significantly from expectations, it is unlikely to deter Fed from delivering a widely anticipated 25bps rate cut next week, bringing the federal funds rate to 4.25-4.50%. Fed fund futures currently reflect an 86% probability of this move.
But more critically, today’s readings could solidify the case for a pause in January, supported by futures pricing nearly 80% probability of such an outcome.
A pause would allow policymakers to digest the inflationary implications of upcoming fiscal and trade policies under President-elect Donald Trump. Current Treasury Secretary Janet Yellen cautioned that Trump’s tariffs pose a dual risk of "derail the progress" on inflation and have "adverse consequences on growth", creating a potential headache for Fed as it balances these challenges.
Technically, EUR/USD would be a key to watch in reaction to US CPI. Recovery from 1.0330 short term bottom is seen as a corrective move, might could have completed at 1.0629 already. Break of 1.0471 support will suggest that fall from 1.1213 is ready to resume through 1.0330. Next target will be 61.8% projection of 1.0936 to 1.0330 from 1.0629 at 1.0254.
AUD/USD Daily Report
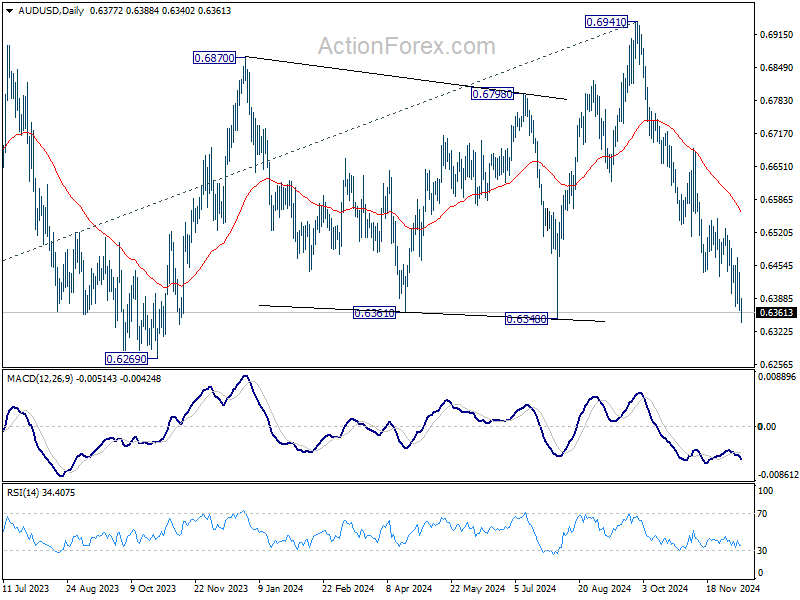
Daily Pivots: (S1) 0.6347; (P) 0.6395; (R1) 0.6426; More...
AUD/USD's break of 0.6371 temporary low indicates resumption of whole fall from 0.6941. Intraday bias is back on the downside for 0.6348 support, and then 0.6269. On the upside, above 0.6470 resistance will turn intraday bias neutral first. But outlook will stay bearish as long as 55 D EMA (now at 0.6559) holds, in case of recovery.
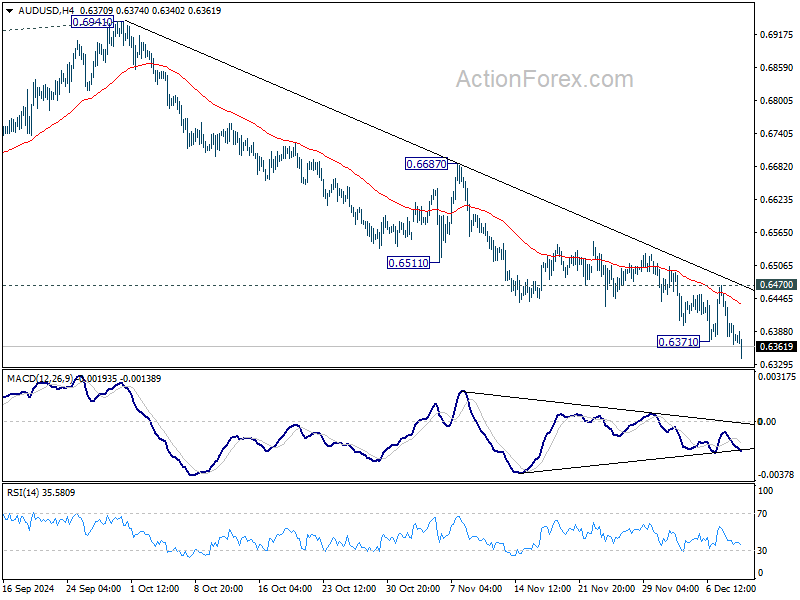
In the bigger picture, price actions from 0.6169 (2022 low) are seen as a medium term consolidation to the down trend from 0.8006. More sideway trading could be seen above 0.6169, but overall outlook will stay bearish as long as 0.6941 resistance holds. Firm break of 0.6169 will resume the down trend to 61.8% projection of 0.8006 to 0.6169 from 0.6941 at 0.5806 next.
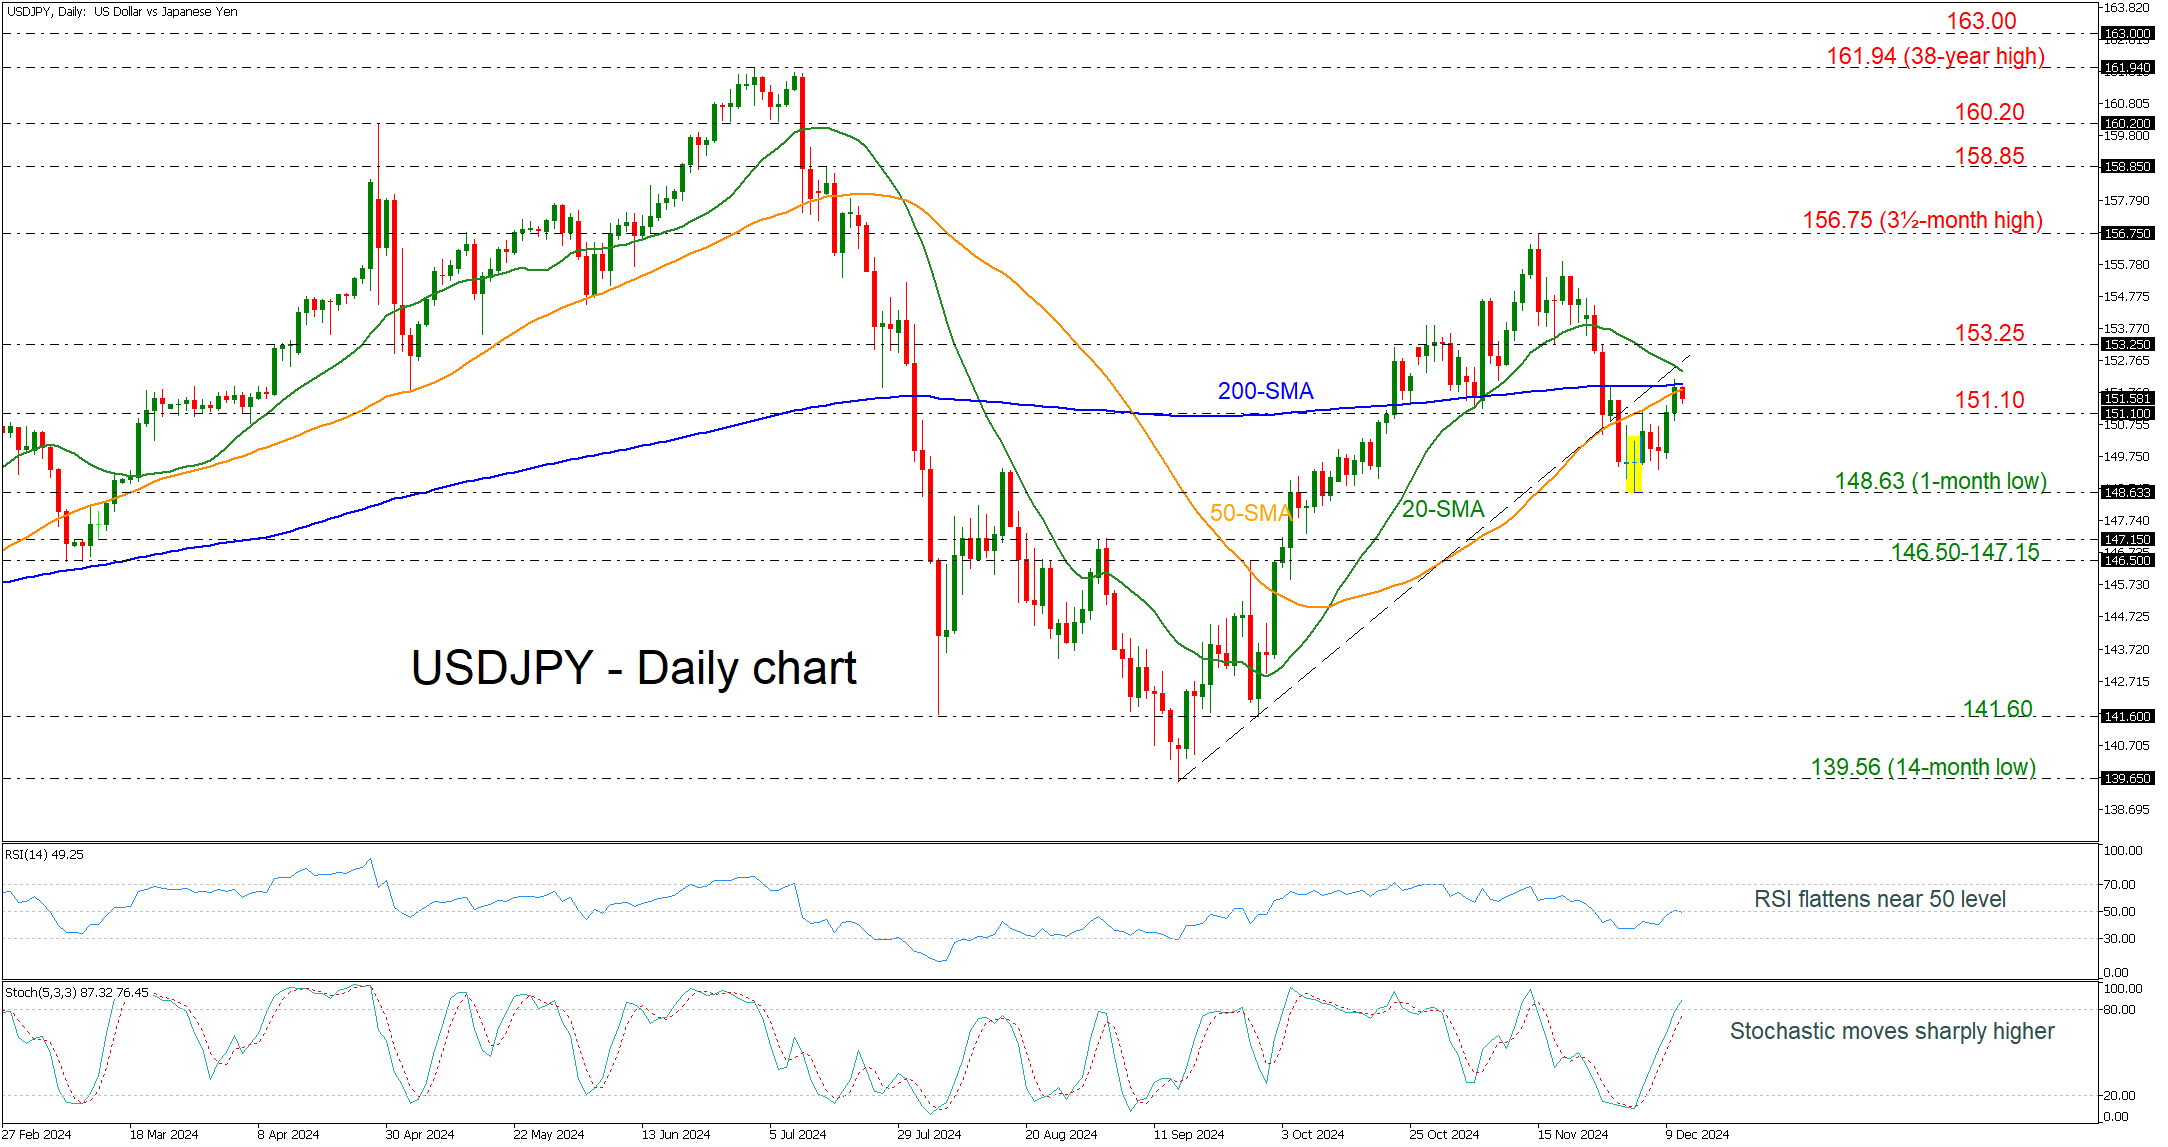
USDJPY Battles With 200-Day SMA Near 152.00
- USDJPY remains below short-term uptrend line
- Bullish doji candle proved true
- Stochastic rallies occur in overbought area; RSI flattens
USDJPY is fighting with the significant 200-day simple moving average (SMA) around 152.00, trying to extend its bullish move that started after the bullish doji candle on December 3.
Momentum indicators are pointing to a neutral-to-positive bias in the short term, with the RSI just near the 50 level and the stochastic oscillator rising in overbought territory.
If prices continue to head higher, resistance should come from the 20-day SMA near the 152.40 mark. A move higher could reach 153.25, the inside swing low, and open the way to the three-and-a-half-month high of 156.75, which would reinforce the short-term bullish view.
However, should a downside reversal take form again, immediate support would likely come from the 151.10 ahead of the one-month trough at 148.63 A break lower could send traders towards the 146.50-147.15 region.
All in all, USDJPY is still standing beneath key levels such as the short-term uptrend line and the 200-day SMA. The pair needs some more boosts from the market to continue the upside tendency.