Sample Category Title
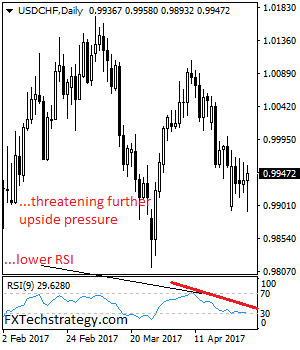
USD/CHF Daily Outlook
Daily Pivots: (S1) 0.9908; (P) 0.9932; (R1) 0.9972; More.....
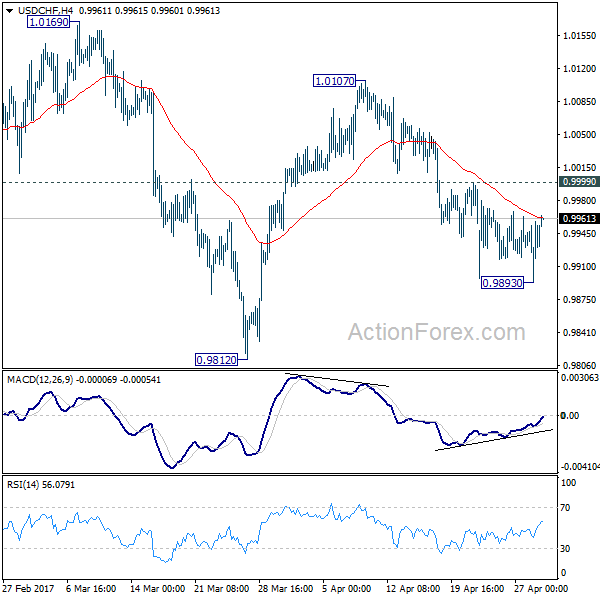
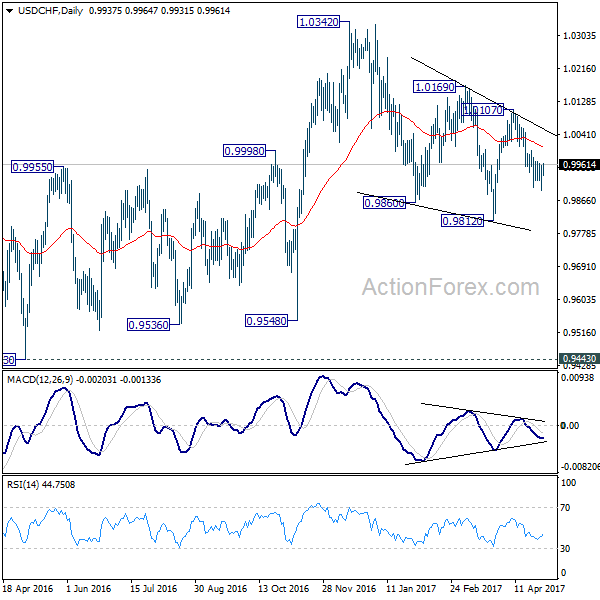
Intraday bias in USD/CHF remains neutral for the moment. With 0.9999 minor resistance intact, deeper decline is mildly in favor. Below 0.9893 will target 0.9812 and below to extend the correction from 1.0342. But break of 0.9812 should be brief and we will look for bottoming signal below there. On the upside, above 0.9999 minor resistance argues that fall from 1.0107 is finished, with bullish convergence condition in 4 hour MACD. In that case, intraday bias will be flipped back to the upside for 1.0107 resistance first.
In the bigger picture, we're still maintaining that firm break of 1.0342 key resistance is needed to confirm underlying bullish momentum in the pair. However, the corrective nature of the fall from 1.0342 is starting to give the medium term outlook a bullish favor. Hence, in stead of looking for topping signal around 1.0342, we'd now pay closer attention to upside acceleration as USD/CHF approaches this level again.
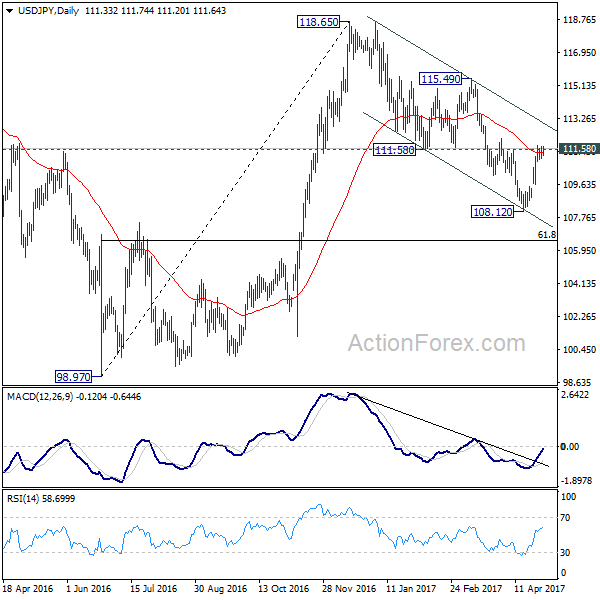
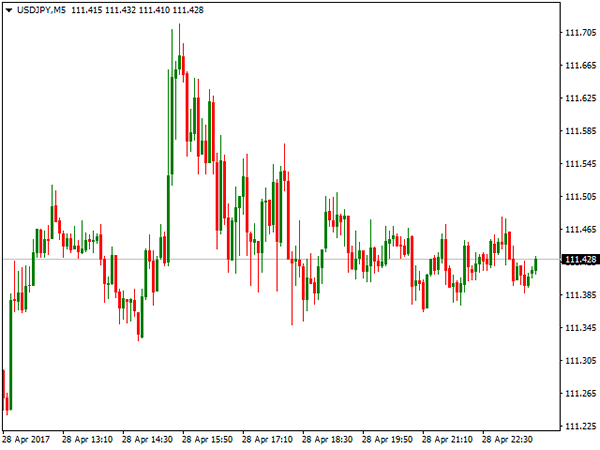
USD/JPY Daily Outlook
Daily Pivots: (S1) 111.13; (P) 111.42; (R1) 111.79; More....
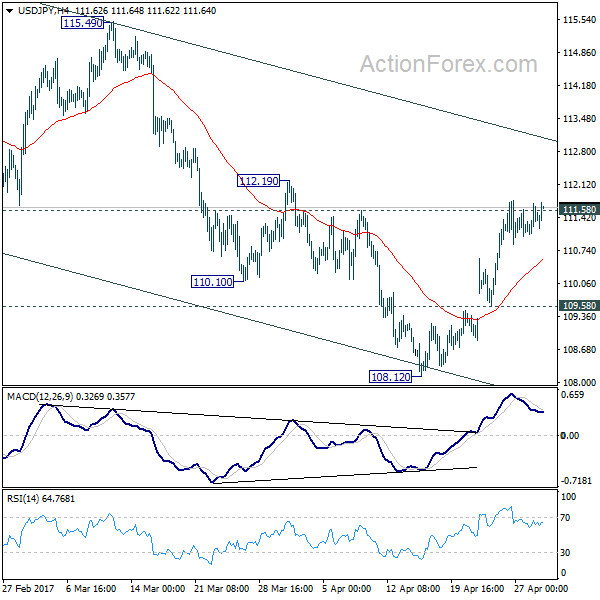
Intraday bias in USD/JPY remains neutral with focus on 111.58 support turned resistance. We're favoring the case that corrective fall from 118.65 has completed with three waves down to 108.12. Sustained break of 111.58 will confirm this bullish view and target 115.49 resistance and above. However, break of 109.58 will argue that fall from 118.65 is still in progress and will turn bias to the downside for 108.12 and below.
In the bigger picture, price actions from 125.85 high are seen as a corrective pattern. It's uncertain whether it's completed yet. But in case of another fall, downside should be contained by 61.8% retracement of 75.56 to 125.85 at 94.77 to bring rebound. Meanwhile, break of 115.49 resistance will extend the rise from 98.97 to retest 125.85. Overall, rise from 75.56 is still expected to resume later after the correction from 125.85 completes.
Dollar Mildly Higher as Congress Reached a Tentative Deal to Avert Government Shutdown
Dollar trades mildly higher in Asian session today. Trading is subdued with China, Swiss, France, Germany, Italy and UK on holiday. The greenback is lifted mildly by news that the US Congress has reached a tentative agreement on a USD 1T bill to keep the government running through the end of September. A vote could be held as early as Tuesday to confirm. And this would prevent a government shut down. But the real tests for the greenback would be from economic data and FOMC meeting. Fed is widely expected to keep policies unchanged this week. But at this point, Fed fund futures are pricing in over 60% of a June hike. Markets would be eager to get some hints for that in this week's FOMC statement. Meanwhile, ISM indices and non-farm payroll would shed some lights on how the US economy would rebound after a weak Q1.
EU showed unity on Brexit negotiation approach
EU leaders approved, over the weekend, the guidelines for Brexit negotiation. European Council President Donald Tusk described the guidelines as "firm but fair". And he emphasized an orderly Brexit would eventually followed by a "balanced, ambitious and wide-ranging" agreement on trade. The unanimous agreement on the guidelines showed unity among EU leaders on the approach. And that is, the exit deal should be completed before trade negotiations. It's reported that UK will be required to "respect the obligation resulting from the whole period" of the membership and pay the agreed seven-year budget that concludes in 2020. The sum is estimated to be between EUR 40b and EUR 60b.
UK PM May: Strong leadership needed in Brexit negotiation.
UK Prime Minister Theresa May responded that there is no Brexit deal on the table yet. And, she said that "we have their negotiating guidelines, we have our negotiating guidelines through the Article 50 letter and the Lancaster House speech I gave on this issue in January." May emphasized that "what matters sitting around that table is a strong Prime Minister of the United Kingdom, with a strong mandate from the people of the United Kingdom which will strengthen our negotiating hand to ensure we get that possible deal."
The European Commission will come up with a more detailed proposal for governments to approve on May 22. Formal negotiation will start after election in UK on June 8.
RBA watched tomorrow
RBA rate decision will be another focus this week. The central bank is widely expected to keep the cash rate unchanged at 1.50%. Rate has been staying at this record low since last August. Also, RBA would likely continue to adopt a neutral stance even though inflation has returned to target band of 2-3% in Q1. Meanwhile, one of the keys to shape the policy path this year would be the government budget to be unveiled on May 9.
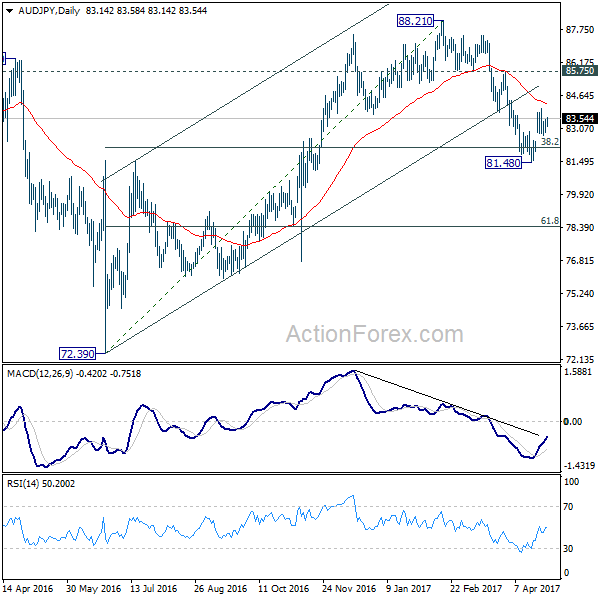
Aussie has been the more resilient commodity currencies last month, comparing to Canadian and New Zealand Dollar. AUD/JPY 's strong rebound from 81.48 suggests that the corrective pull back from 88.21 has completed already. And, 38.2% retracement of 72.39 to 88.21 at 82.17 was defended after brief trading below. Further rise would now be seen to 55 day EMA (now at 84.25). Sustained break there should then pave the way for a retest on 88.21 high.
China PMIs point to slowing growth
Released yesterday, the official China PMI manufacturing dropped to 51.2 in April, down from 51.8, and below expectation of 51.7. PMI non-manufacturing dropped to 54.0, down from 55.1. The data suggests that growth in China would slow after the unexpected pickup in first quarter. In particular, the employment component dipped into contraction region at 49.2 while output also dropped 0.4 pt to 53.8. There are also expectations that the government's policy would turn into a more cautious approach ahead. Nonetheless, the economy in China will likely remain robust.
For today...
Swiss will release retail sales in European session. US will release personal income and spending, PCE, ISM manufacturing and construction spending later in the day.
USD/JPY Daily Outlook
Daily Pivots: (S1) 111.13; (P) 111.42; (R1) 111.79; More....
Intraday bias in USD/JPY remains neutral with focus on 111.58 support turned resistance. We're favoring the case that corrective fall from 118.65 has completed with three waves down to 108.12. Sustained break of 111.58 will confirm this bullish view and target 115.49 resistance and above. However, break of 109.58 will argue that fall from 118.65 is still in progress and will turn bias to the downside for 108.12 and below.
In the bigger picture, price actions from 125.85 high are seen as a corrective pattern. It's uncertain whether it's completed yet. But in case of another fall, downside should be contained by 61.8% retracement of 75.56 to 125.85 at 94.77 to bring rebound. Meanwhile, break of 115.49 resistance will extend the rise from 98.97 to retest 125.85. Overall, rise from 75.56 is still expected to resume later after the correction from 125.85 completes.
Economic Indicators Update
| GMT | Ccy | Events | Actual | Forecast | Previous | Revised |
|---|---|---|---|---|---|---|
| 0:30 | JPY | Manufacturing PMI Apr F | 52.7 | 52.8 | 52.8 | |
| 1:00 | AUD | TD Securities Inflation M/M Apr | 0.50% | 0.10% | ||
| 7:15 | CHF | Retail Sales (Real) Y/Y Mar | 0.50% | 0.60% | ||
| 12:30 | USD | Personal Income Mar | 0.30% | 0.40% | ||
| 12:30 | USD | Personal Spending Mar | 0.20% | 0.10% | ||
| 12:30 | USD | PCE Deflator M/M Mar | 0.10% | |||
| 12:30 | USD | PCE Deflator Y/Y Mar | 2.10% | |||
| 12:30 | USD | PCE Core M/M Mar | -0.10% | 0.20% | ||
| 12:30 | USD | PCE Core Y/Y Mar | 1.80% | |||
| 14:00 | USD | ISM Manufacturing Apr | 56.7 | 57.2 | ||
| 14:00 | USD | ISM Prices Paid Apr | 66.5 | 70.5 | ||
| 14:00 | USD | Construction Spending M/M Mar | 0.40% | 0.80% |
Foreign Exchange Market Commentary: EUR/USD, USD/JPY, GBP/USD, GOLD, WTI CRUDE, DJIA, FTSE100, DAX
EUR/USD
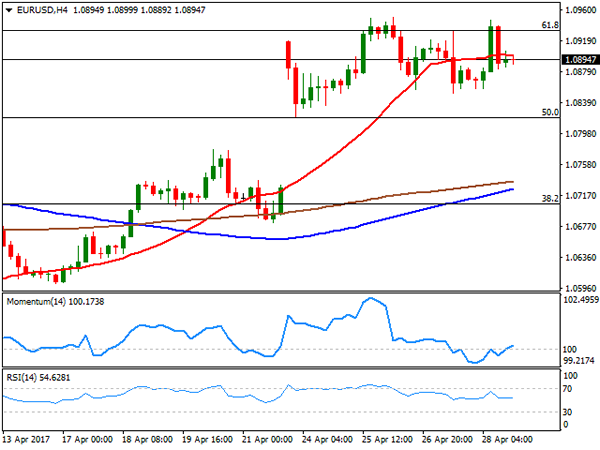
The American dollar closed the week mixed, only up against commodity-related currencies and with the EUR/USD pair having set a fresh 2017 high of 1.0950, amid diminishing political concerns in the region, after the first round of French elections. The pair pulled back on Friday, probably due to profit taking at the last day of the month, but the macroeconomic ground favors a continuation rally of the common currency, given that, while US data remain soft, with the economy growing just 0.7% in the three months to March, European inflation surprised to the upside, up to over three-year highs. Core annual inflation jumped to 1.2%, while the headline reading came in at 1.9%. The figures bring back to the table the possibility of tapering in the EU, despite the latest ECB's statement indicated that tapering has not been discussed this month, as the bank sees inflation still subdued.
Trading during the first half of the week will likely be choppy, with Japan on its Golden Week and Europe on holiday on Monday due to Labor day in most of the world. Additionally, the US Fed's meeting will take place this week, while next Friday, the country will release its monthly employment figures.
As for the technical outlook, the daily chart shows that the pair was unable to surpass a major long term resistance, the 61.8% retracement of the post-US election decline around 1.0930. Nevertheless, the bullish stance persists as the price stands above all of its moving averages, whilst technical indicators remain near overbought readings, with the RSI heading north around 65, and the Momentum fading modestly amid the lack of follow-through beyond the weekly high, rather than indicating diminishing buying interest. Shorter term, the 4 hours chart presents a neutral stance, as the price hovers around a horizontal 20 SMA, while technical indicators settled around their mid-lines. The pair will remain in consolidative mode as long as it holds within 1.0820 and 1.0950, with a clear break of any of such extremes setting the tone for the upcoming sessions.
Support levels: 1.0855 1.0820 1.0785
Resistance levels: 1.0910 1.0950 1.1000
USD/JPY
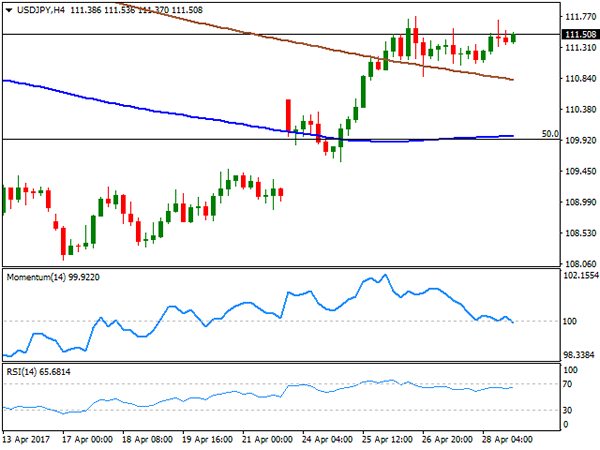
The USD/JPY pair closed its second consecutive week with gains, setting an April high of 111.77, but limited to the upside as falling US Treasury yields kept yen's losses in check. The yield on the 10-year Treasury note fell to 2.28% in the last day of the month, accumulating 11.4 basis points to the downside in April, the largest one month decline since last October. Also, a neutral BOJ, positive on growth, but downgrading its inflation forecast for the ongoing fiscal year, failed to motivate investors around the JPY, while tepid US growth and confidence figures released on Friday contained the upside. Not only US preliminary Q1 GDP came in at 0.7%, but also the Michigan consumer confidence index fell to 97 in April from 98 in March. Upcoming direction will likely depend on how the market reacts to the Fed's monetary policy outcome next Wednesday, with a bullish breakout expected in the case policymakers "confirm" a rate hike for next June. Technically, the daily chart shows that the price has settled above is 200 DMA, but also that the 100 DMA heads modestly lower around 112.70, the level to surpass to confirm a more sustainable recovery. In the same chart, the Momentum indicator heads sharply higher within positive territory, whilst the RSI indicator also advances around 59, all of which supports additional gains. In the 4 hours chart, the price is also above its moving averages that anyway maintain their bearish slopes, the RSI indicator hovers around 65, but the Momentum heads south around its 100 level, indicating diminishing buying interest around the pair.
Support levels: 110.95 110.60 110.20
Resistance levels: 111.75 112.10 112.45
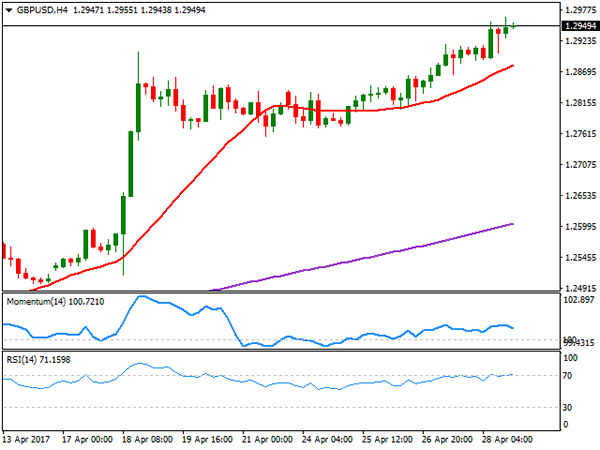
GBP/USD
The Pound managed to extend its rally to a fresh 7-month high of 1.2964 against its American rival, despite a weak UK Q1 GDP reading. The economy in the kingdom grew by just 0.3% according to preliminary estimates, hurt by the sharp advance in inflation triggered by the Brexit decision. Minor figures were released all through the week, still indicating some degree of resilience, although starting to dent confidence in the future developments. The pair closed the week at 1.2950, with market players eyeing the major psychological barrier at 1.3000, where large buying interest is expected to surge, at least on a first attempt of breaking higher. The pair retains its bullish technical stance according to the daily chart, as the price advanced far above its moving averages, whilst the RSI indicator heads north around 74 and the Momentum indicator consolidates near overbought readings. Still, unless the 1.3000 region is clearly broken, caution is recommended at current levels. According to the 4 hours chart, the risk is also towards the upside, as the 20 SMA maintains its bullish slope, currently around 1.2880, while technical indicators have partially lows upward strength, but hold near overbought levels.
Support levels: 1.2880 1.2830 1.2795
Resistance levels: 1.2965 1.3010 1.3060
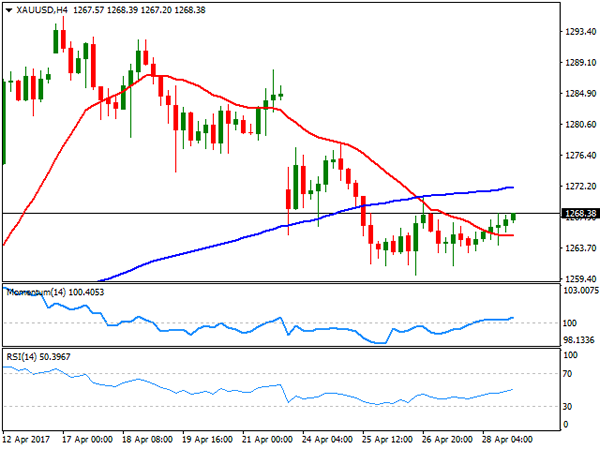
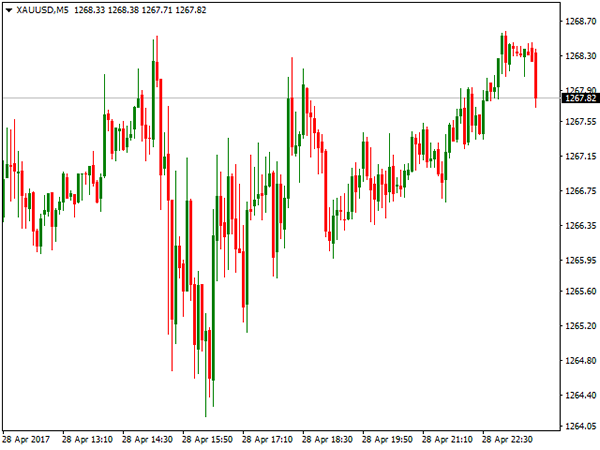
GOLD
Gold prices edged lower for a second consecutive week, with spot closing the week at $1,268.38 a troy ounce. The decline took place at the beginning of the week, as the outcome of the first round of the French presidential election spurred demand for high-yielding assets, in detriment of safe-haven hold. However, the commodity spent the rest of the week in consolidative mode, as investors turned cautious ahead of clearer signs of easing political woes, and limited demand for the US currency. The FOMC monetary policy decision is on tap this week, and while the Central Bank is largely expected to remain on hold, investors will be looking for clues on what's next to take directional positions. Daily basis, the price settled below its 20 DMA for the first time since mid March, while technical indicators retreated towards their mid-lines, supporting some additional declines, particularly on a break below 1,259.99, the weekly low. In the 4 hours chart, technical indicators present a limited upward potential, heading higher within neutral territory, whilst the price is now above a flat 20 SMA, but below its 100 SMA, this last at 1,272.05, providing a strong dynamic resistance.
Support levels: 1,259.90 1,250.70 1,242.50
Resistance levels: 1,272.05 1,278.10 1,288.20
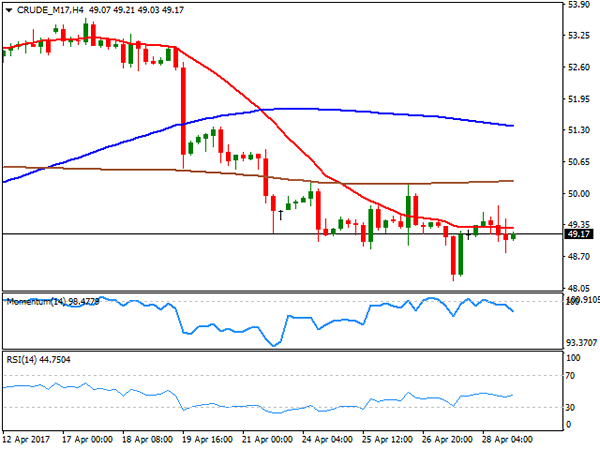
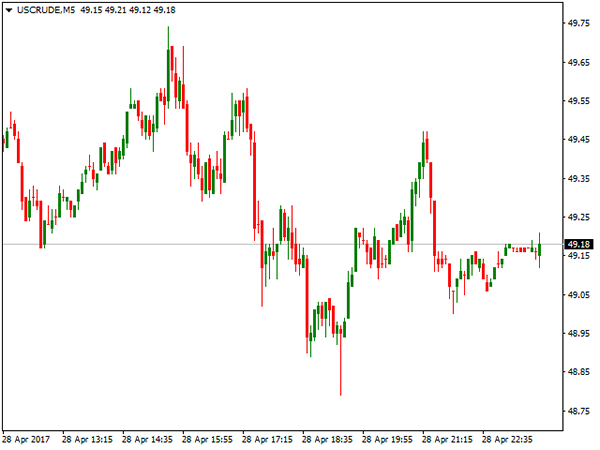
WTI CRUDE OIL
West Texas Intermediate crude oil futures settled at $49.17 a barrel, down for a second consecutive week, undermined over renewed concerns of persistent worldwide glut. The commodity fell to a weekly low of 48.21 on Thursday, following news that two key Libyan pipelines resumed producing around 400,000 barrels a day after protests blocking them,ended. Adding to the sour tone was US production, currently at 9.27 million bpd, the highest in nearly two years. Also, the Baker Hughes report released on Friday showed that the number of active oil rigs in the country surged to 697 up for 15th consecutive week. The daily chart for the commodity show that the price remains below all of its moving averages, with selling interest aligned around the 200 DMA, currently at 50.20, whilst technical indicators eased their bearish strength, but hold near oversold territory. In the 4 hours chart, the price settled below a flat 20 SMA, while technical indicators hold within bearish territory, with limited downward strength.
Support levels: 48.85 48.20 47.70
Resistance levels: 49.60 50.20 50.75
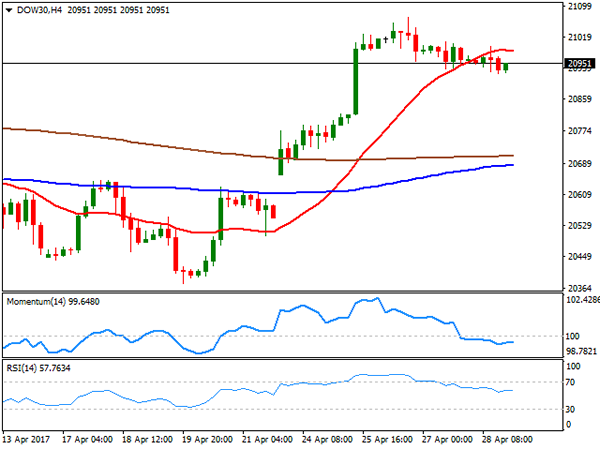
DJIA
US indexes closed lower on Friday, although with strong gains weekly basis. The Dow Jones Industrial Average shed 40 points on Friday, and closed at 20,940.51, whilst the S&P lost 4 points, to 2,384.20. The Nasdaq Composite closed the day 1 point lower at 6,047.61 after peaking at a fresh all time high during the day. Within the Dow Chevron was the best performer, up 1.17%, followed by Cisco Systems which added 0.95%. Intel led decliners, shedding 3.42%, whilst Verizon Communications lost 1.63%. Technically, the daily chart for the index showed that the index hold near record highs, but also that it lacks upward momentum, as it's holding above horizontal moving averages, whilst technical indicators began to easy modestly within positive territory. In the shorter term, and according to the 4 hours chart the benchmark is at risk of correcting further lower, as the 20 SMA lost its upward strength and turned flat, now offering a dynamic resistance at 20,982,, whilst the Momentum indicator turned flat within negative territory as the RSI indicator consolidates around 57.
Support levels: 20,923 20,869 20,819
Resistance levels: 20,982 21,035 21,071
FTSE100
US indexes closed lower on Friday, although with strong gains weekly basis. The Dow Jones Industrial Average shed 40 points on Friday, and closed at 20,940.51, whilst the S&P lost 4 points, to 2,384.20. The Nasdaq Composite closed the day 1 point lower at 6,047.61 after peaking at a fresh all time high during the day. Within the Dow Chevron was the best performer, up 1.17%, followed by Cisco Systems which added 0.95%. Intel led decliners, shedding 3.42%, whilst Verizon Communications lost 1.63%. Technically, the daily chart for the index showed that the index hold near record highs, but also that it lacks upward momentum, as it's holding above horizontal moving averages, whilst technical indicators began to easy modestly within positive territory. In the shorter term, and according to the 4 hours chart the benchmark is at risk of correcting further lower, as the 20 SMA lost its upward strength and turned flat, now offering a dynamic resistance at 20,982,, whilst the Momentum indicator turned flat within negative territory as the RSI indicator consolidates around 57.
Support levels: 20,923 20,869 20,819
Resistance levels: 20,982 21,035 21,071
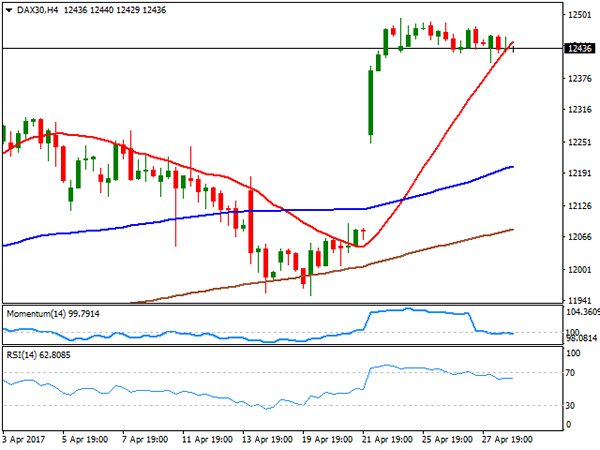
DAX
European equities traded lower on Friday, with the German DAX shedding 5 points to 12,438.01, as comments from US President Donald Trump on escalating tensions with North Korea weighed on investors' sentiment. Nevertheless, the benchmark settled not far from the record high achieved this past week at 12,495 following the result Macron's victory in France. On Friday, Commerzbank led advancers, adding 2.04%, followed by Linde which gained 1.63%. Losers, however, outpaced gainers, with Heidelberg Cement leading decliners with a 2.27% lost. The daily chart shows that the benchmark is within a consolidative phase, but also that the risk remains towards the upside as it holds well above healthy bullish moving averages, whilst indicators hold within positive territory. In the 4 hours chart, the technical outlook is neutral-to-bullish, as the index holds around a sharply bullish 20 SMA, the Momentum turned flat around its 100 level, while the RSI heads nowhere around 62.
Support levels: 12,405 12,366 12,312
Resistance levels: 12,458 12,495 12,530
Weekly Report: Energy, Commodities, Indices, Forex
ENERGY
WTI Oil posted the second weekly loss and stayed below psychological $50.00 level which was broken previous week. Crude oil was under pressure as investors doubted willingness of oil producers to extend its output cut deal for the next six months in order to fight global oversupply and support oil prices.
On the other side, concerns over rising production of US shale oil raised question about the use of reduced production that also pressured the price.
Earlier this week, Saudi oil chief acknowledged that the first quarter of cuts failed to stem the glut in supply to below the five-year average but hinted at the possibility of extending the supply-cut agreement beyond June. Renewed hopes of extension of output cut came after Russia affirmed its commitment to the supply-cut agreement, saying it is close to meeting its pledged 300,000 barrels-a-day cut amid concerns over rising U.S. production.
Crude oil inventories fell by 3.6 million barrels last week, beating the forecast of 1.6 million barrels draw, EIA report showed on Wednesday that managed to prevent oil price to fall further. WTI oil entered consolidation phase, signalled by long wicks of daily candles of past few days and managed to hold above important technical support at $49.06 (200SMA) despite few spikes lower.
This could be seen as basing attempt after two-week fall, as reversal signal has been generated by daily technical studies, however, oil price will be closely watching developments about extension of production cut that proved to be one of key oil price drivers recently.
Stronger recovery signals could be expected on rise of oil price above pivotal $50.00 and $51.00 barriers.
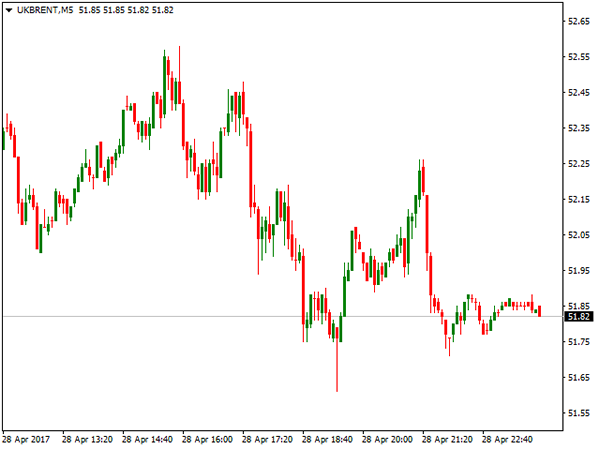
Brent Crude Oil showed similar performance like the WTI contract and found footstep at $51.30 zone, supported by 200SMA, which was cracked on short-lived spike to weekly low at $50.45. Brent oil is also showing technical signals of possible basing and fresh recovery attempts, however, the price remains capped by thick daily Ichimoku cloud (spanned between $52.33 and $53.56) which acts as strong resistance and stronger recovery signals require return above the cloud.
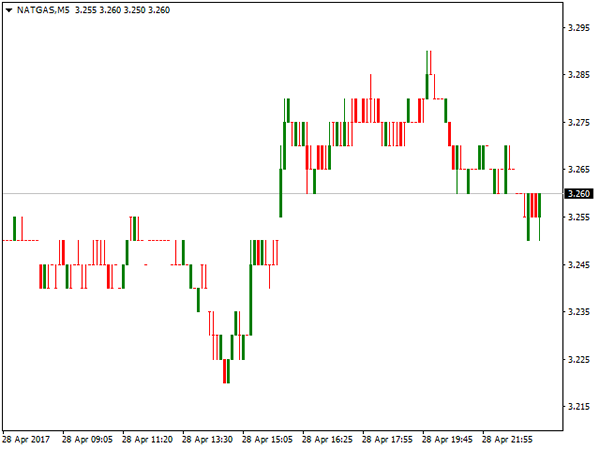
Natural Gas ended last week positively, gaining 5.8% for the week, after previous two weeks in red and formed bullish Engulfing pattern on the weekly chart that could be seen as initial bullish signal for continuation of larger bull-leg from $2.515, mid-Feb low.
Gas price was higher despite stronger than expected Natural Gas storage data, released on Thursday that showed build of 74 billion cubic feet which came above forecasted 72 billion build and well above last week's build of 52 billion cubic feet.
Recent rally was supported by improving daily technical studies which showed fresh bullish momentum, however, overbought conditions may reduce the pace of rally which is eyeing target at 3.340, once firmer bearish signal will be generated.
COMMODITIES
Spot gold kept within the range of $1260/70 during past three days after falling sharply on Tuesday that resulted in ending the second consecutive week in red. The yellow metal failed to capitalize from sluggish US data, after US jobless claims surged; consumer sentiment fell and GDP data showed that US economy suffered its weakest first quarter growth in three years. However, gold price managed to stabilize above important technical support at $1260 and stayed in consolidation range above the support for the past three days, which may signal basing attempt.
Further weakening of the dollar on weak US data would raise question about Fed's rate hike decision in June policy meeting that may give fresh boost the US interest rate sensitive gold price.
From the technical point of view, current lows are seen as ideal end of corrective downleg from $1295 peak to keep broader uptrend intact for fresh attempts higher.
Stronger bullish signals could be expected on rise above pivotal $1278/80 barrier, clear break of which would unmask next targets at $1285 and $1295.
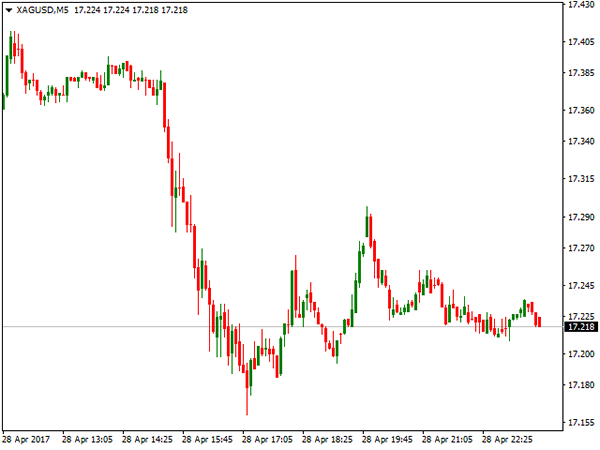
Spot Silver remained firmly in red for the second straight week and being down 3% for the week, on extension of steep descend from Apr 17 peak at $18.64. Strong bearish acceleration that has already retraced over 76.4% of Mar 15 – Apr 17 $16.81/$18.64 rally, threatens of final push lower to fully retrace the upleg. Bearish technical studies are supportive, however, the fall may be paused for corrective bounce on oversold daily conditions.
Initial resistances lay at $17.42/50, with another technical barrier at $17.80, expected to cap recovery attempts.
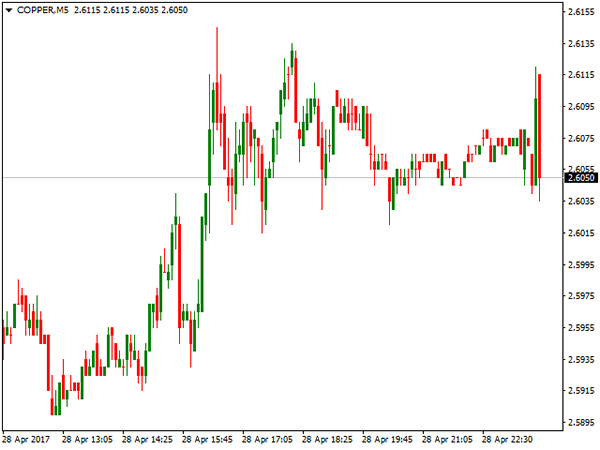
Copper managed to recover a good part of losses from previous three weeks and end week positively with weekly gain of 2.4%. Extension of bounce from 2.4935 low that was posted on Apr 19, turned near-term technical into bullish mode, supportive for further recovery. On the other side, recovery rally could be seen as limited correction of larger downtrend from 2.8215, peak of Feb 13, as rally faces strong barrier, shaped in daily Ichimoku cloud, spanned between 2.6490 and 2.6898, which may cap recovery, as overall structure remains bearish.
INDICES
Global stocks were relieved on fall of tensions and uncertainty after the first round of French presidential election, as well as lowered geopolitical tensions that brought risk appetite back to play last week.
Dow Jones gapped-higher last Monday and rallied strongly, to post week's high at 21010 on Wednesday. The rally which retraced over 76.4% of 21160/20310 corrective pullback, also broke above strong technical barriers and turned technical studies into bullish setup, would signal return to new record high at 21160 and possible resumption of broader uptrend.
Dow ended the second week positively and gained over 1% for the week shows strong signal of further upside. However, descending daily candles of past three days suggest that bulls are taking a breather after strong rally and extended correction on strongly overbought daily studies could be anticipated.
Correction is expected to ideally find support at 20795 (daily Ichimoku cloud top) before fresh bulls emerge.
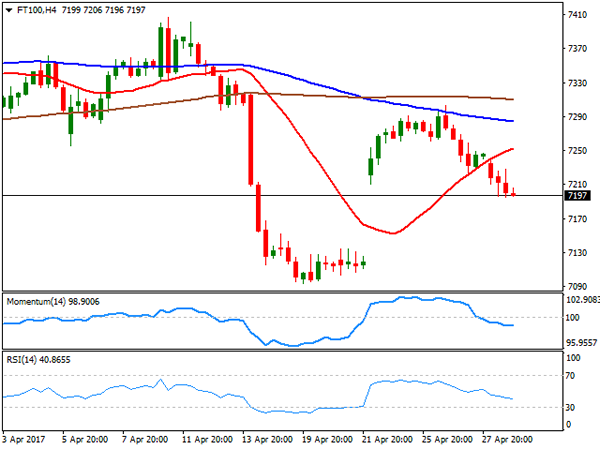
FTSE 100 index ended week positively but failed to capitalize more on fresh bullish sentiment last week that pushed the price significantly higher, after last week's sharp fall on early UK election announcement.
FTSE rallied strongly on Monday, after starting the day with gap-higher, driven by strong risk-on sentiment and peaked at 7247 on Wednesday, up over 200 points after record fall last week.
However, the index was unable to sustain gains moved lower from Wednesday's peak. Past three days in red dented freshly built bullish near-term structure and renewed downside pressure on existing bearish outlook on larger timeframes.
FTSE rally was capped by the base of thick daily Ichimoku cloud that kept recovery limited and returned downside risk in play.
Stronger British pound also added on fresh weakness of FTSE100 price weakness.
Friday's close below daily Tenkan-sen line (7160) could be seen as bearish signal for fresh weakness towards targets at 7139 and 7114.
FOREX
The EURUSD had a turbulent start of the week, opening with nearly 200-pips gap higher after results of the first round of French election showed Emmanuel Macron won the round, followed by his right-wing opponent Marine Le Pen. Markets were relieved from persisting fears of the victory of anti – EU candidate and likely Frexit scenario and appreciated on election results.
Risk appetite returned to play and investors heavily moved into Euro on significantly improved sentiment.
The pair peaked at 1.0950, where gains were capped by weekly 55SMA which guards psychological 1.1000 barrier, reinforced by weekly 100SMA.
Important support for the Euro comes from 200SMA which was broken on Monday's surge and now acting as strong support at 1.0834, as the pair spent most of past week congested between 200SMA and 1.0950 barrier where multiple upside rejections occurred.
The pair is looking for firmer direction signal which will take the price out of current congestion. Overbought daily studies signal correction, but the price continues to trade above key 200SMA and holding in directionless near-term mode.
The single currency received support improved EU economic sentiment data that showed economic sentiment climbing to a near ten-year high in April.
European Central Bank held its monetary policy on Thursday and stayed unchanged on ultra-low rates, as expected. On the press conference ECB President Mario Draghi signalled some improvement in the growth in Eurozone, but pointed that inflation is not expected to rise significantly this year and said that there were no talks of ending stimulus program that kept the Euro at the back foot.
Directionless action after strong jump at the beginning of the week signals that the Euro is seeking for stronger signals and awaiting the final round of French presidential election, due on May 7.
GBPUSD maintained positive tone during the past week, being ragged higher by Euro's fresh strength. The pair hit new multi-month high at 1.2955 on Friday, exceeding previous week's peak at 1.2904, posted after sterling's surge on early election announcement. The pair maintained bullish tone during the week, holding firm bullish sentiment from the previous week and focusing psychological 1.3000 barrier in the near term.
Release of GDP data on Friday showed that Gross Domestic Product missed slightly the forecast but remained firm, after the UK entered official Brexit process.
Annualized GDP came at 2.1% in Q1, compared to 2.2% forecast but above Q4 1.9%, while quarterly release was at 0.3% against consensus at 0.4%.
Cable is on track for the second bullish weekly close that is seen as bullish signal as the pair eventually broke above 1.2000/1.2770 consolidation after post-Brexit fall bottomed at 1.2000 zone.
Near-term action is focusing 1.3000 barrier initially and may extend to 1.3110 (weekly Ichimoku cloud base) which marks next strong resistance.
USDJPY pair was firmly bullish last week, as traders exited longs from safe haven yen after geopolitical tensions lowered and Frexit fears faded and moved into riskier assets that boosted the dollar. The pair is on track for the second bullish weekly close and looking for the close above weekly Ichimoku cloud top at 111.36 which was cracked on several attempts higher but gains were capped by weekly Tenkan-sen at 111.80.
USDJPY is ending month in long-tailed Doji candle, which could be seen as positive signal after strong downside rejection at 108.11 and subsequent strong recovery.
The Bank of Japan kept interest rates unchanged on their Thursday's policy meeting but offered its most optimistic assessment of the economy in nine years, describing recent weakness in inflation as temporary and signalling strong optimism about the economy.
Australian dollar ended week strongly in red against it US counterpart, being down nearly 1.3% for the week. Aussie dipped to 0.7440, the lowest since mid-January. Bearish acceleration took out some very important technical supports and penetrated deeply into thick weekly Ichimoku cloud which offers strong support and signalled stronger retracement of Dec/Mar 0.7160/0.7747 ascend, after previous week's action was capped at 0.7610 and this week's trading was firmly in red.
However, the pair found support 0.7440 and bounced higher on Thursday after the markets were disappointed by long awaited president Trump's tax plan, as plan offered no fresh surprises after being unveiled on Wednesday and failed to excite investors, sending the US dollar lower.
Aussie extended recovery on Friday, driven by renewed positive sentiment and profit-taking on strong weekly fall that pushed the price to close above broken former key support at 0.7472.
AUDUSD pair ended April's trading in red, adding to developing negative picture after recovery rejection at 0.7749 in March and subsequent weakness that marked two consecutive months in red.
Canadian dollar ended the second straight week in negative tone against the US dollar, being down nearly 1.5% for the week and also losing 2.65% for the month. Loonie came under pressure earlier this week on comments on US/Canada lumber trade but regained ground on announcement of President Trump that he will not terminate the NAFTA treaty at this stage but will move quickly to begin renegotiating conditions with Canada and Mexico, for the benefit of all three countries.
However, CAD did not manage to hold gains longer and was driven lower again by broader US dollar’s uptrend, the last leg of which commenced from mid-April and took very strong technical barrier at 1.3573 (weekly Ichimoku cloud top) which could signal further strength of USDCAD pair.
EURUSD – Risk Remains Lower On Bear Pressure
EURUSD - With the pair still retaining its downside pressure, more weakness is likely. Resistance comes in at 1.0950 level with a cut through here opening the door for more upside towards the 1.0000 level. Further up, resistance lies at the 1.1050 level where a break will expose the 1.1100 level. Its weekly RSI is bullish and pointing higher suggesting further strength. Conversely, support lies at the 1.0850 level where a violation will aim at the 1.0800 level. A break of here will aim at the 1.0750 level. All in all, EURUSD faces further bear threats but with caution.
USDCHF – Turns Off Lower Level Prices
USDCHF - The pair closed higher on Friday following its turn off lower prices. This development now leaves it targeting further upside in the new week. On the downside, support lies at the 0.9900 level. A turn below here will open the door for more weakness towards the 0.9850 level and then the 0.9800 level. On the upside, resistance resides at the 1.0000 level where a break will clear the way for more strength to occur towards the 1.0050 level. Further out, resistance comes in at the 1.0100 level. All in all, USDCHF faces further recovery risk though with caution
Ignoring The Emotion Of Fear To Short Oil… If Only.
Welcome back to your charts and to yet another Monday morning look at Oil.
Unlike the very nature of the fossil fuel we're trading, Oil really is the chart that keeps on giving!
Check out the rejection out of resistance on the daily chart below:
OIL Daily:
We've been following this major Oil resistance level for a while now and if you look back at our last blog, I was too scared to short Oil… SIGH.
But as our great friend Warren Buffet says:
'Be fearful when ithers are greedy, be greedy when others are fearful.'
Could that quote ring anymore true in the context of the above Oil chart? We had the resistance level holding which pointed to a short, but fearful emotions on the back of perceived escalations in the Syrian conflict saw me shy away.
Talk about frustrating! But hey, as all traders know, I have nobody to blame but myself.
Euro Lost Momentum after Sharp Rally, Dollar to Look into FOMC and Non-Farm Payroll
Euro surged sharply for the initial part of last week as boosted by the result of French president election. The common currency ended the week as the strongest major currency. But it has clearly lost some momentum after a balanced ECB press conference. On the other hand, Sterling continued to defy gravity and picked up momentum again towards the end of the week. The British Pound has indeed ended April as the strongest major currency for the month. The weakness in the Japanese Yen might take some attention. But it was the selloff in commodity currencies, in a risk-seeking environment, that is worth the watch. Meanwhile, Dollar found no support from US President Donald Trump's tax plan, but it didn't react negatively to Q1 GDP miss neither.
French election watched again, but result should be priced in
EU leaders gathered on Saturday in a summit and approved the Brexit negotiation guidelines unanimously. The terms were basically the same as what were reported. And, based on the lack of negative reaction to Brexit news by Sterling, we'd expect the news to be shrugged off. Meanwhile, France will have the run-off election next Sunday on May 7. Such event will definitely get much attention from the markets. But for now, it looks like a done deal for centrist, pro-euro, Emmanuel Macron to win and become the next French President. Hence, the result should be well priced in.
FOMC and NFP are the focuses
The focus should turn back to a busy week in the US, with FOMC meeting and non-farm payroll featured. At this point, the base case for Fed remains unchanged. That is, Fed will continue with it's plan of a total of three rate hikes this year. That would be followed by a "brief pause" as Fed starts shrinking its balance sheet later in the year. Markets are pricing in over 60% chance of a rate hike by Fed in June. It's generally believed Fed will look past the weaker than expected Q1 GDP data. The key will now be on how the US economic bounce back in in Q2. And the set of ISM indices for May and NFP for April will be crucial.
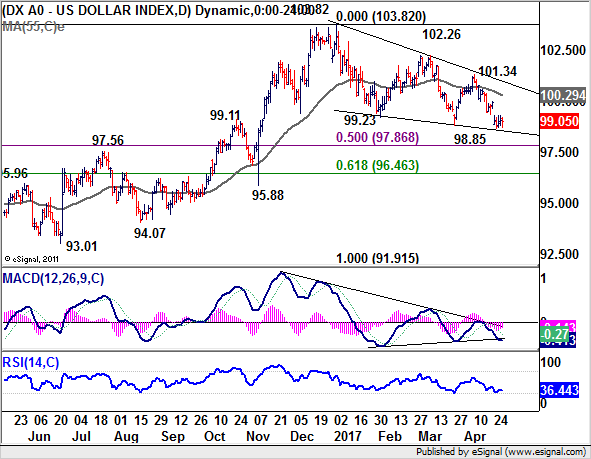
Prospect of a dip in Dollar index before rebound
Dollar index suffered steep decline initially last week thanks to the strength in Euro. But the index then turned sideway. At this point, we're viewing the fall from 101.34 as part of the corrective pattern from 103.82. If our view is correct, such pattern is likely a triangle pattern too. There is prospect of another dip but there should be strong support above 50% retracement of 91.91 to 103.82 at 97.86 to bring rebound.
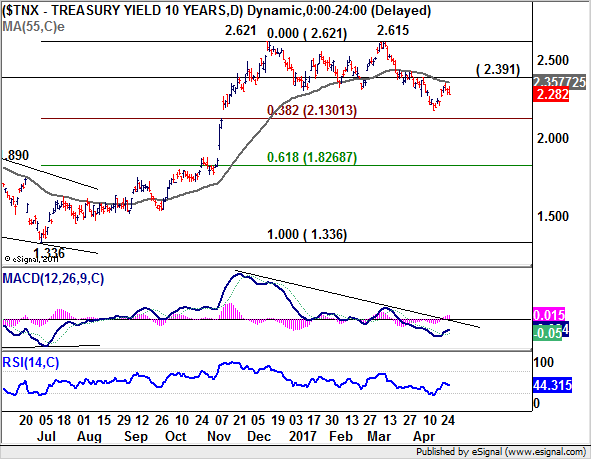
10 year yield might go down before up
Ideally, the rebound in Dollar index should be accompanied by corresponding rise in treasury yields. TNX's rebound failed to break through 55 day and EMA and 2.391 resistance last week. There is prospect of another fall. But there is no change in the view that price actions from 2.621 are a corrective move. Hence, even in case of a deeper fall, downside should be contained by 38.2% retracement of 1.336 to 2.621 at 2.130 to bring rebound.
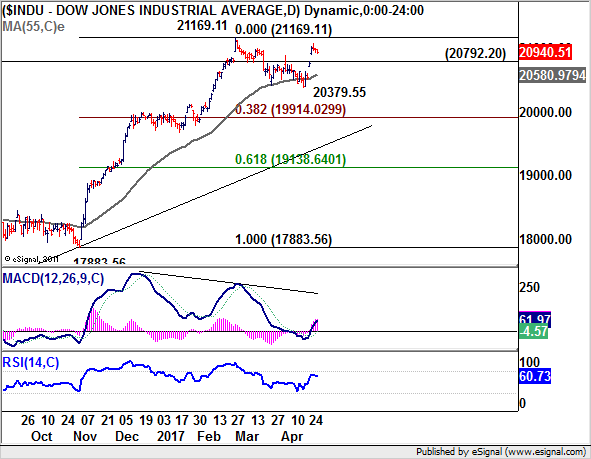
DJIA should limited below record high
In the US stock markets, NASDAQ extended the record run last week. But both DJIA and S&P 500 showed hesitation ahead of record highs. DJIA was limited below 21169.1 and retreated. But the pattern from 21169.11 to 20379.55 does suggest it's a completed correction. Hence, we're favoring another rally ahead through 21169.11 in near term. But break of 20792.20 support will dampen our view and extend recent consolidation instead. And we'd maintain the preference to see strength in stocks, yields and Dollar to confirm the underlying bullishness and optimism in the US economy.
Aussie out-performed Canadian...
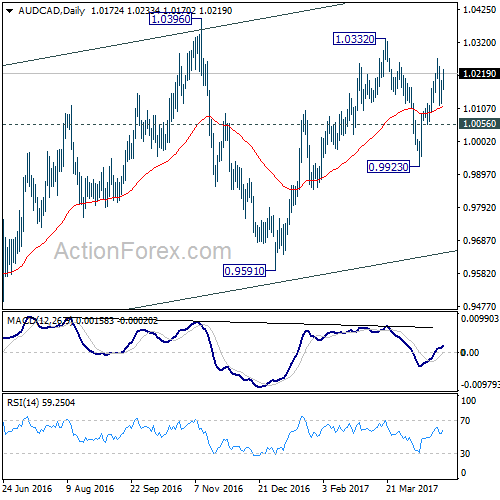
We've talked about the weakness in commodity currencies above. Comparing them, we'd see that AUD/CAD's pull back from 1.0332 has clearly completed at 0.9923 already. Last week's brief retreat was contained above 55 day EMA, and thus, maintains some near term bullishness. It should also be noted that 0.9923 also coincide with 55 week EMA back then. Hence for now, we'd expect further rise in the cross as long as 1.0056 support holds, for 1.0332. And the medium term choppy rise from 0.9148 would likely resume through 1.0396 high.
...and Kiwi too
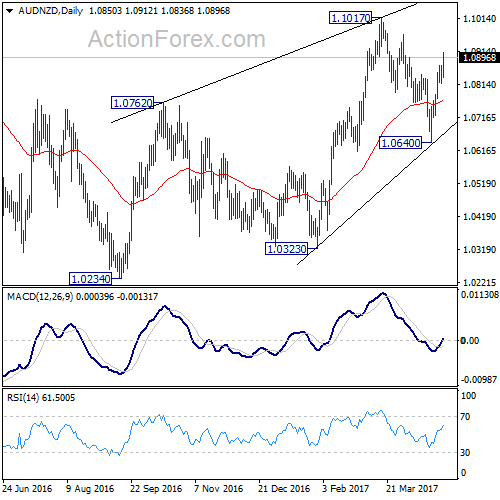
AUD/NZD's pull back from 1.1017 should also be completed at 1.0640 after drawing support from 55 week EMA. Rise from 1.0234 is likely resuming through 1.1017. Also, the medium term fall from 1.1638 should be completed as a three wave correction to 1.0234. Hence, there is prospect of targeting a test on 1.1331 resistance at least. For now, from the outlook of AUD/CAD and AUD/NZD, Aussie is not the one to sell against other major currencies.
To buy GBP/JPY and USD/CAD on dips
Regarding trading strategy, firstly, we'd expect Sterling to continue to outperform Euro. Secondly, there is prospect of a reversal in Dollar, but it may not be ready yet. Yen's weakness is expected to continue on risk appetite and also concerns on tension in North Korea. Commodity currencies would likely stay weak but Aussie should be avoided. Between Canadian Dollar and New Zealand Dollar, we'll choose the former for the uncertain trade relationship with US and weakness in oil price.
Hence, we'll try to buy GBP/JPY on a dip to 142.00 this week, with a stop at 140.00. We'd expect GBP/JPY to target 148.42 high and above. Meanwhile, we'll also try to buy USD/CAD on a dip to 1.3500, with a stop at 1.3400. We expect USD/CAD to extend the medium term rise from 1.2460 to 1.3838.
GBP/JPY Weekly Outlook
GBP/JPY rose sharply to as high as 144.48 last week. The development should have confirmed our view that consolidation pattern from 148.42 has completed at 135.58, ahead of 135.39 medium term fibonacci level. Further rise should be seen through 148.42 ahead.
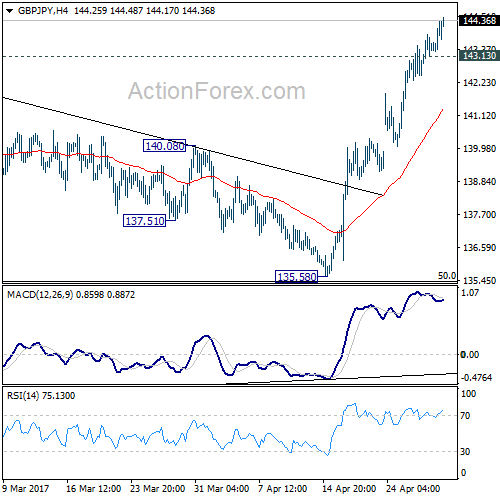
Initial bias in GBP/JPY remains on the upside this week. Break of 144.77 resistance will likely resume the whole rebound from 122.36 through 148.42 resistance. On the downside, break of 143.13 minor support will turn bias neutral and bring consolidation before staging another rally.
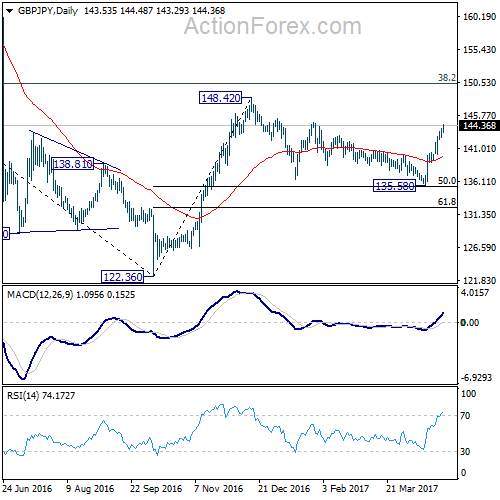
In the bigger picture, based on current momentum, rise from 122.36 bottom should be developing into a medium term move. Break of 38.2% retracement of 195.86 to 122.36 at 150.42 should pave the way to 61.8% retracement at 167.78. This will now be the favored case as long as 135.58 support holds.
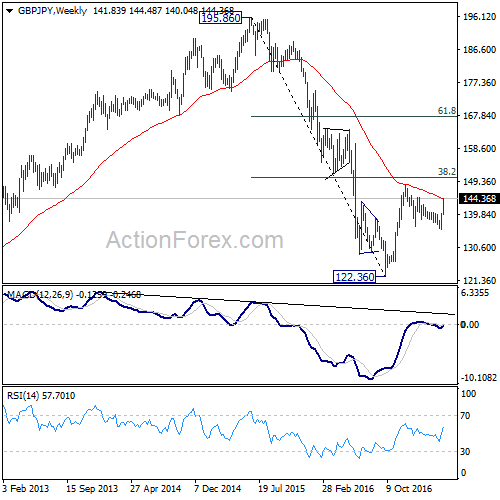
In the longer term picture, based on the impulsive structure of the decline from 195.86 to 122.36, such fall should be completed yet. But we will now pay close attention to the structure of the rise from 122.36 to determine whether it's a corrective move, or an impulsive move. That would decide whether a break of 116.83 low would be seen.
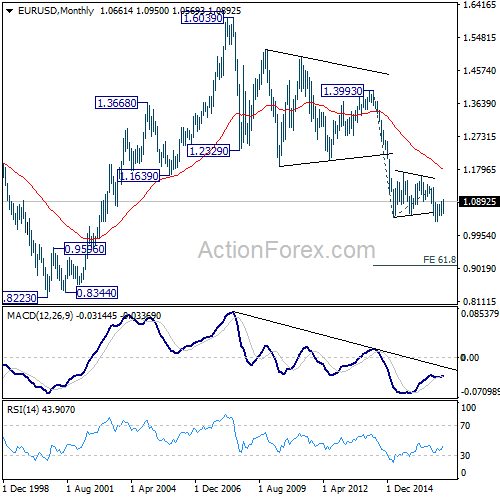
EUR/USD Weekly Outlook
EUR/USD jumped to 1.0949 last week but turned sideway since then. Further rise could be seen in the pair in near term. But choppy rebound from 1.0339 is seen as a correction. Hence we'd look for topping again on next rise.
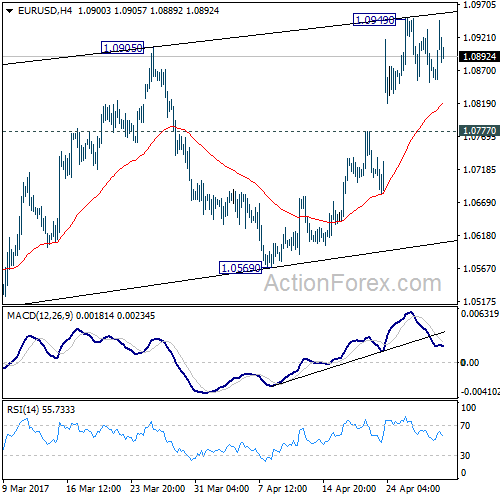
Initial bias in EUR/USD is neutral this week first. At this point, another rise could be seen as long as 1.0777 support holds. But still, rise form 1.0339 is seen as a corrective move. Hence we'd pay attention to topping signal even if EUR/USD rises through 1.0949. On the downside, below 1.0777 minor support will turn bias to the downside for 1.0569 support first.
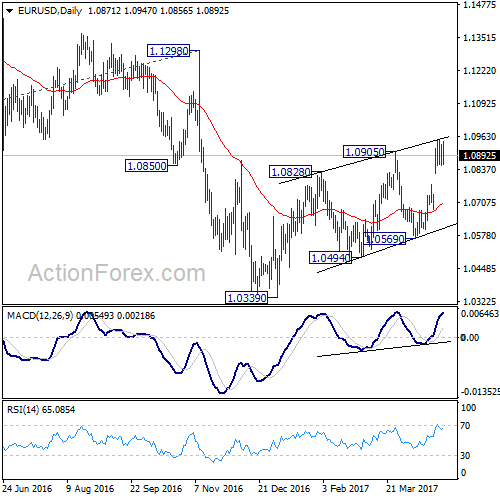
In the bigger picture, as long as 1.1298 key resistance holds, whole down trend from 1.6039 (2008 high) is still expected to continue. Break of 1.0339 low will send EUR/USD through parity to 61.8% projection of 1.3993 to 1.0461 from 1.1298 at 0.9115. However, considering bullish convergence condition in weekly MACD, break of 1.1298 will indicate term reversal. this would also be supported by sustained trading above 55 week EMA.
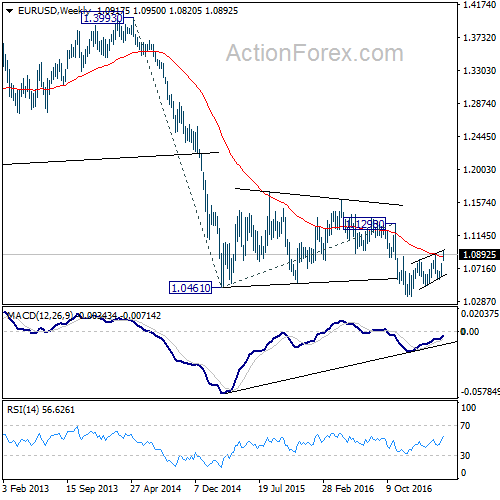
In the long term picture, the down trend from 1.6039 (2008 high) is still in progress and there is no clear sign of completion. We'd expect more downside towards 0.8223 (2000 low) as long as 1.1298 resistance holds. However, firm break of 1.1298 should now confirm long term reversal.