
Sample Category Title
Eco Data 5/5/17
[php_everywhere] [/php_everywhere]
Eco Data 5/4/17
[php_everywhere] [/php_everywhere]
Eco Data 5/3/17
[php_everywhere] [/php_everywhere]
Eco Data 5/2/17
[php_everywhere] [/php_everywhere]
Eco Data 5/1/17
[php_everywhere] [/php_everywhere]
Summary 5/1 – 5/5
Monday, May 1, 2017
[php_everywhere] [/php_everywhere]
Tuesday, May 2, 2017
[php_everywhere] [/php_everywhere]
Wednesday, May 3, 2017
[php_everywhere] [/php_everywhere]
Thursday, May 4, 2017
[php_everywhere] [/php_everywhere]
Friday, May 5, 2017
[php_everywhere] [/php_everywhere].
Weekly Economic and Financial Commentary
U.S. Review
Q1 Growth Comes in a Paltry 0.7 Percent
- Residual seasonality likely deserved some of the blame in the weak numbers in this morning's Q1 GDP report, and the slowdown in personal consumption was also a major factor. That said, many factors that weighed on consumption were transitory, and business investment has perked up.
- Other economic data released this week point to an economy on solid footing. The housing market had a strong start to the year but is constrained by lean inventory, as evidenced by new and pending home sales data. Consumers are in high spirits and confident in the economic outlook, particularly in terms of job prospects, according to surveys released this week.
Economic Growth Trips Out of the Gate in Q1
This morning's first estimate of Q1 GDP growth was expected to be on the weak side, as Q1 has tended to be many times over the past decade. Still, residual seasonality in the series does not explain the very weak showing for personal consumption in the first three months of 2017. Personal consumption has been the driving force of GDP growth for much of the past two years as the commodity downturn, slower business investment and slower global economic growth weighed on other components of GDP, while the strong domestic labor force supported solid personal consumption. Given that, the 0.3 percent print for PCE could be cause for concern. We suspect that some of the slowdown was transitory, as warm weather cut utilities consumption in January and February. The auto sector is also less supportive to retail sales as the boom in sales tops out. Another possible factor in soft spending in the first quarter is the later timing of tax returns this year, which may have pushed out some purchases to April. Fundamentals support a bounce back in consumption as the strong labor market supports income growth.
There is little indication spending has hit an inflection point from the consumer surveys, which we look to for hints about future consumer spending. The Conference Board's Consumer Confidence report earlier this week did decline slightly more than expected in April after hitting a cycle-high in March. Its current reading is the second highest. The University of Michigan Survey of Consumer Sentiment was also positive. Confidence has surged since the November election, particularly in the expectations component. Though the surge in attitudes has yet to translate to a surge in spending, we are encouraged by consumers' assessment of their present situation, as consumers report favorable labor market conditions, which bodes well for future spending.
Residential investment was a bright spot in Q1 GDP. Housing has been one area in which soft data and hard data agree. The NAHB/Wells Fargo Housing Market Index has jumped since the election, and new homes sales have followed suit, rising to the second highest current-cycle pace in March. The rise in new home sales surprised consensus, which had expected a softer reading after February's surge. Demand for housing is strong although the supply of homes for sale, particularly for lower priced homes, is lean and buyers face stiff competition. That competition was likely a contributing factor to the softer March print for pending home sales, which measures contract signings of existing properties. Mild weather in January and February likely also pulled forward some activity that usually happens in March. The trend in housing is strong, and the sector is set for an active year as rising interest rates and house prices may prompt consumers on the fence to decide now is the time to buy.
Equipment spending was another bright spot in Q1 GDP as the recovery in business spending continues. Durable goods factory data this week showed solid shipments of core capital goods in March, which are a useful proxy for business investment in the GDP calculations. Core order capital goods orders did slow, which suggests a more moderate clip to start Q2.
U.S. Outlook
PCE Inflation • Monday
Inflation, according to the PCE deflator, the most closely watched measure by the Fed, started the year off strong. After strong gains in the first two months of the year, the year-over-year rate reached the Fed's target for the first time in nearly five years. Inflation looks to have softened in March, however. Energy prices, which lifted inflation in January and February, fell in March. Core inflation is also expected to stay flat following weakness in core goods and an unusually large decline in wireless phone services.
We look for nominal personal income to have risen 0.2 percent in March, but the weaker rate of inflation points to stronger growth in real disposable income. Spending is also set to increase about 0.1 percent amid greater utilities spending and tax returns that were delayed in February.
Previous: 0.1% Wells Fargo: -0.1% Consensus: -0.2% (Month-over-Month)
ISM Manufacturing • Monday
After a turnaround that began late last year, activity in the manufacturing sector looks to have lost some steam. Purchasing managers' indices, including the ISM index, generally edged lower in March, while manufacturing output according to the Fed's industrial production report fell for the first time in seven months.
The pullback follows some of the strongest readings on manufacturing activity in more than two years and suggests activity is settling in at a more sustainable pace. We expect the ISM manufacturing index to have slipped in April to a still-strong 56.6. Improvement in global growth and commodity prices, as well as a relatively stable dollar, all look to underpin a continued recovery in the factory sector.
Previous: 57.2 Wells Fargo: 56.6 Consensus: 56.5
Employment • Friday
Nonfarm payrolls rose by an average of 178,000 jobs per month in the first quarter, but atypical weather and a late Easter holiday led to sizeable monthly swings. After increasing by more than 200,000 jobs in January and February, hiring slowed to 98,000 in March.
With seasonal effects expected to play less of a role in April, we expect payrolls to have risen a more trend-like 190,000. Jobless claims fell both over the survey week and on a four-week average basis in April, consistent with fewer layoffs, while hiring plans edged up in March.
After an unusually large drop in the number of workers reported as unemployed in March, we expect the unemployment rate to tick up to 4.6 percent in April, although the trend remains downward.
Previous: 98,000 Wells Fargo: 190,000 Consensus: 193,000
Global Review
Eurozone: Diminution of Downside Risks?
- Markets breathed a sigh of relief this week following the first round of the French presidential election. Polls show that the centrist Emmanuel Macron should beat the populist Marine Le Pen in the second round of the election on May 7.
- The ECB kept its main policy rates on hold this week, but said that the downside risks to the outlook were starting to diminish. The ECB likely will maintain the current size of its QE program for the next few months, but it could announce plans sometime this summer to "taper" further if the economic outlook remains sanguine and/or inflation continues to trend higher.
Eurozone: Diminution of Downside Risks?
Voters in France went to the polls on Sunday April 23 in the first round of that country's presidential election. After the votes had been tabulated, Emmanuel Macron, the candidate of the centrist En Marche! party, and Marine Le Pen, of the right wing National Front, were on their way to face off in the second round. The winner of the run-off election on May 7 will become the next president of France.
Most market participants were relieved that Jean-Luc Mélenchon, the candidate of the Left Party, did not make it into the second round. The fear was that candidates representing the far right and the far left, who both hold skeptical views regarding French membership in the European Union, would make it into the second round. Polls show that Macron should beat Le Pen handily in the second round. Polls obviously can be poor predictors, and anything can clearly happen between now and May 7. That said, the polls for the first round of the election turned out to be quite accurate. If Mr. Macron is elected president on May 7, then a downside risk to the French economy, and more broadly the overall euro area, from a potential unraveling of the European Union and/or the Eurozone will have dissipated.
The European Central Bank (ECB) held a regularly scheduled policy meeting on Thursday, at which the Governing Council kept its main policy rates unchanged, which was universally expected (see chart on front page). In the statement ECB President Draghi read at the beginning of his press conference, the Governing Council stated that risks to the Eurozone outlook "are still tilted to the downside." However, the Governing Council also acknowledged that risks were "moving towards a more balanced configuration." Indeed, the Eurozone economy appears to be on solid footing right now, at least if sentiment indicators are to be believed. The economic confidence indicator in the euro area, which has been trending higher since last summer, rose to a new cycle high in April (top chart).
However, "hard" data generally show that economic growth in the euro area is not quite as strong at present as the "soft" data would imply. Yes, real GDP in Spain rose 0.8 percent (not annualized) on a sequential basis in the first quarter to keep the year-overyear rate of growth steady at 3.0 percent. But, Spain is an outlier. Real GDP in France grew only 0.3 percent sequentially and 0.8 percent year-over-year in Q1 (middle chart). More generally, real GDP in the overall euro area likely rose at a sub-2 percent rate in the first quarter. In other words, the Eurozone economy continues to grow, albeit at a fairly modest pace.
Modest GDP growth has translated into benign CPI inflation. The overall rate of inflation currently stands just below 2 percent (bottom chart). Although the core rate of inflation is lower, it did shoot up from 0.7 percent in March to 1.2 percent in April. In our view, the ECB will continue to buy €60 billion worth of bonds each month for the next few months. Sometime this summer, however, the Governing Council could announce plans to "taper" its bond purchases further if the economic outlook remains sanguine and/or inflation continues to trend higher.
Global Outlook
China Caixin Manufacturing PMI • Monday
The Caixin manufacturing PMI index has been in expansionary territory (above the 50-threshold) since July 2016, and analysts expect this trend to continue. Although the index downshifted to 51.2 in March from 51.7 in February, the consensus forecast is calling for a slight rebound to 51.3 for April.
Last week, Q1 GDP data for China revealed that the Chinese economy expanded 6.9 percent year over year. The notable strength in the secondary industry, which includes manufacturing, boosted the headline number and provided further evidence that economic growth is stabilizing following a gradual deceleration in GDP. The secondary industry accounts for roughly 40 percent of the value added in the Chinese economy. As the second-largest economy, and the world's largest manufacturer, China's Caixin manufacturing PMI will be watched especially closely by markets.
Previous: 51.2 Consensus: 51.3
Brazil Industrial Production • Wednesday
Brazilian industrial production data for March is slated to be released next Wednesday. After decreasing 0.2 percent in January, the index increased 0.1 percent in February. A strong print for March could signal that Brazil is successfully emerging from its eight-quarter long recession. In Q4, the industrial sector of Brazil, which includes mining, manufacturing, construction and utilities production, contracted 2.5 percent, year over year.
Also on the docket for next week is Brazilian trade data, including total imports and total exports for April, both of which are expected to downshift from the prior month. Vehicle sales data for April are also slated for release early next week, a notable metric to gauge the strength of the consumer. Taken together, next week's indicators will be helpful in assessing the strength of the Brazilian economy recovery as it attempts to emerge from recession.
Previous: 0.1% Consensus: 0.0% (Month-over-Month)
Eurozone GDP • Wednesday
Real GDP in the Eurozone rose 0.4 percent in Q4-2016 and is expected to rise 0.5 percent in Q1-2017 to mark the 16th consecutive quarter in which growth has been positive on a sequential basis. But because economic growth has been generally sluggish over that period, inflation has remained subdued, as further evidenced by this morning's release of the CPI.
We forecast that the pace of economic activity in the euro area will gradually gain traction as exports accelerate and as the effects of monetary accommodation make their way through the economy. In our view, the ECB will deem that further policy accommodation is not needed as inflation slowly creeps higher. Policy tightening will likely not be needed either, at least not in the foreseeable future. We look for the Eurozone to expand 1.8 percent and 2.0 percent in 2017 and 2018, respectively.
Previous: 0.4% Wells Fargo: 0.5% Consensus: 0.5% (Not Annualized)
Point of View
Interest Rate Watch
Looking Ahead to the FOMC
With the disappointing first quarter GDP numbers and generally softer economic data in general for March, we do not expect the Fed to make any major changes to policy or its policy statement at this week's FOMC meeting. The policy statement will likely reaffirm the Fed's belief that despite the apparently weak first quarter GDP data, the overall economy is very close to where the Fed would like it to be in regard to full employment and inflation. The bottom line should be that two more quarter point rate hikes are likely this year, which is one more than the financial markets are currently pricing in.
We expect the Fed to look past the most recent stumble in GDP growth. Sluggish first quarter real GDP growth has been an all too frequent occurrence during this expansion, with the current quarter likely marking the fifth time in the past eight years that reported first quarter growth will be the weakest quarter of the year. Given the apparent issues with residual seasonality, the Fed will likely focus more attention on the continued improvement in the labor market and rebound in inflation.
While Q1 GDP growth was disappointing, corporate earnings seem to be coming in at or above consensus expectations, and topline revenues are also coming in on the strong side. We suspect that the improvement in earnings is due to companies working through the earlier appreciation of the dollar, a rebound in oil prices and energy production, and some strengthening in global demand.
Long-term interest rates have remained remarkably well behaved in light of the recent pop in equity markets, as well as higher forecasts for global GDP growth and inflation. The 10-year yield rose slightly following the French election but ended the week right around 2.30 percent. Our take on the split is that stock investors are focusing on more immediate concerns surrounding improved earnings and less geopolitical risk in Europe while bond investors are more focused on the potential for more disruption coming from the Korean peninsula as well as the current budget impasse in Washington.
Credit Market Insights
Moderation in Auto Lending
Light vehicle sales remained elevated at 17.2 million in Q1, or 15.2 percent higher than the average quarterly pace of 14.9 million since the end of the recession. However, auto loans have decreased the past two quarters, and ended 2017 at 6.7 percent year-over-year growth, down from 8.5 percent growth in Q2-2016. As we examine the current auto lending environment, there are signs pointing to a potential moderation in the run on auto sales that we have seen recently.
In addition to the slowdown of auto lending, the net percent of banks reporting tighter standards for auto loans has grown to 11.7 percent, substantially up from the -6.3 net percent reported in Q1-2016. Of all consumer loan categories surveyed, autos currently have the highest net percentage of banks reporting a tightening of credit standards. Furthermore, Q1-2017 brought a sharp decline in demand for auto loans, with a net percentage of -13.6 percent reporting stronger demand for auto loans, down from 16.7 percent in Q4. Loan rates have been at all-time lows, but have recently started to tick upward, which could explain the tightening standards and dwindling demand for auto loans. Last, auto loan financing has continued rising compared to new car and truck prices, possibly signaling an oversupply of auto financing. Considering the auto lending market's tightening standards, decreasing consumer demand, and heavy supply of financing relative to prices, a slowdown of auto sales could be imminent.
Topic of the Week
Grading the Labor Market Ahead of Graduation
The strongest labor market in a decade bodes well for the Class of 2017, but young workers, including college grads, still face a challenging labor market relative to older workers.
College graduates have typically had more success in the labor market, hence the willingness of many collegegoers to take on debt in order to finance their education. For young college graduates, however, the right job is not always found quickly. Historically, the unemployment rate for college grads under the age of 25 has run closely in line with the headline unemployment rate. Yet over the past year, the unemployment rate for young college grads has been little changed (top chart).
Under-employment also remains more pervasive for young workers. In terms of hours, 20-24 year-olds are most likely to find themselves employed part time despite wanting full-time work (bottom chart). Others find themselves overqualified for the job they hold. According to New York Fed data, 43 percent of college grads ages 22-27 are in jobs that do not typically require a degree compared to 34 percent of all college grads.
At the same time, wage growth among young workers embarking on a career continues to lag, with growth in median weekly earnings for 20-24 year-olds lagging all other age groups since the recession.
The slow rate of earnings growth for young workers stands to exacerbate the student debt challenges faced by college-goers. However, there are indications that borrowers are having a slightly easier time coping. The share of federal loans currently in repayment—both in terms of dollars outstanding and number of recipients— has increased over the past year, while delinquency rates have edged lower. That may have more to do with the growth in income-based repayment plans, however, than the (slowly) improving labor market. Over the past year, the number of federal loan recipients on incomedriven plans has risen by 1.37 million while falling slightly for non-income based plans.
Week Ahead US Jobs and Fed to Guide Markets
Soft US growth to pressure Fed ahead of Jobs report
The US dollar is mixed against majors with gains against the NZD, JPY, CAD and AUD but weaker against the EUR and GBP. Risk appetite in Europe returned after the restful of the first round of elections in France left Macron and LePen heading into the May 7 deciding second round. The Trump administration presented its tax reform plan and launched a more aggressive trade offensive against NAFTA but anxiety around the dollar surged with the first release of the US GDP in the first quarter coming in below expectations at 0.7 percent.
US employment data will key alongside the May monetary policy meeting of the Fed. The ADP private payroll data will be published on Wednesday, May 3 at 8:15 am EDT. Job creation in the private sector has beat expectations since January, but the market has a conservative estimate of under 200,000. The Federal Open Market Committee (FOMC) will release the statement of the monetary policy meeting at 2:00 pm with no change expected to the rates. The meeting is not scheduled to have a press conference which will put more emphasis on the written statement as analysts and investors look for insights into the Fed's next steps.
The U.S. non farm payrolls (NFP) will be released on Friday, May 5 at 8:30 am EDT. Last month the jobs report was well below expectations with a gain of 98,000 when 170,000 were expected. US employment has been the strongest pillar in the recovery but it has hit some bumps of late. The U.S. Federal Reserve will look at the wage growth component for signs of inflation as they ponder the number of rate hikes this year. The unemployment rate is expected to head higher to 4.6 percent as more people look to rejoin the workforce.
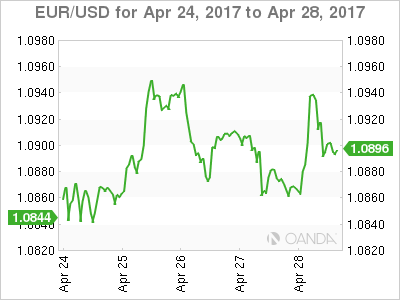
The EUR/USD gained 1.89 in the last five days. The single pair is trading at 1.0902 in a week that started with the results of the French election boosting the EUR and will end with soft economic indicators in the US putting downward pressure on the dollar. The European Central Bank (ECB) kept rates and the stimulus program unchanged, but it managed to make optimistic comments about the economy on Thursday. On Friday that belief was verified with inflation gains of 1.9 percent in the eurozone with the core component rising 1.2 percent and improvements to the Spanish GDP and Italian inflation.
The European commission will publish its Economic Forecast on Monday, May 1 at 5:00 am EDT. Purchasing manager indexes will be published in the Eurozone next week data with Germany and France drawing the most attention on Tuesday, May 2 starting at 3:15 am EDT. German unemployment will be the highlight of Wednesday's economic releases in the EU sharing the spotlight with the flash GDP for the Euro zone at 5:00 am EDT.
The economic calendar is packed in the United States. It starts on Monday, May 1 with US Treasury Secretary Steven Mnuchin giving a speech along with the release of the US purchasing managers index (PMI). Kicking off the jobs data will be the ADP payroll report on Wednesday, May 3. The U.S. non farm payrolls (NFP) will close the week on Friday, May 5. Doubts are growing about the state of the US economy after the weaker GDP number prompting investors to look even more closely at the most important indicator in the market.
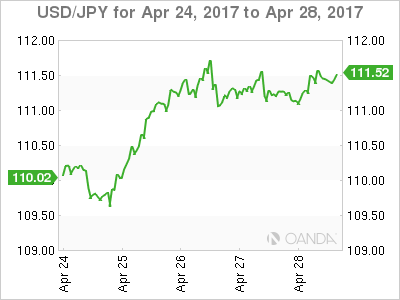
The USD/JPY gained 1.998 in the last five days. The pair is trading at 111.39 near weekly highs of 111.78. The Yen started depreciating after the results of the French election reduced the risk aversion that had made the currency a safe haven. The Trump administration in the US also presented the outline of the much-awaited tax reform plan which boosted the dollar. The Bank of Japan (BOJ) was active on Thursday but by keeping rates and the stimulus package unchanged sent a dovish signal to the market.
The economic calendar in Japan will be light as there are three bank holidays next week.
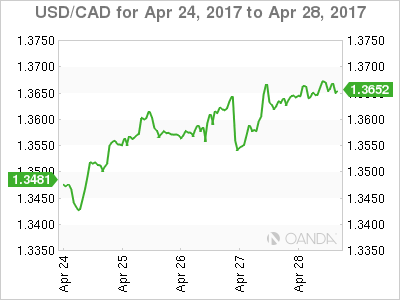
The USD/CAD gained 1.192 percent in the weekly trading session. The pair is trading at 1.3666 after the US dollar resurged after the positive results of the first round the French election. The Canadian dollar touched daily and weekly lows after the Trump administration retracted on comments it was working on an executive order to pull out of NAFTA. Trump said that after talking to the president and prime minister of Mexico and Canada he decided to give the renegotiation route a shot.
US employment data will dominate the economic calendar during the week but there are important Canadian indicators on the agenda. The trade balance will be published on Thursday, May 4 and Canadian employment data will share the day and time of release with the U.S. non farm payrolls (NFP) on Friday, May 5 at 8:30 am. After the impressive 19,400 jobs added last month the forecast calls for a 20,000 gain keeping the unemployment rate unchanged at 6.7 percent. The Canadian purchasing managers index will be released later the same day at 10:00 am with a slight improvement to 62.3 anticipated after a 61.1 figure last month. A reading above 50 in the survey implies expansion of Canadian purchasing orders.
Market events to watch this week:
Monday, May 1
- 7:45am USD Treasury Sec Mnuchin Speaks
- 10:00am USD ISM Manufacturing PMI
- 9:45pm CNY Caixin Manufacturing PMI
Tuesday, May 2
- 12:30am AUD Cash Rate
- AUD RBA Rate Statement
- 4:30am GBP Manufacturing PMI
- 6:45pm NZD Employment Change q/q
Wednesday, May 3
- 4:30am GBP Construction PMI
- 8:15am USD ADP Non-Farm Employment Change
- 10:00am USD ISM Non-Manufacturing PMI
- 10:30am USD Crude Oil Inventories
- 2:00pm USD FOMC Statement
- USD Federal Funds Rate
- 9:30pm AUD Trade Balance
- 11:10pm AUD RBA Gov Lowe Speaks
Thursday, May 4
- 4:30am GBP Services PMI
- 8:30am CAD Trade Balance
- USD Unemployment Claims
- 4:25pm CAD BOC Gov Poloz Speaks
- 9:30pm AUD RBA Monetary Policy Statement
- 11:00pm NZD Inflation Expectations q/q
Friday. May 5
- 8:30am CAD Employment Change
- 8:30am USD Average Hourly Earnings m/m
- 8:30am USD Non-Farm Employment Change
*All times EDT
FOMC, RBA, & Norges Bank Rate Decisions, US Jobs Report, Key Data in Focus
Next week's market movers
- In the US, the FOMC is forecast to stand pat. We expect policymakers to maintain a balanced tone, with risks skewed towards a more cautious narrative than previously.
- The RBA is anticipated to remain on hold as well. Considering the improvement in economic data since the last meeting, the accompanying statement could be more upbeat.
- In Norway, the Norges Bank policy decision will be in focus. We think that this Bank will take no action either, despite slowing inflation.
- As for the US data, the employment report for April could prove critical to market expectations regarding the timing of the next Fed rate hike.
- We also get key economic indicators from the US, the UK, New Zealand and Canada.
On Monday, we get loads of US data. Let's kick off with personal income and spending for March. Personal income is expected to have slowed, while personal spending is forecast to have accelerated. The income forecast is supported by a slowdown in average hourly earnings, while we see the risks surrounding the spending forecast as skewed to the downside. We base our view on the fact that retail sales slid during the month.
We also get the core PCE price index for the month, though no forecast is available for the yoy rate yet. However, the mom rate is expected to have turned negative, at -0.1% mom, which based on our calculations, could bring the yearly rate down to +1.6% yoy from +1.8% yoy. Coming on top of the disappointing CPI data for the month, a slowdown in the Fed's favorite inflation measure could amplify the case for a cautious Fed on Wednesday (see below).
Finally, we get the ISM manufacturing PMI for April, and then on Wednesday, the non-manufacturing index for the month. Expectations are mixed, with the manufacturing figure forecast to have declined and the non-manufacturing index to have risen. Despite a potential pullback in the manufacturing index, given that both of these indices are expected to have remained at healthy levels, they could be a first sign that the US economy entered the second quarter on a decent footing, and that the softness in economic growth during the first quarter may have been only transitory.
Elsewhere, markets will remain closed in the UK, Germany, France, Switzerland, Sweden, Norway, and China, in celebration of Labor Day.
On Tuesday, during the Asian morning, the RBA will announce its rate decision. When they last met, policymakers highlighted the softness in labor market indicators, and that the recently announced supervisory measures with regards to lending could ease financial stability risks. Back then, this led us to understand that once these measures take effect, officials would be more flexible to cut rates again if needed. Nevertheless, we don't expect them to take any action at this gathering. The latest jobs report showed a strong recovery in March, while the nation's inflation data for Q1 showed that the headline CPI rate returned back within the RBA's inflation target range of 2-3%. The trimmed mean rate rose notably as well, to just a tick below the lower band of the target range. Having these in mind, we think that the statement accompanying the decision may be relatively more upbeat than previously.
From the UK, we get the manufacturing PMI for April. On Wednesday, we get the construction PMI for the month and then on Thursday, we get the services index. All of these figures are forecast to have declined somewhat. Given that the 1st estimate of Q1 GDP showed a notable slowdown, the market may pay extra attention to these indices to see how the economy entered Q2. Was this weakness temporary or not?
As for the BoE, we don't expect any shift in language anytime soon. The Q1 slowdown is in line with the Bank's current stance to overlook above-target inflation and keep interest rates unchanged in order to support growth. Even if the PMIs foreshadow a rebound in economic activity in the beginning of Q2, we don't expect them to change market perception with regards to BoE policy. We believe that investors want to see much more data supporting an economic recovery, and the election uncertainty to start dissipating, before they start pricing in a decent probability of a rate increase.
On Wednesday, all eyes will be turned to the FOMC rate decision. The forecast is for the Committee to keep borrowing costs unchanged, following a 25bps rate hike at the latest meeting in March. The case for no action this time is also supported by market pricing, which indicates less than 5% probability for a hike. Bearing also in mind that this meeting does not include updated economic forecasts or a press conference by Chair Yellen, market action will most likely come from the phrasing of the statement accompanying the decision.
The latest comments from Chair Yellen and the rest of the officials suggest that they remain on track to raise rates gradually, perhaps even another two times this year in line with the "dot plot". However, these were before the latest slowdown in the nation's headline and core CPIs for March. From a growth perspective, economic activity slowed notably in Q1, but the Committee may look-through some of this softness as being transitory, something already mentioned in the March meeting minutes. On the bright side, the labor market appears quite robust overall, with the unemployment rate currently at 4.5%, in line with the Fed's target of full employment. Bearing these mixed data in mind, we expect the Committee to maintain a more or less balanced tone, with the risks tilted towards a slightly more cautious narrative than previously. Policymakers may prefer to wait for a rebound in the economic data, and even some clarity surrounding the future path of fiscal policy, before clearly communicating that further near-term normalization is on the cards.
As for the US data, we get the ADP employment report for April. The private sector is expected to have added 190k jobs during the month, less than the 263k in March, but still a solid number that could raise speculation for the NFP print to also meet, or even exceed, its forecast of 178k.
We also get the nation's ISM non-manufacturing PMI for April, as we already outlined above.
From New Zealand, we get the employment report for Q1 and the forecast is for the unemployment rate to have remained unchanged. We think that the risks surrounding that forecast may be skewed to the downside, if one looks at the ANZ job ads figure. Already at a high level, job ads rose further throughout the quarter, which suggests that the labor market likely continued to tighten in Q1.
On Thursday, the Norges Bank rate decision will be in the spotlight. In the absence of a forecast, we see the case for the Bank to remain on hold once again. Policymakers shifted to a slightly more dovish tone when they last met in March, indicating that there are prospects that inflation will be lower than previously expected. Since then, data showed that both the headline and the core CPI rates have indeed declined further. Having said that, we do not expect the Bank to ease policy for two key reasons: the unemployment rate is already very low, and any further rate cuts would likely boost house prices in Norway even more, thereby amplifying financial stability risks. The latter factor is something that officials have been paying close attention to for a while now, and we think it is likely to deter them from pulling the easing trigger. We expect the tone of the accompanying statement to remain as is, with the risks being skewed towards a more downbeat assessment.
On Friday, the main event will the US employment report for April. The forecast is for nonfarm payrolls to have risen by 178k, more than the somewhat disappointing 98k in March, and a strong number that is consistent with further tightening in the labor market. The unemployment rate is forecast to have ticked up, while average hourly earnings are expected to have accelerated slightly in monthly terms. Despite a potential uptick in the unemployment rate, this looks like another solid report overall that could bring forth market expectations regarding the timing of the next rate hike. Currently, the next hike is fully priced in for September according to the Fed funds futures. Solid jobs data could bring that forward, perhaps towards the summer meetings. However, as we outlined above, we would first like to see a rebound in critical economic data like the CPIs and GDP, before we assume that the Committee will implement further hikes in the near term.
We also get Canada's employment data for April.
Fade The Trade Escalation Hype
- Fade The Trade Escalation Hype - Peter Rosenstreich
- US Budget Deficit Back Under The Spotlight - Arnaud Masset
- ECB Relieved After First Phase Of French Election - Yann Quelenn
Economics - Fade The Trade Escalation Hype
We have seen President Trump fire up the extreme populist platform of protectionism in an attempt, in our view, to score some quick points as his first 100 days milestone approaches. First Trump slapped Canada with up to a 20% tariff on lumber imports, then he forced Canada and Mexico to agree to renegotiate NAFTA. He closed the week threatening to "terminate" Korus, the US - S.Korea trade deal (potentially a tactic to get S. Korea to pay for THAAD). Traders were quick to sell the underlying currencies CAD, MXN and KRW on the escalations in trade tensions. However, as with much of Trump's actions, we suspect that recent moves will be short-lived as real underlying policy initiatives are unlikely.
In the case of Mexico, events in Venezuela should provide a stark warning to the potential effect of destabilizing measures. The Trump administration is unlikely to push Mexico too hard, opting to have a safe, friendly cushion between the US and South America. MXN has had a difficult time with weaker oil & copper prices and rumours that President Trump has ordered a draft letter to leave NAFTA. The news injected some volatility into MXN as the currency came under significant selling pressure against the USD. Yet, Trump's sudden reversal from withdrawing from NAFTA to renegotiation should be MXN positive. From a fundamental standpoint 1Q annual GDP rose 2.7% above prior read of 2.4% (2.5% exp) indicating steady expansion. While Banxico hiking cycle come to an end as inflation and exchange rate collapse has been managed.
The partial unwinding of the extreme risks of protectionism will lower concerns that Emerging Markets currencies are heading towards a correction. The MSCI Emerging Market Currency Index is trading just below its two-year high.
From a macro perspective, the affirmations that the ECB and BoJ will maintain their accommodating policy for the foreseeable future indicates that risk-taking and yields-seeking behaviour should resume.
Given our current view on global conditions, we anticipate MXN will recover lost ground. We anticipate that USDMXN, despite is slightly oversold positioning, will retest 18.50 lows.
Economics - US Budget Deficit Back Under The Spotlight
Last week, financial markets continued to digest the result of the first round of the French election but the focus is slowly shifting towards the US as President Trump made some announcement about his "phenomenal" tax reform and also put his protectionist trade policy back to the drawing board. Indeed, the market is slowly shifting focus from the French election and I currently pricing a Macron victory at the second round, which helped to restore market's confidence and gave a boost to European equities and the EUR.
During the previous week, the dollar index was mostly trading sideways, suggesting that the market is very suspicious regarding Trump's announcement. In fact, it seems that it is not even buying his stories anymore and would rather wait for concrete actions.
We are very suspicious that Trump's tax cut reform will pass through Congress as it will make the US deficit balloon. In addition, the timing couldn't be worse as the US budget deficit has become the new hot topic recently as the US government is running out of money, meaning a government shutdown is looming. There is little chance that the Trump administration will get Congress to sign its tax cut reform, while at the same time getting it to sign off another spending bill. Trump is indeed in a deadlock, without passing a reform aiming at balancing the drop in tax receipts, it seems complicated to pass the tax cut bill.
In such an environment, we should continue to see some inflow in the single currency. The shift towards riskier assets should continue, even though the market is converging towards a new port-French-first-roundelection equilibrium for now. Against this backdrop, we would rather avoid taking long USD positons, except against the JPY, waiting for further clarity on the US outlook and more specifically the US budget story and the tax cut plan.
Politics & Economics - ECB Relieved After First Phase Of French Election
Financial markets feared a second round between Jean-Luc Mélenchon and Marine Le Pen who was likely to trigger some volatility. Marine Le Pen's final result below 22% is disappointing as she was expected in various polls to reach between 27% and 30%.
The failure of Le Pen or Mélenchon to sway undecided voters or unlock closely-guarded voting behaviours will come as a major relief to investors fearing uncertainty over whether the second round would bring a new set of complexities. At present, extreme volatility has been avoided. Emmanuel Macron and Le Pen will move forward to the second round run-off on May 7.
The result is very market-friendly. The failure of Marine Le Pen or Jean-Luc Mélenchon to surge on voting day should be viewed as a vote for the EU. Eventually, Emmanuel Macron is now very likely to become the new French president. Most of the runner-up such as François Fillon who scored around 19%, are calling for a Macron vote for the final vote in two weeks. Even Mélenchon, which program was very similar to Marine Le Pen's has been calling, through his lieutenants, to vote for Emmanuel Macron.
There had not been a massive relief, if any, in financial markets. However the single currency appreciated slightly against the swiss franc. There's nonetheless no fear for the second round. Final results estimates are calling for a 60% Macron's victory. European Union seems to win a battle and attention should carefully shift towards the German's election in August.
We anticipated no extreme volatility in the FX market, with marginal Euro buying (as markets had positioned for this outcome) as exit polls become official results. We remain long EURCHF on a rejection of an anti-EU vote.
Draghi showed optimism on Eurozone economy
Last Thursday, European Central Bank meeting was in the middle of the French Presidential election and the European institution certainly welcomed Emmanuel Macron's victory in the first round as there were certainly fears of a second round pitting Jean-Luc Mélenchon against Marine Le Pen.
This meeting was very useful to the extent that Mario Draghi was optimistic in regards to a future tightening even though the current level of asset purchases (€60 billion) will continue until year-end. We believe that for some more time, the ECB will remain committed to low rates. Markets are likely to price in better confidence and we remain bullish on the Euro in the short-term. In Europe, economic fundamentals are better, inflation is picking up and unemployment has decreased, even though it remains very high in peripheral countries. Financial markets are clearly not pricing anything else but a Macron victory in France, which seems to rule out any political risks for the ECB.