
Sample Category Title
Another Sluggish GDP Growth Print to Start the Year
Reflecting, in part, significantly slower consumer spending growth and a sizeable inventory drag, U.S. real GDP growth increased at a sub-par annual rate of just 0.7 percent in Q1. A strong Q2 rebound is still expected.
Following Trend, Q1 Produces a Soft Growth Print
Hampered by perennial residential seasonality issues and one-off items, which have materially factored into the calculation, the first quarter of each year in this expansion cycle has more times than not resulted in a lowerthan- trend GDP growth performance. That turns out to be the case this year as U.S. real GDP increased at a modest 0.7 percent annualized rate in Q1, down from the 2.1 percent gain registered in Q4 2016.
Weakness was primarily centered on a much slower pace of consumer spending. After registering a strong 3.5 percent gain in Q4, real consumer spending advanced just 0.3 percent in Q1, the weakest annualized pace of growth since Q4-2009. This quarter's one-off factor turned out to be milder-than-usual winter weather that blanketed much of the country during the first two months of the year. As a result, consumers did not spend as much on utility services, reflected in the modest 0.4 percent rise in Q1 services spending-which had averaged 2.7 percent growth over the past three quarters. Moreover, consumers did not take that extra savings and spend it elsewhere as goods spending was essentially unchanged on the quarter. Instead, they have banked it as the saving rate has risen from 5.2 percent in December to 5.6 percent as of February. Also a headwind to overall growth, inventories gave back all of its Q4 contribution, slicing a full percentage point off the top line.
On the positive front, business fixed investment (BFI) posted a strong quarterly performance, up 9.4 percent. Within BFI, business equipment investment increased at a 9.1 percent annual pace, while intellectual property products rose 2.0 percent and structures investment surged 22.1 percent. Core capital goods shipments and orders have been on an improving track, and with business leaders still optimistic that a deal can get done on the tax policy front, the outlook for business investment remains constructive. Residential construction, which was also impacted by the weather, increased at its strongest quarterly pace since Q4 2015 at 13.7 percent. While some activity was clearly pulled forward, the outlook for residential construction remains constructive as long as the labor market, including wage & salary growth, continues to show improvement.
Trend Also Points to a Strong Second Quarter Rebound
With the Q1 growth performance unfolding largely as expected, we remain confident with our rebound call for Q2. Since 2000, Q1 U.S. GDP has averaged 1.0 percent, followed by an average growth print of 2.6 percent in Q2. Business/consumer sentiment continues to suggest the weakness in Q1 was not the start of a new trend. On early signs of strengthening consumer spending, resilient BFI and residential construction activity, and incorporating a modest drag from trade, conditions continue to suggest U.S. GDP will rebound solidly in Q2-our current call stands at 2.9 percent.
Currencies: Dollar Rises on Higher Inflation Despite Poor Growth
Headlines
European equity markets traded in a narrow range today, losing slightly ground. US equity markets opened nearly unchanged with Nasdaq outperforming (+0.3%).
EMU inflation rebounded in April, with the annual rate climbing to 1.9% after taking a surprisingly large tumble in the previous month. Encouragingly for policymakers, a core measure of inflation which strips out changes for oil and food prices also shot up, rising from 0.7% in March to 1.2%. That is its highest reading since 2013.
The US economy's output grew at the slowest pace in three years during the first quarter, underscoring the challenges facing the Trump administration as it seeks to rev up economic growth. Growth slackened to 0.7% Q/Q annualised from 2.1% in Q4 2016 and below 1% consensus. Price indicators surprised on the upside though.
The Chicago PMI rose from 57.7 to 58.3 in April, the highest level since early 2015, while consensus predicted a decline to 56.2.
The UK economy slowed sharply in the first quarter as consumers pared back spending, a warning sign on growth ahead of a national election in June and the start of Britain's exit talks with the EU. Q1 GDP printed at 0.3% Q/Q, down from 0.7% Q/Q in Q4 2016 and below 0.4% Q/Q expectations.
Russia's central bank cut its key interest rate by 0.5% to 9.25% on Friday, citing the country's continued emergence from a two-year recession. The bank said inflation, currently at 4.3%, remained on track to hit its longstanding target of 4% by year's end, allowing for further gradual cuts in rates over the course of the year.
US President Trump said a "major, major conflict" with North Korea was possible over its nuclear and ballistic missile programmes, while China said the situation on the Korean peninsula could escalate or slip out of control.
Major dealers have backed the broader use of a BoE interest rate benchmark as an alternative to Libor, a rate that was tarnished by a rigging scandal. Support for SONIA, the sterling overnight index average, as its preferred "near risk-free" interest rate benchmark in sterling derivatives and other financial contracts, will improve the resilience of the financial system, the BoE said.
Rates
Core inflation conflicts with Draghi's message
Global core bonds lost some ground today. Two events clearly coloured trading. First, EMU inflation printed higher than expected at 1.9% Y/Y in April. Core inflation surged from 0.7% Y/Y to 1.2% Y/Y, above 1% Y/Y consensus and the highest reading since 2013. The higher inflation contradicted with Draghi's soft message at yesterday's ECB press conference. The ECB president did his utmost best not to trigger speculation on a nearby process of policy normalisation by the central bank. Subdued core inflation was one of his strongest arguments to defend the ECB's very accommodative policy. The Bund lost ground after the inflation readings, underperforming US Treasuries. The second defining moment for today's trading session was the US Q1 GDP release. Growth slowed more than expected to only 0.7% Q/Q annualised. US Treasuries nevertheless declined, this time underperforming Bunds, because price indices rose to 2% or even higher, suggesting that the Fed could easily continue its gradual tightening cycle in June. Trump's hostile talk on North Korea and the (European) long weekend ahead hampered investors from putting up more short positions.
At the time of writing, changes on the US yield curve range between +2 bps (2- yr) and +2.6 bps (5-yr). The German yield curve bear steepens with yields 2.5 bps (2-yr) to 4.9 bps (30-yr) higher. On intra-EMU bond markets, 10-yr yield spreads versus Germany narrow up to 3 bps with Greece outperforming (-6 bps) and Portugal underperforming (+4 bps).
Currencies
Dollar rises on higher inflation despite poor growth
Trading in the major FX cross rates was driven by conflicting signals today. The euro jumped higher this morning on a unexpected sharp rise in EMU inflation. EUR/USD came within reach of this week's top. In the afternoon, the dollar rebounded. US Q1 GDP was disappointing, but the price components were higher than expected, supporting US yields and the dollar. EUR/USD trades currently in the 1.09 area. USD/JPY changes hands in the 111.60 area, within reach of this week's top (111.78).
Overnight, Asian equities ceded modest ground. Geopolitical tensions (North Korea) and end of month profit taking were probably to blame. Japanese eco data confirmed a further gradual recovery, but CPI data remained soft. The yen traded little changed. USD/JPY held a tight range in the low 111 area. EUR/USD maintained yesterday's post-ECB decline and traded around 1.0865.
Early in Europe, European yields and the euro rose slightly but the moves were very modest. However, the preliminary release of the EMU CPI didn't pass unnoticed. Headline and core inflation declined more than expected in March and ECB's Draghi yesterday mentioned low core inflation as an important factor to keep ECB policy ultra-easy. However, the April inflation data painted quite a different picture. EMU headline inflation jumped from 1.5% Y/Y to 1.9% Y/Y (consensus 1.8% Y/Y). The rise in core inflation was even bigger as it rose from 0.7% Y/Y to 1.2% Y/Y (consensus at 1.0% Y/Y). Yesterday, European yields and the euro declined after the soft Draghi comments. So, there was some room for a countermove and that is exactly what happened. European yields and the euro jumped higher. EUR/USD came within reach of the recent highs in the 1.0950 area but no break occurred.
The advance reading of US Q1 GDP showed very mediocre growth at 0.7% Q/Qa. (a decline from 2.1% to 1.0% Q/Qa was expected). However, the price data of the report were higher than expected. Some kind of stagflation can hardly be considered good news. However, markets apparently assume that rising prices will keep the Fed on its rate hike trajectory. EUR/USD declined modestly and trades near 1.09. USD/JPY trades around 111.60 area, nearing the week top (111.78).
Sterling ignores a series of soft UK data
UK eco data came out weaker than expected today. UK Q1 GDP growth slowed to 0.3% Q/Q and 2.1% Y/Y from 0.7% Q/Q in Q4 2016. The consensus expected 0.4% Q/Q. The ONS indicated that the decline was mostly driven by a slowdown in the services sector. Especially sectors that are sensitive to the declining purchasing power due to price rises were to blame. The Nationwide house prices and the number of loans for home purchases were also softer than expected. Remarkably, the soft/weak UK data hardly impacted sterling. Cable was well bid going into the publication of Q1 GDP. The pair stabilized in the mid 1.29 area after the Q1 GDP release. The pair trades currently in the 1.29 area, but that is due to USD strength after the US GDP data. EUR/GBP was also moved by non-UK issues. The pair jumped from the 0.8415 area to the 0.8450 data after the higher than expected EMU CPI. The pair trades still near that level at the moment of writing. The EUR/USD decline after the US data barely impacted EUR/GBP trading.
Elliott Wave Analysis: GOLD Intraday View
On the intraday chart of GOLD, we are observing a complex correction in the making with current slow price activity being sub-wave B) as part of a correction. That said current slow price development suggests a triangle in the making within wave B), that may after its completion point towards more weakness in the following wave C). Support for the whole correction may later be around the 38.2 Fibonacci ratio or even lower around the previous swing low at 1246 level.
GOLD, 1H
Weekly Focus: Global Growth Losing Steam
Market movers ahead
- The market will monitor incoming opinion polls ahead of the second round of the French Presidential election.
- The FOMC is set to meet on Wednesday. We do not expect major changes in monetary policy or the statement.
- We expect the US labour market report to show employment gains of 170,000 in April.
- We look for small declines in April's Chinese manufacturing PMI and the US ISM manufacturing indices due for publication next week.
- FX reserve data is due in Denmark and Norges Bank is set to meet next week. We do not expect major changes in either announcement though.
Global macro and market themes
- Markets are less worried about France, as Emmanuel Macron is the clear favourite against Marine Le Pen.
- Do not get overexcited about Trumponomics.
- With markets less worried about political uncertainty in Europe, focus may soon return to economics.
- We do not expect much action at next week's Fed meeting.
- The rising risk from North Korea is a joker.
Focus
- Tensions are rising fast between the US and North Korea and are likely to escalate further if North Korea continues with plans to carry out a nuclear test
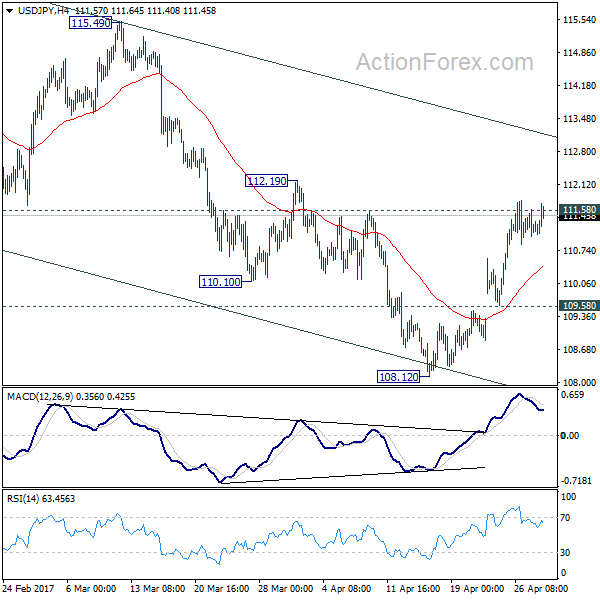
USD/JPY Mid-Day Outlook
Daily Pivots: (S1) 110.68; (P) 111.23; (R1) 111.60; More....
As long as 109.58 minor support intact, further rise is still expected in USD/JPY. Sustained trading above 111.58 support turned resistance will indicate that fall from 118.65 is merely a corrective move and has completed. Outlook will then be turned bullish for 115.49 resistance and above. However, break of 109.58 will argue that fall from 118.65 is still in progress and will turn bias to the downside for 108.12 and below.
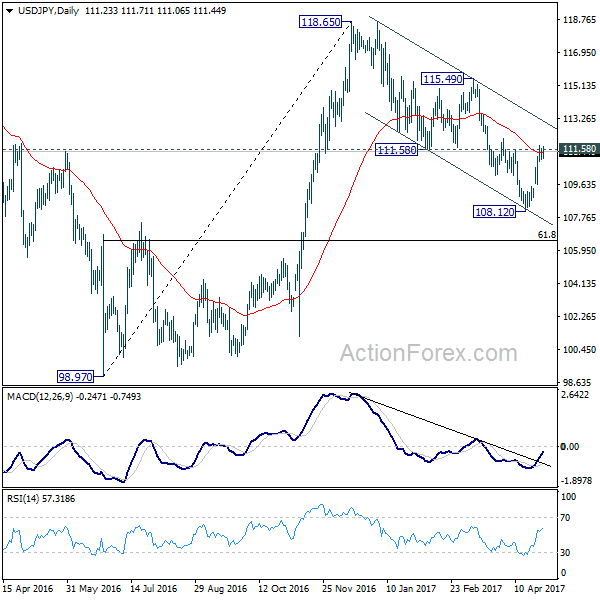
In the bigger picture, price actions from 125.85 high are seen as a corrective pattern. Current development suggests that it's not completed yet and is extending. In case of deeper decline, downside should be contained by 61.8% retracement of 75.56 to 125.85 at 94.77 to bring rebound. Rise from 75.56 is still expected to resume later after the correction from 125.85 completes.
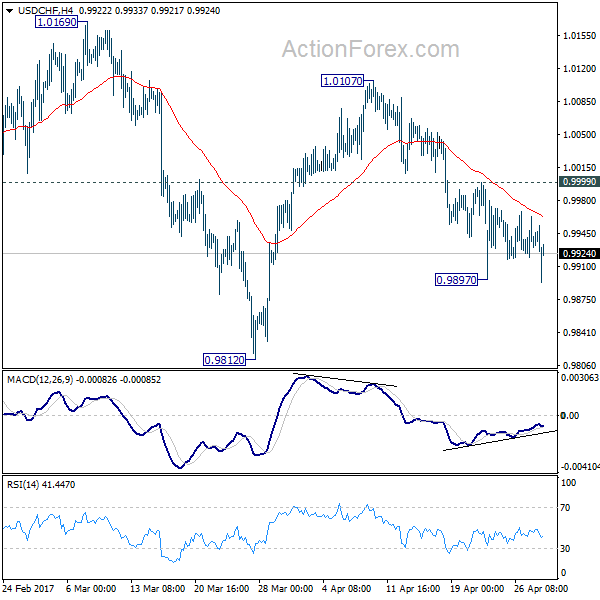
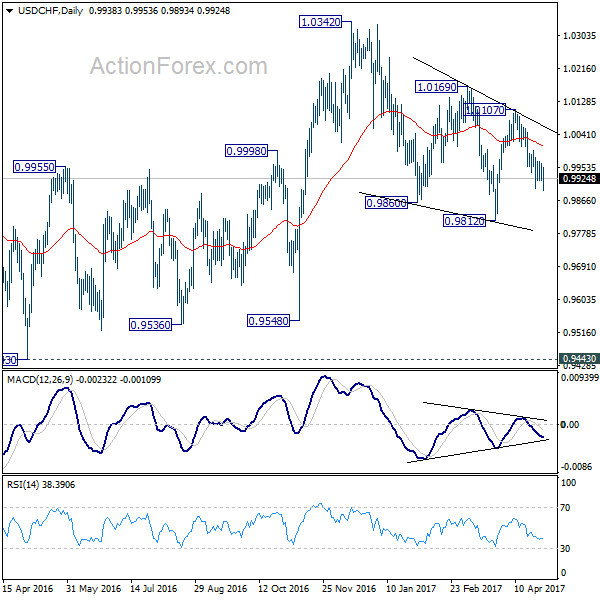
USD/CHF Mid-Day Outlook
Daily Pivots: (S1) 0.9919; (P) 0.9941; (R1) 0.9963; More.....
Intraday bias in USD/CHF remains neutral as consolidation form 0.9897 is still in progress. At this point, with 0.9999 minor resistance intact, deeper fall is still in favor. Below 0.9897 temporary low will turn bias to the downside for 0.9812 and possibly below. Nonetheless, whole decline from 1.0342 is seen as a correction. Hence, we'll look for bottoming signal below 0.9812. Meanwhile, on the upside, above 0.9999 minor resistance will turn bias back to the upside for 1.0107 resistance.
In the bigger picture, we're still maintaining that firm break of 1.0342 key resistance is needed to confirm underlying bullish momentum in the cross. However, the corrective nature of the fall from 1.0342 is starting to give the medium term outlook a bullish favor. Hence, in stead of looking for topping signal around 1.0342, we'd now pay closer attention to upside acceleration as USD/CHF approaches this level again.
EUR/USD Mid-Day Outlook
Daily Pivots: (S1) 1.0837; (P) 1.0885 (R1) 1.0918; More....
Intraday bias in EUR/USD remains neutral for the moment. At this point, another rise could be seen as long as 1.0777 support holds. But still, rise form 1.0339 is seen as a corrective move. Hence we'd pay attention to topping signal even if EUR/USD rises through 1.0949. On the downside, below 1.0777 minor support will turn bias to the downside for 1.0569 support first.
In the bigger picture, as long as 1.1298 key resistance holds, whole down trend from 1.6039 (2008 high) is still expected to continue. Break of 1.0339 low will send EUR/USD through parity to 61.8% projection of 1.3993 to 1.0461 from 1.1298 at 0.9115. However, considering bullish convergence condition in weekly MACD, break of 1.1298 will indicate term reversal. this would also be supported by sustained trading above 55 week EMA.


US GDP Growth Dipped Below 1% in Q1 But Don’t Expect the Slowdown to Last
Highlights:
- US GDP growth slowed to a 0.7% annualized pace in Q1 from 2.1% in the prior quarter.
- The increase fell slightly short of market expectations for a 1% gain.
- Consumer spending growth dipped to 0.3% following three consecutive quarterly gains of 3% or more.
- Slower inventory investment subtracted nearly a percentage point from headline growth.
- Government spending unexpectedly fell for the second time in the last year.
- Business investment rose nearly 10%, the best gain in three years.
Our Take:
While today's GDP report confirms a slow start to the year, we are far from ready to throw in the towel on our forecast for growth to pick up in 2017. In fact, the underlying details generally support our outlook for a more broadly-based increase in domestic spending to underpin above-trend activity this year. Much of the moderation in Q1 growth reflects a substantial slowdown in consumer spending that looks unlikely to persist given a myriad of factors supporting households (including wage growth and rising confidence), not to mention the transitory nature of the dip in Q1 utilities spending. Aside from that, accelerating business investment and another strong add from housing made for the best gain in private fixed investment since 2012. Given improving business sentiment and less drag from the energy sector, we think the pickup in Q1 capital spending can be sustained (though perhaps not at Q1's impressive pace). An expected return to solid growth in consumer spending would then allow for domestic demand to increase at a 2½% clip over the remainder of the year.
We doubt the Fed will have a much different take at next week's policy meetings. Earlier comments indicated the Committee views slower Q1 growth as largely reflecting transitory factors, so today's reading shouldn't do too much to dampen their otherwise positive economic outlook. We look for rates to be on hold in May but think a June hike is likely if the rebound in growth plays out as expected.
Canadian GDP Unchanged in February Following a 0.6% Jump in January
Highlights:
- Canadian GDP was unchanged in the month following the outsized 0.6% spike in January. The earlier strength points to Q1 GDP rising an annualized 3.8% despite the February pause.
- Goods-producing industries fell 0.3% reflecting relatively broad-based declines.
- Within goods-producing industries manufacturing output dropped 0.6% while mining and utilities both declined 0.2%. Some offset was provided by construction output rising 0.5% reflecting gains in both residential and engineering building activity.
- Service-producing industries rose 0.2% helped by strong housing activity sending the real estate component up 0.5% with finance and insurance also up a solid 0.7%. The main offsets were declines in wholesale trade (0.4%) and transportation and warehousing (0.3%).
Our Take:
February's flat monthly reading belied an acceleration in the annual pace of growth with real GDP output up 2.49% compared to a year earlier. This was the fastest pace of increase since July 2014 and reflects the recovery in the goods-producing sector. Mining production was up 6.4% in line with the recovery in commodity prices, which represents a marked turnaround after two years of decline. Growth in service-producing industries was steadier over the last two years though accelerated slightly in February. This broad based strengthening pumped the annual growth in overall GDP higher in February relative to January's 2.29% pace. This report confirmed that the economy continued to grow faster than the Bank of Canada's current estimate of potential of 1.3% for the past six months. Sustained above potential growth provides a strong argument for the central bank to start to withdraw some of the current stimulus in the system. However, recent comments by the Bank of Canada, though acknowledging the recent strength in growth, showed little indication to immediately start to tighten policy. A key restraining factor is concern about potential trade impediments being introduced by the U.S. government dampening both exports and business investment. The Trump Administration's imposition of tariffs on lumber exports announced earlier this week provide reason for the Bank of Canada to remain wary of this risk.
CAC Flat as French Data Disappoints, Eurozone CPI Climbs
The CAC has ticked higher in the Friday session. Currently, the index is trading at 5,280.50. On the release front, French indicators were a mixed bag. GDP for the first quarter came in at 0.3%, close to the estimate of 0.4%. Consumer Spending disappointed with a decline of 0.4% compared to an estimate of a 0.6% gain. Preliminary CPI came in at 0.1.%, shy of the forecast of 0.2%. There was better news out of the eurozone, as Eurozone CPI Flash Estimate improved to 1.9%, edging above the estimate of 1.8%. Later in the day, the US will release Advance GDP for Q1, with a forecast of 1.3%.
Inflation in the eurozone is again on the rise. The estimate for CPI in April improved 1.9% in April, up from 1.5% in March. Although inflation levels have moved higher, Mario Draghi stated on Thursday that the ECB was not changing its inflation forecast or making any changes to its asset-purchase program. The ECB held rates at a flat 0.00%, and the rate statement and comments from Mario Draghi were more dovish than the markets would have liked. The current ultra-loose policy, which includes a quantitative easing program of EUR 60 billion/mth, has been in place since 2008. Draghi acknowledged that the eurozone is in better shape, noting that economic conditions had improved and downside risks had decreased. There had been speculation that the ECB might taper or bring forward its asset-purchase program, which runs until December. The ECB holds its next meeting in June, and the markets will again be looking for some tightening from the ECB.
French voters will again have their say on May 7, when the winner of the presidential election will be decided. The two candidates left standing after the first round of voting are centrist Emmanuel Macron and National Front leader Marie Le Pen. European stock markets have been steady over the past few days, having priced in a victory by Macron. Opinions polls ahead of the first round were on target, forecasting that Macron and Le Pen would advance to the second round, with 24% and 22% of the vote, respectively. The markets are thus relying on the polls for the second round, which show Macron with a comfortable lead of 60-40. Le Pen is a heavy underdog, compounded by the fact that some candidates from the first round, as well as former President Francois Hollande, have publicly called for voters to support Macron. Still, a strong showing by Le Pen next Sunday would show that her strident anti-EU stance has wide popularity, and this could sour investor sentiment and send European stock markets lower.
One of President Trump's most important campaign platforms was a promise to reform the US tax code. Trump finally announced his long-awaited tax plan on Wednesday. The proposal calls for sharp reductions for both individuals and corporations. The plan calls for three tax brackets for individuals – 10%, 25% and 35%. The corporate sector would also see significant tax relief, with the corporate tax rate dropping from 35% to 15%, and the tax on multinationals' overseas profits lowered from 35% to 10%. However, any tax reform proposals from the White House will require a stamp of approval from Congress, so Trump's proposal should be viewed as a blueprint that is a long way off from becoming law. Trump's proposal was short on details, although government officials are praising it as one of the largest tax cuts and broadest overhauls of the tax system in history. There hasn't been much reaction from the CAC or other European stock markets, which have been subdued in Thursday trading.