Sample Category Title
EUR/CHF Daily Outlook
Daily Pivots: (S1) 1.0807; (P) 1.0826; (R1) 1.0853; More...
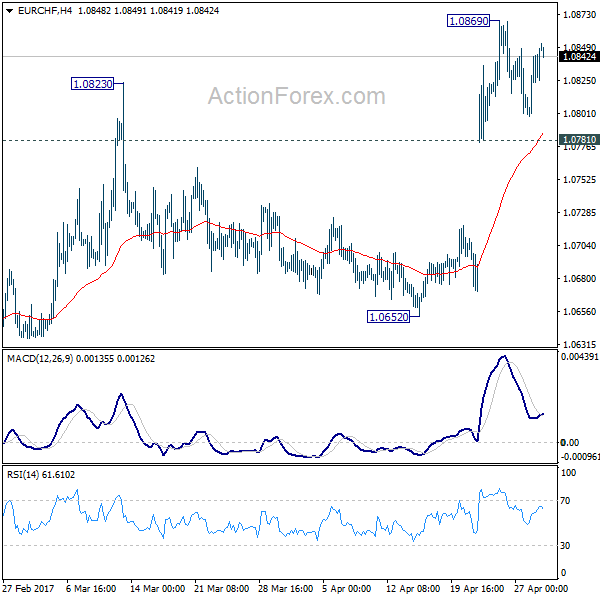
Intraday bias in EUR/CHF remains neutral for consolidation below 1.0869 temporary top. Downside of retreat should be contained by 1.0781 support and bring another rally. Above 1.0869 will target 1.0897 resistance next. Decisive break there should confirm our bullish view of reversal. However, break of 1.0781 will bring deeper fall back towards 1.0652 support instead.
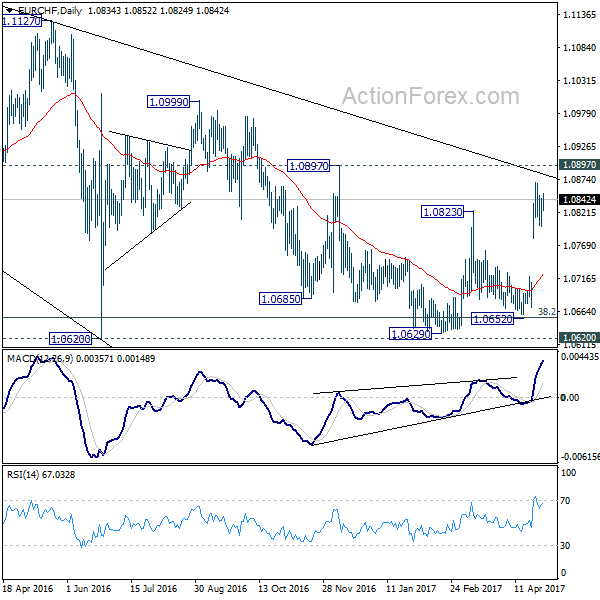
In the bigger picture, the price actions from 1.1198 are seen as a corrective move. Current strong rebound is raising the chance that it's completed after defending 38.2% retracement of 0.9771 to 1.1198 at 1.0653. Decisive break of 1.0999 resistance will target a test on 1.1198 high. For now, this will be the preferred case as long as 1.0652 support holds.
On Friday, Euro Area HICP Inflation Rose More Than Expected To 1.9% Y/Y In April From 1.5% Y/Y In...
Market movers today
It is a very quiet day in terms of major economic data releases.
In the US today, PCE inflation data for March is due out. However, these numbers will probably not at t ract very much at tent ion, as we received PCE inflation figures for Q1 on Friday, from which we can implicit ly calculate the monthly numbers for March.
More interestingly in the US, ISM manufacturing figures for April and final PMI manufacturing figures for Apri l are due out. Over the past few months, we have seen a divergence between ISM, PMI and regional manufacturing indices. The preliminary PMI figures for April fell back slightly but the regional indices continued climbing higher. We estimate ISM fell further in April. Our models continue to point towards a deceleration of economic growth and, therefore, we put less weight on the regional manufacturing indices.
Later this week (on Wednesday), the FOMC is set to meet. This meeting is one of the small meetings (no updated project ions and no press conference) and we do not expect any changes in monetary policy or any major changes in the statement .
There are no market movers in Scandi today.
Selected market news
On Friday, euro area HICP inflation rose more than expected to 1.9% y/y in April from 1.5% y/y in March. The euro area core inflation also came out stronger than expected at 1.2% from 0.7%. The higher core inflation was driven by service price inflation, which was 1.8% from 1.0%, whereas inflation in non-energy industrial goods was unchanged at 0.3%. This was clearly good news for the ECB. However, as there is a lot of uncertainty with inflation around the timing of Easter, westick to our view that the ECB will continue its QE purchases at EUR60bn per month going into 2018.
On Friday, in Sweden, retail sales figures decreased by 0.4% m/m in March. Retail sales came out at 1.9% y/y in March, which was much lower than the market expected (3.1% y/y). Retail sales in consumables (such as goods sold in department stores and specialised grocery stores) increased by 0.2% y/y, while durables (such as clothing stores, furniture stores, second-hand goods stores and mail order houses) increased by 2.4% y/y. Notably, one important explanat ion for the weak y/y outcome of the month is that the comparison is made with the Easter month of March 2016.
On Sunday, the US congress negotiators reached a tentative deal on an USD1.1trn bill to avert a shutdown of government this week, according to Republican and Democratic aides . The news triggered a subdued relief as Asian equities rose slightly and the USD/JPY soared. In fixed income markets, the 10-year US government bond yield has climbed by 1bp since Friday night . On the data front this morning, the Nikkei Japan Manufacturing PMI for April came out at 52.7 from 52.4 in March.
AUD/USD Daily Outlook
Daily Pivots: (S1) 0.7459; (P) 0.7475; (R1) 0.7501; More...
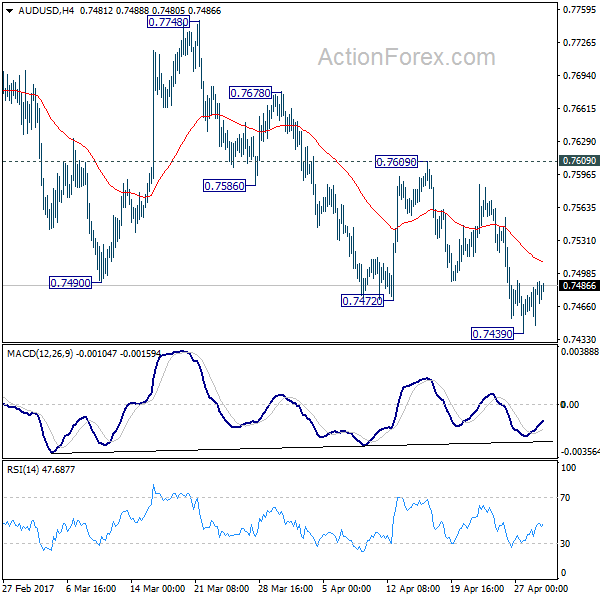
Intraday bias in AUD/USD remains neutral for consolidation above 0.7439 temporary low. Upside of recovery should b limited by 0.7609 resistance and bring another fall. Rise from 0.7158 should have completed at 0.7748 already. Below 0.7439 will target a test on 0.7144/7158 support zone. At this point, there is no clear sign of larger down trend resumption yet. Hence we'll be cautious on strong support from0.7144/58 to contain downside and bring rebound. On the upside, break of 0.7609 will argue that the fall from 0.7748 has completed. In such case, bias will be turned back to the upside for 0.7748 resistance.
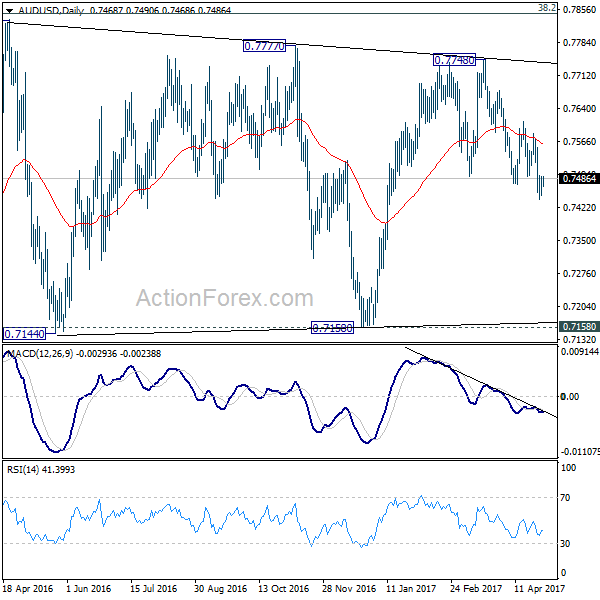
In the bigger picture, we're still treating price actions from 0.6826 low as a correction pattern. And, as long as 38.2% retracement of 0.9504 to 0.6826 at 0.7849 holds, long term down trend from 1.1079 is expected to resume sooner or later. Break of 0.6826 low will target 0.6008 key support level. However, firm break of 0.7849 will indicate that rise from 0.6826 is developing into a medium term rebound, rather than a sideway pattern. In such case, stronger rise should be seen to 55 month EMA (now at 0.8118) and above.
Busy Week Ahead For The NZDUSD
Key Points:
- Bearish week looking likely ahead.
- ABC wave seems to be intact.
- Busy news week should see volatility spike.
It's a busy week ahead for the Kiwi Dollar which means it's worth taking a closer look at the pair to try to establish both a fundamental and technical bias moving forward. Additionally, we should investigate what happened over the prior sessions and how this has positioned the NZD ahead of the slew of data that is coming down the line.
Starting with how the pair got to where it is now, the Kiwi Dollar came under some heavy fire last week, eroding a fortnight's worth of recovery in only three sessions. Specifically, Monday through Wednesday saw the pair plunge from 0.7038 to just 0.6893 as a lack of NZ data left it exposed to the influence of the surge in US New Home Sales to 621K m/m. However, the severity of the slide indicates that the sharp reversal could be more down to the return of that ABC wave that had, until recently, been thought to have been disrupted.
But what do the technicals indicate is on the cards for the week to come? Well, the revival of that ABC wave is likely going to keep the NZDUSD under pressure throughout the week which could lead to substantial losses if the current support level is broken which presently looks rather likely. Indeed, the highly bearish Parabolic SAR and EMA biases are suggesting that such a breakout is warranted which leaves us with quite a bearish forecast for the week ahead if the fundamental results underwhelm.
Speaking of which, as mentioned, it's rather busy on the fundamental news front which could mean some decent price movements lay ahead. Most of the NZ-centric news is scheduled for Tuesday and includes the GDT Price Index, Employment Change, and Unemployment Rate figures. Of course, the dairy price data will be the major driver of prices as is usual but don't discount the impact of the employment figures. Notably, given that we are expecting the jobless rate to hold steady at 5.2%, stay alert for any surprises during the release as they could amplify or curtail fallout of the GDT figure.
Ultimately, we will simply have to wait and see if the above mentioned fundamentals prove to be disruptive or in line with the bearish technical forecast. Regardless, even if we see a strong uptick in the GDT figure or a major drop in unemployment, gains will be limited by the technicals which minimizes upside risks moving forward.
Euro Dollar Facing Busy Week Ahead As GDP Figures Due Out
Key Points:
- Price action trending in a consolidative manner.
- RSI Oscillator nears overbought levels.
- Plenty of volatility looming with key risks events in the week ahead.
The Euro had a relatively flat week but it wasn't without volatility, as the ECB's decision to keep rates on hold, and the requisite speech from Draghi, saw the pair swing in both directions. In particular, some mixed rhetoric from the ECB Chair initially saw the Euro Dollar rallying before declining sharply. Subsequently, the pair largely ended the week near where it started but it now faces some key risk events in the coming week. Therefore, it makes sense to review what occurred in the markets over the past week and what is looming on horizon.
Last week saw the Euro largely remaining within its consolidative phase but not before the pair saw some volatility in the aftermath of the ECB's decision on rates. As expected, the central bank elected to keep the benchmark rate on hold but the proceeding press conference turned out to be the key risk event. The ECB Chair, Mario Draghi, provided a largely mixed message by suggesting that the downside risks of the currency were limited whilst later in the speech stating that inflationary pressures were absent. Subsequently, the pair swung in both directions in response to this highly mixed rhetoric before ending the week right where it started at 1.0897. In addition, the pair also failed to capitalise on the weaker than expected U.S. economic data with an unexpected slip in the Core Durable Good Order figures to -0.2% m/m.
Looking ahead, the coming week is likely to be a busy one for the Euro Dollar given the release of the latest round of Eurozone GDP figures. The quarterly result is forecast at 0.5% but it is highly likely that we could see a diverging figure given the many shocks that have impacted the Eurozone over the past few months. In addition, on the U.S. side of the fence the Fed's decision on rates is looming as is the often contentious Non-Farm Payroll results. In particular, expect plenty of volatility from the Fed's decision given that they have largely avoided setting any form of expectations ahead of the meeting. Subsequently, there is plenty of volatility for the EURUSD likely following the Fed's decision as well as the requisite speeches.
From a technical perspective, the pair is still constrained by its consolidative phase which resulted in a largely sideways direction for price action over the past week. However, despite the period of moderation, the RSI Oscillator is still relatively close to overbought status, which would suggest a pullback is needed to relieve the pressure. Subsequently, our initial bias for the week is neutral given the aforementioned factors but with the caveat to watch for a pullback. Support is currently in place for the pair at 1.0819, 1.0569, and 1.0495. Resistance exists on the upside at 1.0949, 1.1138, and 1.1343.
Ultimately, the coming week is likely to be relatively critical for the Euro Dollar given that the consolidative phase is likely to breakdown in the near term. In particular, the EU GDP and U.S. FOMC results are likely to fundamentally set the tone for the coming days and the reality is that the Euro is likely to see plenty of volatility in light of these events. Subsequently, keep a close watch on your positions in the lead up to the data release because when the Euro finally breaks away from its sideways direction it's likely to occur rapidly indeed.
USD/CAD Daily Outlook
Daily Pivots: (S1) 1.3612; (P) 1.3654; (R1) 1.3685; More....
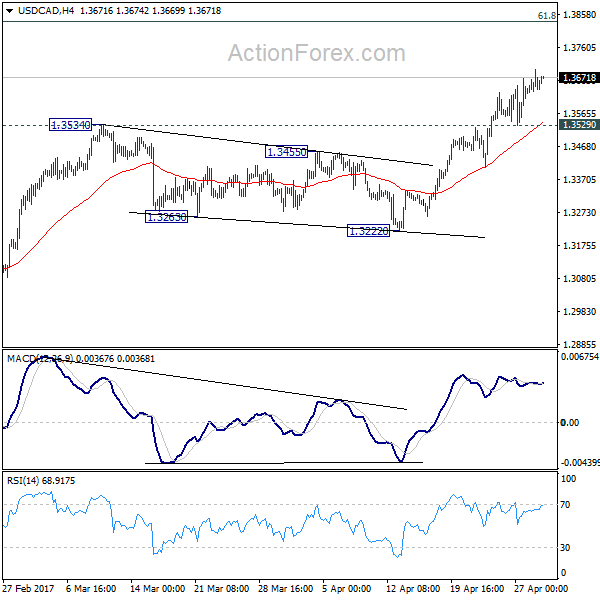
Intraday bias in USD/CAD remains on the upside for the moment. Medium term rise from 1.2460 is still in progress and should target next medium term fibonacci level at 1.3838 ahead. on the downside, break of 1.3529 minor support will turn bias neutral and bring consolidation. But for now, outlook will remain bullish as long as 1.3222 support holds.
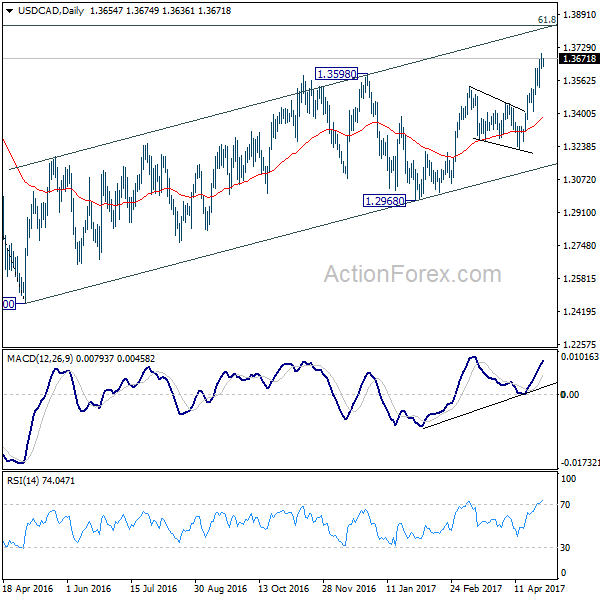
In the bigger picture, price actions from 1.4689 medium term top are seen as a correction pattern. The first leg has completed at 1.2460. The second leg from 1.2460 is likely still in progress and could target 61.8% retracement of 1.4689 to 1.2460 at 1.3838. We'd look for reversal signal there to start the third leg. However, break of 1.3222 support will argue that the third leg has already started and should at least bring a retest of 1.2460 low. Meanwhile, sustained trading above 1.3838 would pave the way to retest 1.4689 high.
Daily Technical Outlook And Review: EUR/USD, GBP/USD, AUD/USD, USD/JPY, USD/CAD, USD/CHF, DOW 30, GOLD
A note on lower timeframe confirming price action...
Waiting for lower timeframe confirmation is our main tool to confirm strength within higher timeframe zones, and has really been the key to our trading success. It takes a little time to understand the subtle nuances, however, as each trade is never the same, but once you master the rhythm so to speak, you will be saved from countless unnecessary losing trades. The following is a list of what we look for:
- A break/retest of supply or demand dependent on which way you're trading.
- A trendline break/retest.
- Buying/selling tails ... essentially we look for a cluster of very obvious spikes off of lower timeframe support and resistance levels within the higher timeframe zone.
- Candlestick patterns. We tend to only stick with pin bars and engulfing bars as these have proven to be the most effective.
EUR/USD
Weekly gain/loss: + 173 pips
Weekly closing price: 1.0897
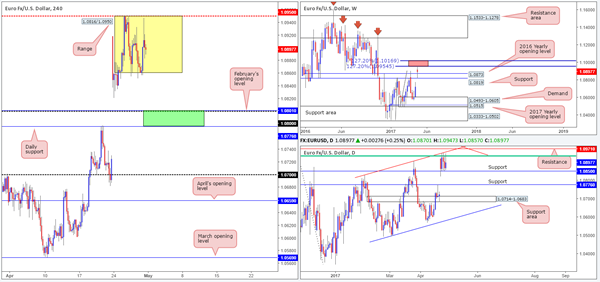
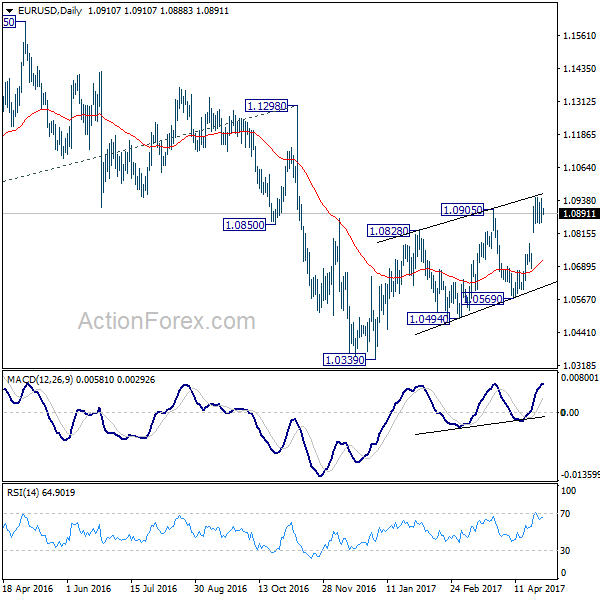
Following a win by centrist Emmanuel Macron at the French presidential elections last week, the pair gapped 200 pips north, which, as you can see, has yet to be filled. Consequent to this, both weekly resistance at 1.0819 and the 2016 yearly opening level at 1.0873 are now acting supports. Also of note are the two nearby 127.2% Fib extensions (red zone) at 1.1016/1.0954 taken from the lows 1.0340/1.0493 that could potentially halt further buying this week.
Turning our attention to the daily candles, the EUR finds itself consolidating between a 61.8% Fib resistance (green line) at 1.0932 (taken from the high 1.1299)/trendline resistance extended from the high 1.0828 and support penciled in at 1.0850. Directly above here, there's resistance pegged at 1.0971 and another trendline resistance seen stretched from the high 1.1616. Beneath the current support, however, the next support level on tap can be seen at 1.0776.
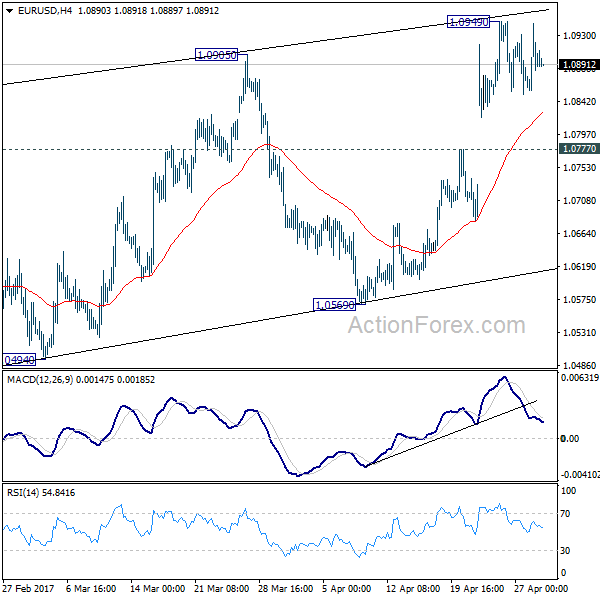
A closer look at price action on the H4 chart shows that the unit has recently entered into the phase of a consolidation between 1.0861/1.0950. Momentum, nevertheless, has been firmly positioned to the upside since early April so a lot of traders will likely have their eye on buying the breakout of this range. Though, with daily resistance seen lurking just above at 1.0971 coupled with the weekly 127.2% Fib extension at 1.0954, this could very well end in tears!
Our suggestions: Based on the above notes, we see two possible scenarios:
Watch for price to breakout above 1.0950, and assess how H4 candle action behaves. In the event that a solid rejection candle is seen, preferably a full-bodied bearish candle, then not only is a move back into the H4 consolidation possible, but a trade short on the back of this is too.
Assuming that the bears do take over this week, longs could be an option from 1.0776/1.0801. Why here? This green area is comprised of a daily support at 1.0776, a round number at 1.08 and February's opening level at 1.0801. Ultimately, before considering a trade from this region we'd like to see some form of bullish rotation emerge from here (a reasonably sized full-bodied bullish candle would be ideal).
Data points to consider: Treasury Sec Mnuchin speaks at 12.45pm. US Core PCE index release at 1.30 and US ISM manufacturing PMI figures at 3pm GMT+1.
Levels to watch/live orders:
- Buys: 1.0776/1.08 ([waiting for a reasonably sized H4 bull candle to form before pulling the trigger is advised] stop loss: ideally beyond the candle's tail).
- Sells: Trading any fakeout seen beyond 1.0950 is a possibility should a full-bodied rejection candle be seen. Stops would ideally be placed beyond daily resistance at 1.0971.
GBP/USD:
Weekly gain/loss: + 139 pips
Weekly closing price: 1.2945
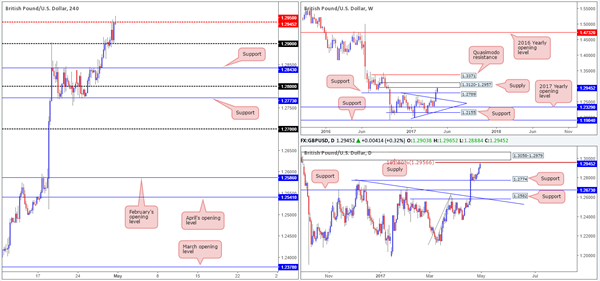
Recent action shows that the GBP/USD broke above weekly resistance at 1.2789 last week amid a generally well-bid market. Although this move marks the third consecutive weekly gain for the GBP, sitting just ahead is a weekly supply seen at 1.3120-1.2957. Therefore, we may see the bears make an appearance this week!
Along similar lines, daily flow shows supply on the horizon at 1.3058-1.2979. As this area is positioned within the walls of the said weekly supply, we feel that a bounce, at the very least, may be seen from here. Also worthy of note is the 161.8% Fib extension at 1.2956 taken from the low 1.2108, which is currently in motion.
Sliding across to the H4 candles, we can see that the pair settled around the mid-level resistance at 1.2950 and chalked in a nice-looking selling wick going into Friday's close. This – coupled with weekly price recently touching gloves with supply, and daily movement checking in with a 161.8% Fib extension, this could encourage sellers into the market today/this week. Ultimately, the next support target on the cards is 1.29: a psychological level that was not only used to springboard price north on Friday, but it also played the part of a considerable resistance back on the 18th April. However, before sellers get excited, there's one cautionary point to consider: the large 1.30 handle sitting just above which could be tested before serious bears step into the market.
Our suggestions: Personally, we believe that bears will make an appearance in the early hours of today's sessions. With that being said, we would not enter immediately at the open as we'd want to assess the opening gap, if any. Furthermore, given the risk of price rallying to shake hands with 1.30, our team would only consider trading short with 50% of our usual position.
Data points to consider: Treasury Sec Mnuchin speaks at 12.45pm. US Core PCE index release at 1.30 and US ISM manufacturing PMI figures at 3pm GMT+1.
Levels to watch/live orders:
- Buys: Flat (stop loss: N/A).
- Sells: 1.2950 region ([dependent on the open, we would consider shorts on the basis of the H4 selling wick seen here] stop loss: ideally beyond the wick at 1.2967)
AUD/USD
Weekly gain/loss: – 58 pips
Weekly closing price: 0.7485
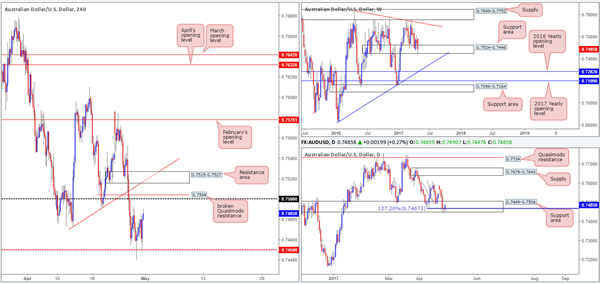
As can be seen from the weekly chart, the bulls have been struggling to get ahead since connecting with the support area at 0.7524-0.7446. If this zone is consumed this week, the next objective in the firing range can be seen at 0.7282: the 2016 yearly opening level that merges closely with a trendline support etched from the low 0.6827.
Moving down a leg to the daily timeframe, we can see that the only bullish day last week was on Friday! The pair is currently seen trading from an AB=CD 127.2% Fib extension at 0.7467 taken from the high 0.7610, which is planted within the walls of a support area at 0.7449-0.7506 (housed within the above said weekly support area). To that end, the bulls may still have a hand in this fight!
The H4 mid-level support at 0.7450 has provided a floor in this market since Thursday. This, alongside both the weekly and daily structures in play at the moment, could eventually lift price up to the broken Quasimodo line at 0.7504, shadowed closely by the 0.75 handle.
So, where does this leave us poor souls? Well, taking a long position at current price would not be something we'd recommend. Yes, there are higher-timeframe support structures in play, but buying into 0.75 would not be the best move, in our opinion. By the same token of course, selling from the 0.75 neighborhood is also tricky, owing to the higher-timeframe supports!
Our suggestions: With everything taken into consideration, our team feels that the best course of action is to lay low for now. Remaining flat when price action is not offering clear signals is, and has always been, the safest route to take!
Data points to consider: Treasury Sec Mnuchin speaks at 12.45pm. US Core PCE index release at 1.30 and US ISM manufacturing PMI figures at 3pm GMT+1.
Levels to watch/live orders:
- Buys: Flat (stop loss: N/A).
- Sells: Flat (stop loss: N/A).
USD/JPY:
Weekly gain/loss: + 256 pips
Weekly closing price: 111.51
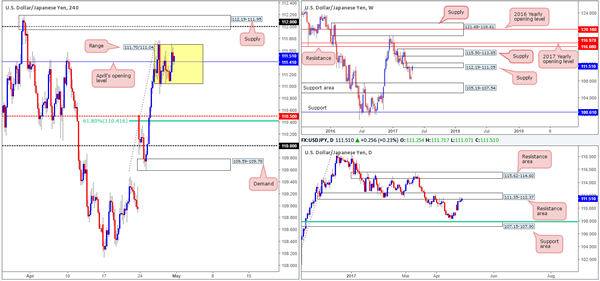
Having seen the USD/JPY gap over 150 pips north after a win by centrist Emmanuel Macron at the French presidential elections last week, we saw the unit enter into the jaws of a weekly supply coming in at 112.19-111.05. The gap, as can be seen from the weekly chart, has yet to be filled and the buyers and sellers remain battling for position within the confines of the said supply.
Since Wednesday, daily price has been seen teasing the underside of a resistance area carved from 111.35-112.37. Judging by the candle action here the bulls still have the upper hand, but given the surrounding weekly supply this could very well change sometime this week! In the event that the bears do come into the market here, the next area of interest for us would be the support zone seen at 107.15-107.90, which is joined closely by a 61.8% Fib support at 107.84 taken from the low 101.19. A continuation move to the upside, nevertheless, could set the stage for price to challenge the resistance area at 115.62-114.60.
A brief look at recent dealings on the H4 chart shows that the market is currently engaged within the walls of a range fixed between 111.70/111.04. Also of interest here is April's opening level at 111.41 seen housed within. A few pips above this consolidation is supply marked at 112.19-111.95, which surrounds the 112 handle and is located within the upper limits of both the current weekly supply and daily resistance area. Below the range is mid-level support at 110.50 that ties in nicely with a 61.8% Fib support at 110.41 taken from the low 109.59.
Our suggestions: In respect to current price action, here's what we see:
Taking a long on the break of said H4 range is not permitted owing to higher-timeframe structures and the aforementioned H4 supply.
A break below the H4 range followed up with a strong retest is, in our opinion, worthy of consideration since there's room for a move down to at least 110.50 from here, and possibly further.
Entering into longs from 110.50 may be chancy what with price lodged within both weekly and daily resistances!
Data points to consider: Treasury Sec Mnuchin speaks at 12.45pm. US Core PCE index release at 1.30 and US ISM manufacturing PMI figures at 3pm GMT+1.
Levels to watch/live orders:
- Buys: Flat (stop loss: N/A).
- Sells: Watch for price to engulf 111.04 and then look to trade any retest seen thereafter ([waiting for a H4 full-bodied bear candle to form following the retest is advised] stop loss: ideally beyond the candle's wick).
USD/CAD:
Weekly gain/loss: + 158 pips
Weekly closing price: 1.3652
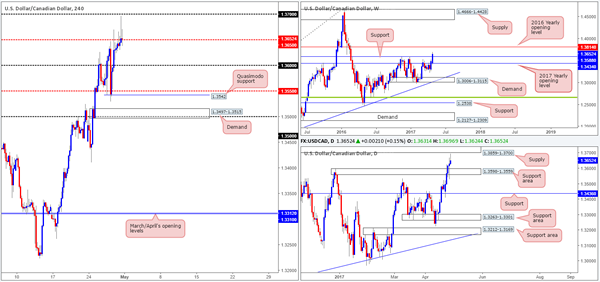
The US dollar made considerable ground against its Canadian counterpart last week, consequently smashing through weekly resistance at 1.3588 and reaching a high of 1.3696. Looking at the strength of the bulls at the moment, a continuation move up to the 2016 yearly opening level at 1.3814 is likely in order.
The story on the daily chart, however, is slightly different given that supply at 1.3859-1.3700 is seen within striking distance! What is notable from a technical perspective is that the 2016 yearly opening level resides within the upper limits of this said supply!
A quick recap of Friday's movement on the H4 shows us that the bulls were unable to make much headway beyond the mid-level resistance at 1.3650, despite aggressively whipsawing up to within inches of the 1.37 handle amid the US segment. Is this enough to entice sellers into the market today? Well, given the room on the weekly chart seen for an advance, and daily price, albeit close, not yet able to test the current supply, we do not think so.
Our suggestions: The 1.37 handle remains of interest to our team this week seeing as how it aligns perfectly with the underside of the said daily supply. An intraday short from this level could be something to think about. The reason for not expecting much more of a move is simply through fear of weekly price dragging the market higher to the above said 2016 yearly opening level.
And this is why we believe the better level for shorts today/this week is the 2016 yearly opening base itself (1.38 region) as it is firmly positioned within the said daily supply, thus allowing the trader to conservatively place stops above this area.
Data points to consider: Treasury Sec Mnuchin speaks at 12.45pm. US Core PCE index release at 1.30 and US ISM manufacturing PMI figures at 3pm GMT+1.
Levels to watch/live orders:
- Buys: Flat (stop loss: N/A).
- Sells: 1.37 region ([possible intraday shorts – would not advise placing pending orders – wait for additional lower-timeframe confirming price action – see the top of this report] stop loss: dependent on where one confirms this area). 1.3814/1.38 region is an ideal place for shorts since this area requires no additional confirmation (stop loss: conservative at 1.3861).
USD/CHF:
Weekly gain/loss: – 11 pips
Weekly closing price: 0.9946
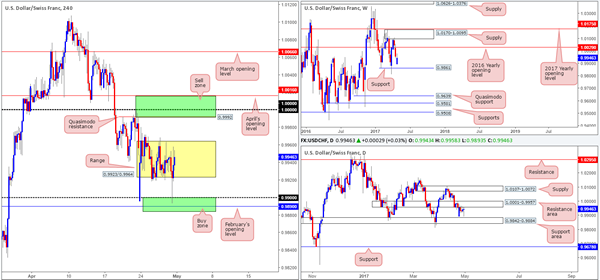
In spite of last week's 60-pip opening gap, the pair ended the week not only filling the gap, but also recording little change by the close. On the weekly chart, we still have the support level at 0.9861 in our sights. Price came within 30 or so pips of this barrier last week before rotating to the upside. The additional level of interest on this scale is the 2016 yearly opening line forged at 1.0029 that's located just below a supply zone pegged at 1.0170-1.0095.
Dropping down to the daily chart, we can see that price spent the entire week clinging to the underside of a resistance area at 1.0001-0.9957, and left the nearby support area at 0.9842-0.9884 unchallenged (holds weekly support within). Any sustained move below this support zone would likely place support at 0.9678 in the spotlight. A push above the current resistance area on the other hand could lead to the Swissy attacking the supply zone plotted at 1.0107-1.0072.
Over to the H4 chart, Friday's movement aggressively whipsawed through the lower edge of the range fixed between 0.9923/0.9964, and tapped a (noted) buy zone at 0.9884/0.99. Well done to any of our readers who managed to catch this move! We passed since the bullish rotation candle was unfortunately too big!
Our suggestions: With little change seen to structure on Friday, the team believes that there's still equal opportunity to trade this pair both long and short today. For shorts, we have the 1.0016/0.9992 region, and for longs the 0.9884/0.99 remains of interest despite it being tested on Friday (green zones on the H4 chart). Both zones, as you can probably see, also boast daily structure.
The only grumble we would have if we were to take a long from the said H4 area is the fact that weekly price could potentially push the market lower to shake hands with support at 0.9861. On a similar note, a short from 1.0016/0.9992 is somewhere that could be faked as price may want to connect with the 2016 yearly opening level mentioned above at 1.0029. As such, we are advising traders not to trade the above said zones blindly! Wait for additional confirmation either in the form of a H4 candle (preferably a full-bodied candle) or a lower-timeframe signal (see the top of this report).
Data points to consider: Treasury Sec Mnuchin speaks at 12.45pm. US Core PCE index release at 1.30 and US ISM manufacturing PMI figures at 3pm GMT+1.
Levels to watch/live orders:
- Buys: 0.9884/0.99 ([waiting for a reasonably sized H4 bull candle to form before pulling the trigger is advised] stop loss: ideally beyond the candle's tail).
- Sells: 1.0016/0.9922 ([waiting for a reasonably sized H4 bear candle to form before pulling the trigger is advised] stop loss: ideally beyond the candle's wick).
DOW 30
Weekly gain/loss: + 387 points
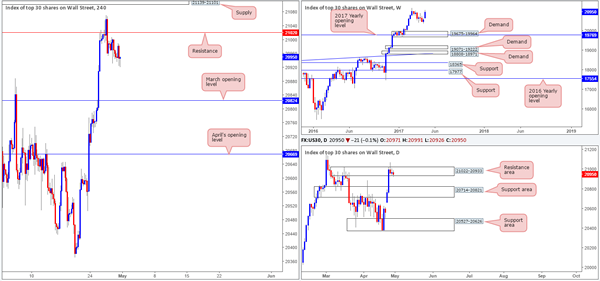
Weekly closing price: 20950
Things ended positively for US equities last week as the index surged around 400 points into the close! From a weekly perspective, we're looking for this strength to continue which should eventually lift price to fresh record highs. Be that as it may, down on the daily chart we can see the unit is finding resistance around the 21022-20933 neighborhood. While this area has capped the market since Tuesday, there has been little downside movement generated thus far, even with Wednesday's bearish selling wick! This suggests that the bulls remain supportive here for the time being.
Looking over to the H4 chart, the bulls failed to overcome resistance at 21020 on Wednesday, which sent price grinding lower into the week's end. The next support target on tap from here is not seen in view until March's opening level at 20824 that sits conveniently above the daily support area at 20714-20821 (the next downside target on that timeframe).
Our suggestions: Ultimately, our team's bias is long. However, we're finding it difficult to pin down a setup given the only support present is March's opening level seen on the H4 chart. Therefore, unless new H4 structure forms at current price or we see a decline down to 20824, we will remain flat.
Data points to consider: Treasury Sec Mnuchin speaks at 12.45pm. US Core PCE index release at 1.30 and US ISM manufacturing PMI figures at 3pm GMT+1.
Levels to watch/live orders:
- Buys: 20824 looks an interesting level for longs. However, we would require a H4 bullish candle to present itself here (preferably a full-bodied candle) before committing.
- Sells: Flat (stop loss: N/A).
GOLD:
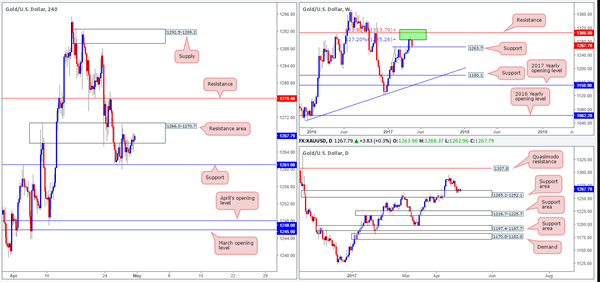
Weekly gain/loss: – $16.7
Weekly closing price: 1267.7
After a rather feeble reaction seen from within the walls of the two weekly Fibonacci extensions 161.8/127.2% at 1313.7/1285.2 taken from the low 1188.1 (green zone) two weeks back, weekly price eventually eased off from this zone last week. The move brought the yellow metal down to a support seen at 1263.7, which held firm going into the close.
In conjunction with weekly flow, there's a daily support area at 1265.2-1252.1 that's been in play since Tuesday and houses the said weekly support level. Bids are likely to continue defending this zone with it having been a strong barrier of resistance on a number of occasions this year.
Since Wednesday, the H4 candles have been consolidating between support at 1261.0 and a resistance area formed at 1266.0-1270.7. A break above this zone could lead to a move being seen up to resistance noted at 1276.4, whereas a break below the current support may see bullion reach for April's opening line at 1248.0, followed closely by March's opening line at 1245.9.
Although shorts look tempting beyond the current H4 support level down to April's opening level, we would not feel comfortable selling here knowing what's lurking beneath us on the higher timeframes! In regards to longs, however, yes, we would be trading in line with higher-timeframe flow, but seeing as this would entail us buying into a H4 resistance area, this is also not really our cup of tea.
Our suggestions: Neither a long nor short seems attractive at this time. It appears we're trapped from both ends! With this being the case, remaining on the sidelines may very well be the better path to take today.
Levels to watch/live orders:
- Buys: Flat (stop loss: N/A).
- Sells: Flat (stop loss: N/A).
EUR/USD Daily Outlook
Daily Pivots: (S1) 1.0850; (P) 1.0898 (R1) 1.0941; More....
Intraday bias in EUR/USD remains neutral for consolidation below 1.0949 temporary top. Another rise is expected as long as 1.0777 support holds. But still, choppy rebound from 1.0339 is seen as a correction. Hence we'd look for topping again on next rise. Meanwhile, on the downside, break of 1.0777 will turn turn bias to the downside for 1.0569 support first.
In the bigger picture, as long as 1.1298 key resistance holds, whole down trend from 1.6039 (2008 high) is still expected to continue. Break of 1.0339 low will send EUR/USD through parity to 61.8% projection of 1.3993 to 1.0461 from 1.1298 at 0.9115. However, considering bullish convergence condition in weekly MACD, break of 1.1298 will indicate term reversal. This would also be supported by sustained trading above 55 week EMA.
Daily Technical Analysis: USD/JPY Completes Wave-4 And Prepares For Wave-5 Breakout
Currency pair USD/JPY
The USD/JPY is building a potential wave 4 (brown) correction which is moving sideways and staying above the 23.6% Fibonacci retracement level. A bullish break could see a continuation of a bullish 5th wave (brown).
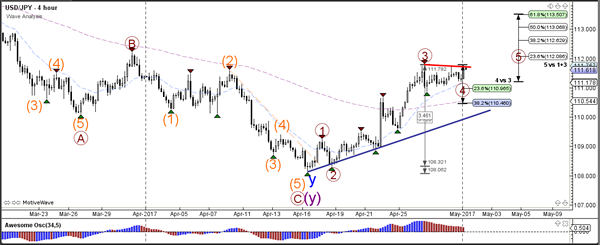
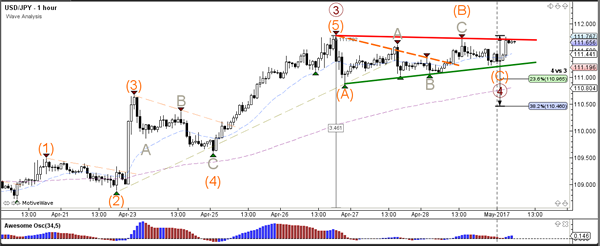
The USD/JPY is building a contracting triangle (red/green) chart pattern. A break below the support trend line (green) could see a larger retracement unfold towards the Fib levels of wave 4 (brown) whereas a break above resistance (red) could see a bullish breakout develop within wave 5.
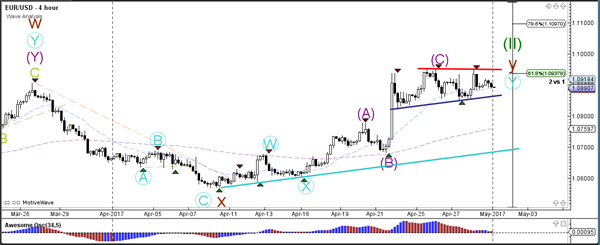
Currency pair EUR/USD
The EUR/USD could be building a consolidation pattern with support (blue) and resistance (red) trend lines marking the boundaries. A bullish break above resistance (red) would indicate a potential uptrend continuation towards the 78.6% Fibonacci level of wave 2 (green) whereas a bearish break could start a reversal.
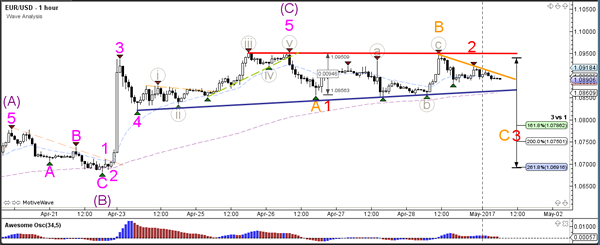
The EUR/USD reversal pattern did not occur as price failed to break the support trend line (blue) and is extending the correction sideways (red/blue lines). The 123 (red) or ABC (orange) wave counts are possible with a bearish break but become invalidated with a bullish break.
Currency pair GBP/USD
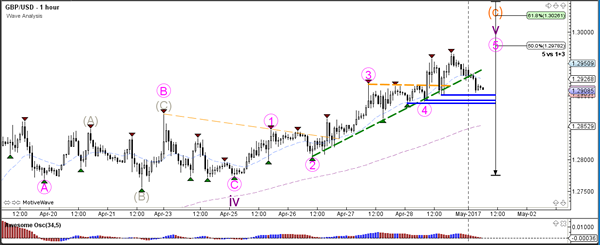
The GBP/USD is continuing with the wave C (orange) bullish momentum towards the 1.30 psychological round level. The 1.30 level could be turn out to be a tough resistance level and potential bounce spot.
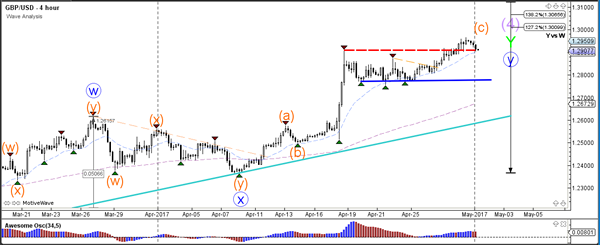
The GBP/USD could potentially have completed the 5th wave (pink) if price manages to break below support (blue). A failure to break could see an extension of the 5th wave (pink).
GBP/USD Daily Outlook
Daily Pivots: (S1) 1.2899; (P) 1.2932; (R1) 1.2975; More...
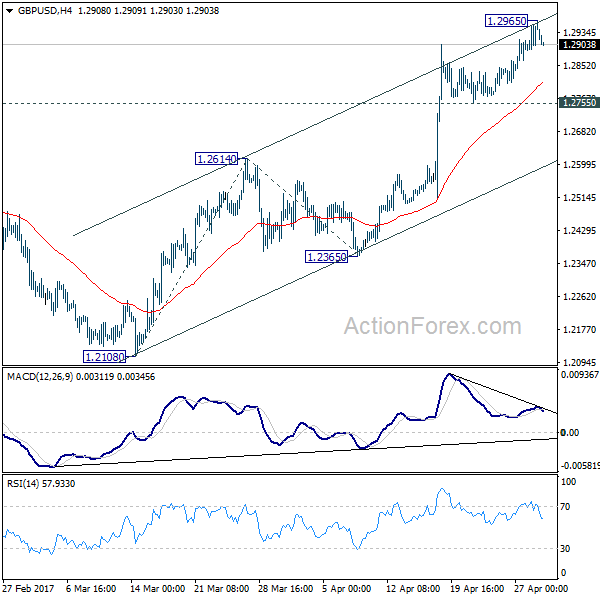
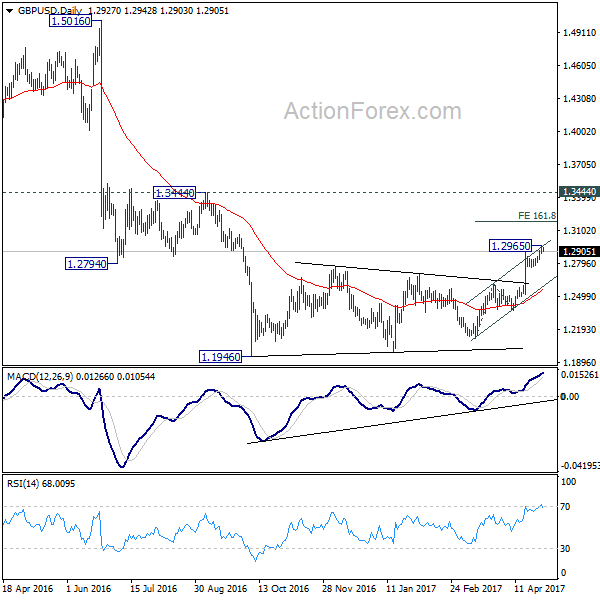
GBP/USD lost momentum again after hitting 1.2965 and intraday bias is turned neutral. Further rise would be seen as long as 1.2755 minor support holds. Above 1.2965 will target 161.8% projection of 1.2108 to 1.2614 from 1.2365 at 1.3184. At this point, price actions from 1.1946 are still interpreted as a correction pattern. Therefore, we'd expect strong resistance below 1.3444 to bring larger down trend resumption. On the downside, break of 1.2755 minor support will turn bias to the downside. Further break of 1.2614 resistance turned support will now indicate near term reversal.
In the bigger picture, fall from 1.7190 is seen as part of the down trend from 2.1161. There is no sign of medium term reversal yet. Sustained trading below 61.8% projection of 2.1161 to 1.3503 from 1.7190 at 1.2457 will target 100% projection at 0.9532. Overall, break of 1.3444 resistance is needed to confirm medium term bottoming. Otherwise, outlook will remain bearish.