Sample Category Title
Pound Trading On A Stronger Footing This Morning
For the 24 hours to 23:00 GMT, the GBP rose 0.18% against the USD and closed at 1.2853.
In the Asian session, at GMT0300, the pair is trading at 1.2861, with the GBP trading 0.06% higher against the USD from yesterday’s close.
The pair is expected to find support at 1.2817, and a fall through could take it to the next support level of 1.2774. The pair is expected to find its first resistance at 1.2890, and a rise through could take it to the next resistance level of 1.2920.
Looking ahead, market participants await the release of UK’s GfK consumer confidence index for April, set to release overnight.
The currency pair is trading above its 20 Hr and 50 Hr moving averages.

BoJ Keeps Monetary Policy Unchanged, Upgrades Economic Outlook
For the 24 hours to 23:00 GMT, the USD rose 0.22% against the JPY and closed at 111.20.
On the macro front, Japan's small business confidence index dropped more-than-anticipated to a level of 48.6 in April, compared to market expectations of a fall to a level of 49.4. The index had registered a level of 50.5 in the previous month.
In the Asian session, at GMT0300, the pair is trading at 111.26, with the USD trading marginally higher against the JPY from yesterday's close.
Earlier today, the Bank of Japan (BoJ), in its latest monetary policy meeting, opted to leave the benchmark interest rate steady at -0.1% and kept the yield target for 10-year Japanese government bonds around 0%.
In its quarterly economic outlook report, the central bank offered a more upbeat outlook on the economy, raising Japan's GDP forecast for the 2017-18 fiscal year to 1.6%, from the 1.5% projected in January, amid optimism that a pick-up in overseas demand will help sustain an export-driven economic recovery.
However, the BoJ lowered its inflation forecast to 1.4% from 1.5% for the same period.
The pair is expected to find support at 110.82, and a fall through could take it to the next support level of 110.37. The pair is expected to find its first resistance at 111.74, and a rise through could take it to the next resistance level of 112.21.
Moving ahead, Japan's jobless rate, consumer price inflation, retail trade, large retailers' sales and flash industrial production data, all for March, set to release overnight, will pique investor attention.
The currency pair is showing convergence with its 20 Hr moving average and trading above its 50 Hr moving average.

Swiss ZEW Expectations Index Declined In April
For the 24 hours to 23:00 GMT, the USD declined 0.03% against the CHF and closed at 0.993.
Macroeconomic data showed that Switzerland's ZEW economic expectations index fell to a level of 22.2 in April, following a reading of 29.6 in the previous month. On the other hand, the nation's UBS consumption indicator climbed to a level of 1.50 in March, after recording a revised level of 1.45 in the prior month.
In the Asian session, at GMT0300, the pair is trading at 0.9929, with the USD trading slightly lower against the CHF from yesterday's close.
The pair is expected to find support at 0.9907, and a fall through could take it to the next support level of 0.9886. The pair is expected to find its first resistance at 0.9959, and a rise through could take it to the next resistance level of 0.9990.
Ahead in the day, investors will focus on Switzerland's trade balance figures for March.
The currency pair is trading below its 20 Hr and 50 Hr moving averages.

Canadian Retail Sales Surprisingly Declined In February
For the 24 hours to 23:00 GMT, the USD rose 0.32% against the CAD and closed at 1.3615.
The Canadian Dollar lost ground, on reports that the US is considering withdrawal from the North American Free Trade Agreement (NAFTA) between the US, Canada and Mexico.
On the data front, Canada's retail sales unexpectedly dropped 0.6% MoM in February, compared to a revised advance of 2.3% in the previous month, while investors had envisaged for a flat reading.
In the Asian session, at GMT0300, the pair is trading at 1.3558, with the USD trading 0.42% lower against the CAD from yesterday's close.
The pair is expected to find support at 1.3517, and a fall through could take it to the next support level of 1.3476. The pair is expected to find its first resistance at 1.3623, and a rise through could take it to the next resistance level of 1.3688.
The currency pair is trading below its 20 Hr and 50 Hr moving averages.

European Open Briefing: Stock Markets Fell After US President Trump’s Tax Reform Announcement Fell Short Of Expectations
Global Markets:
- Asian stock markets: Nikkei down 0.30 %, Shanghai Composite fell 0.40 %, Hang Seng lost 0.05 %, ASX 200 gained 0.05 %
- Commodities: Gold at $1268 (+0.35 %), Silver at $17.52 (+0.50 %), WTI Oil at $49.40 (-0.45 %), Brent Oil at $52.20 (-0.35 %)
- Rates: US 10 year yield at 2.32, UK 10 year yield at 1.09, German 10 year yield at 0.36
News & Data:
- PBOC sets USD/CNY reference rate for today at 6.8896 (vs. yesterday at 6.8845)
- Trump tells Canada, Mexico, he won't terminate NAFTA treaty: White House – RTRS
- Asian shares retreat from highs on doubts over Trump tax plan – RTRS
- Oil prices fall on lingering oversupply concerns – RTRS
Bank of Japan Rate Decision:
- BOJ holds rate at -0.10%, maintains 10yr yield target at 0.00%, as expected
- Japan's economy turning towards moderate expansion
- Economy, price risks tilted towards downside
- Output, exports on upward trend
- Japan economy likely to continue moderate expansion
- Momentum towards hitting 2 percent target lacking
- Long-term inflation expectations remain on weak note
Markets Update:
Stock markets fell after US President Trump's tax reform announcement fell short of expectations. There was a lack of details and the market is still doubting whether the reform will be able to pass in Congress.
The US Dollar came under pressure too. EUR/USD jumped back above 1.09, while GBP/USD is approaching again the 1.29 level. Meanwhile, USD/JPY retraced back to 111 and briefly fell below that level in the Asian session. No surprises from the BoJ, as they left interest rates and the size of their QE programme unchanged.
Nevertheless, commodity currencies remain weak. AUD/USD broke below 0.7480 support and extended losses to 0.7450 yesterday. The charts suggest a move towards 0.73 could follow in the near-term. Price action in NZD/USD is looking quite bearish as well.
The main event today will be the ECB rate decision. The market is no expecting any changes, and Draghi is likely to remain neutral during the press conference. Inflation is still low in the Euro Zone, and it will take some time for the central bank to switch to a more hawkish bias.
Upcoming Events:
- 07:00 GMT – Swiss Trade Balance
- 07:30 GMT – Bank of Japan Press Conference
- 10:00 GMT – Euro Zone Consumer Confidence
- 12:45 GMT – ECB Rate Decision
- 13:00 GMT – German CPI
- 13:30 GMT – US Durable Goods Orders
- 13:30 GMT – US Initial Jobless Claims
- 13:30 GMT – ECB Press Conference
- 15:00 GMT – US Pending Home Sales
Market Update – Asian Session: Trump Nixes Bailing On NAFTA
Asia Mid-Session Market Update: BOJ on hold as expected; Trump nixes bailing on NAFTA; Samsung Electronics shares rise on outlook
US Session Highlights
Stocks remained mostly unchanged on the day after giving up small gains made during the first half of today's session. Investors digested Trump's relatively broad tax reform plan as it was presented. Fixed income become the asset of choice again, as the 10-year yield dropped 3bps on the day. Volume continued to show strength, on NYSE at 3:30pm was 18% above its 3-month average.
Trump proposed an overhaul of the tax system with large reductions in corporate rates and amount of income brackets, though many precise details remain to be fleshed out. In the plan presented today, the corporate tax would be cut from 35% to 15% and the number of income brackets would be reduced from 7 to 3. The top income tax rate would be 35% and the lower brackets would be set to 25% and 10%. The proposal would also look at repealing the inheritance tax and limiting tax deductions.
US markets on close: Dow -0.1%, S&P500 flat, Nasdaq flat
Best Sector in S&P500: Telecommunications
Worst Sector in S&P500: Real Estate
Biggest gainers: EW +10.5%; WYN +9.0%; PRGO +7.7%
Biggest losers: STC -16.8%; CHRW -6.3%; DPS -5.5%
At the close: VIX 10.85 (bps); Treasuries: 2-yr 1.28% (bps), 10-yr 2.32% (bps), 30-yr 2.97% (bps)
US movers afterhours
TER Reports Q1 $0.44 v $0.38e, R$457M v $439Me; Guides Q2 $0.81-0.90 v $0.60e, R$660-700M v $564Me; +11.1% afterhours
UCTT Reports Q1 $0.47 v $0.42e, R$204.6M v $192Me; Guides Q2 adj $0.49-0.55 v $0.33e, R$210-220M v $181Me; +10.4% afterhours
INTU Reports season to date total Turbo Tax units were up 2% y/y; +7.3% afterhours
ALSN Reports Q1 $0.52 v $0.35e, R$499M v $463Me; +6.8% afterhours
WTW Names Mindy Grossman President and CEO, effective in July; +6.0% afterhours
SAM Reports Q1 $0.45 v $0.26e, R$161.7M v $170Me; Affirms FY17 $4.20-6.20 v $5.46e; -0.3% afterhours
ETH Reports Q3 $0.23 v $0.27e, R$180.5M v $184Me; -4.0% afterhours
CTXS Reports Q1 $0.97 v $0.94e, R$663M v $661Me; Guides Q2 $0.97-1.00 v $1.08e, R$685-695M v $693Me; -5.5% afterhours
FFIV Reports Q2 $1.95 v $1.97e, R$518M v $523Me; Guides Q3 $2.01-2.04 v $2.08e, R$520-530M v $537Me; -7.9% afterhours
AMSC; AMSC Guides Q4 rev $15-16M v $24.6Me; -35.7% afterhours
Key economic data
(JP) BOJ LEAVES INTEREST RATE ON EXCESS RESERVES (IOER) UNCHANGED AT -0.10% AND 10-YEAR JGB YIELD TARGET AT AROUND 0.0%; AS EXPECTED
(CN) CHINA MAR INDUSTRIAL PROFITS Y/Y: 23.8% V 2.3% PRIOR
(AU) AUSTRALIA Q1 IMPORT PRICE INDEX Q/Q: 1.2% V -0.5%E; EXPORT PRICE INDEX Q/Q: 9.4% V 8.0%E
(KR) SOUTH KOREA PRELIM Q1 GDP Q/Q: 0.9% V 0.8%E; Y/Y: 2.7% V 2.6%E
(JP) Japan investors net sold ¥1.82T in foreign bonds v sold ¥796B in prior week; Foreign investors net bought ¥258B in Japan stocks v bought ¥315.2B in prior week
Asia Session Notable Observations, Speakers and Press
Asian equity markets are mixed as investors digest the news out of Washington, as Trump administration has clearly shifted into a higher gear on policy. After unveiling the broad outlines to a massive corporate tax cut reduction, White House officials have taken on the trade agenda, as Commerce Min confirmed "investigation into whether aluminum imports compromise national security". This has been perceived as a shot across the bow by Beijing, calling for direct dialogue on handling trading of the metal. In similar vein, White House announced that after speaking with leaders of Canada and Mexico, Pres Trump decided not to terminate NAFTA at this time, as all leaders agreed to "enable renegotiaton of NAFTA deal" at later date.
FX market activity was more volatile on the US policy developments. USD/MXN and USD/CAD fell 1% and 0.5% respectively on NAFTA announcement, while AUD/USD saw session lows on protectionist fears from aluminum action. USD/JPY was little changed in the wake of more upbeat BOJ policy announcement, trading around 111.20. BOJ maintained its yield curve control at 0.0% on the 10-yr JGB yield and -0.1% rate on IOER, but raised its forward GDP estimates for the current year from 1.5% to 1.6% and next year from 1.1% to 1.3%. BOJ also expressed some concerns over slow progress on inflation front, cutting FY17 CPI view from 1.5% to 1.4%. In terms of its assessment, BOJ said Japan's economy has been turning towards a moderate expansion (prior was continues to recover moderately), while also boosting its view of Exports and Industrial Output to "increasing trend" from "picked up".
Among key corporates, Samsung Electronics final Q1 results was below consensus at KRW) Net 7.49T v 8.8Te on Rev of 50.6T v 56.5Te, but the company forecast Net profit to turn higher this year, Capex to increase, and smartphone sales to bounce. SE also announced its first ever dividend and a KRW2.3T buyback, earning praise from activist Elliott Management which had in the past called for a split into a holding vehicle even though the company did not commit to that structure. After initial downside, shares moved higher by about 2%.
China
(US) Commerce Dept confirms opening investigation into whether aluminum imports compromise national security
(CN) China Commerce Ministry: US Commerce Dept mishandled China plywood companies in subsidies probe; Urging US to abide by WTO rules in plywood probe; need a dialogue with Us to address aluminum - press
(CN) China MOFCOM reports Q1 exports to Belt and Road nations +26.2% y/y (28.2% of total exports)
(CN) China Iron and Steel Association (CISA): memorandum signed by President Trump encouraging an investigation of US steel imports is contrary to fair trade and sends a signal of protectionism
Australia
(AU) Australia PM Turnbull expected to impose a Domestic Gas Security Mechanism from July 1 this year and that it would not require legislation in Parliament as it can be imposed as a customs regulation
Korea
(KR) South Korea Trade Ministry raises 2017 export growth outlook to 6-7% v 2.9% prior
(KR) White House administration signs communique directed at North Korea following briefing with US lawmakers
Asian Equity Indices/Futures (00:00ET)
Nikkei -0.2%, Hang Seng flat, Shanghai Composite -0.4%, ASX200 +0.2%, Kospi -0.2%
Equity Futures: S&P500 +0.1%; Nasdaq +0.1%, Dax +0.2%, FTSE100 +0.1%
FX ranges/Commodities/Fixed Income (00:00ET)
EUR 1.0900-1.0920; JPY 111.00-111.40; AUD 0.7470-0.7490; NZD 0.6890-0.6920
June Gold +0.3% at 1,268/oz; June Crude Oil -0.5% at $49.37/brl; July Copper -0.4% at $2.59/lb
SLV iShares Silver Trust ETF daily holdings rise to 10,273 tonnes from 10,178 tonnes prior
(CN) PBOC SETS YUAN MID POINT AT 6.8896 V 6.8845 PRIOR; 3rd straight weaker setting; weakest setting since Apr 12th
(CN) PBOC to inject combined CNY50B v CNY80B prior in 7-day, 14-day and 28-day reverse repos, 8th straight injection
(NZ) New Zealand MoF sells NZ$150M in 2037 bonds
Asia equities / Notables / movers by sector
Samsung Electrocnis, 005930.KR +1.9%, final Q1 results
AIA, 1299.HK, +4.4%, Q1 results
Sands China, 1928.HK, -3.3%, Q1 results
Tokuyama, 4043.JP, +5.8%, sells Malaysia business
Canon, 7751.JP, +3.9%, Q1 results
Yahoo Japan, 4689.JP, -9.9% FY16/17 results
China Minsheng Bank, 1988.HK, +1.3%, Q1 results
China Shipbuilding Industry, 601989.CN, -3.7%, Q1 results
BHP, BHP.AU, -1.0%, weaker on Australia Govt gas export limitation plan
Clean TeQ Holdings, CLQ.AU, +14.8%, results
Ten Networks, TEN.AU, -15.2%; H1 results, going concerns on fuding
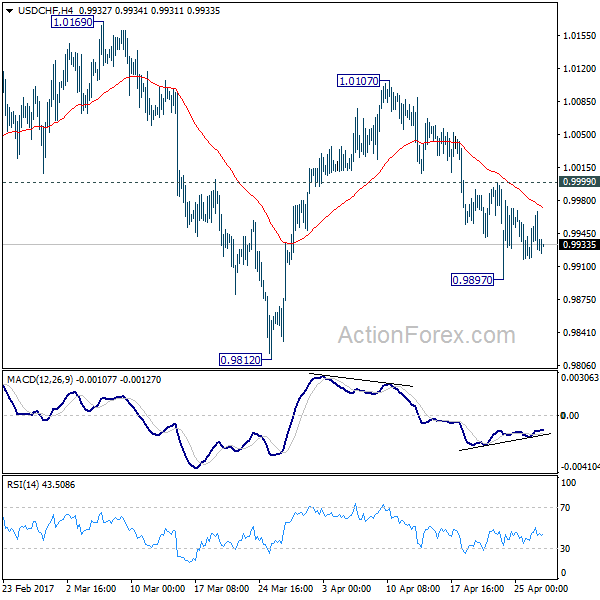
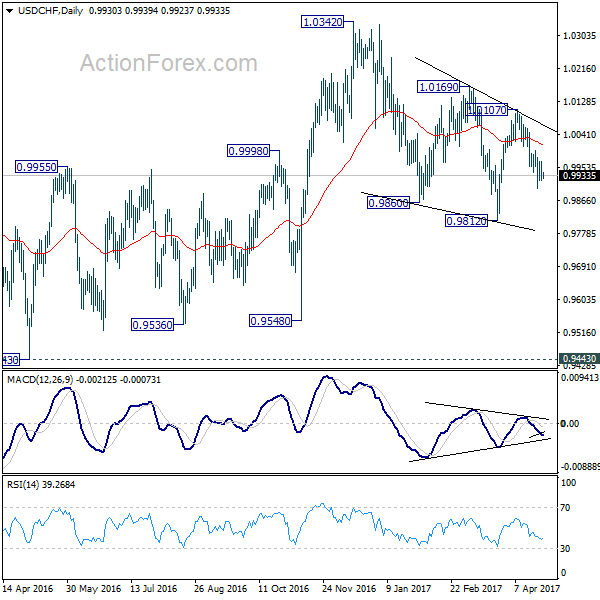
USD/CHF Daily Outlook
Daily Pivots: (S1) 0.9909; (P) 0.9939; (R1) 0.9960; More.....
Intraday bias in USD/CHF remains neutral for the moment. At this point, with 0.9999 minor resistance intact, deeper fall is still in favor. Below 0.9897 temporary low will turn bias to the downside for 0.9812 and possibly below. Nonetheless, whole decline from 1.0342 is seen as a correction. Hence, we'll look for bottoming signal below 0.9812. Meanwhile, on the upside, above 0.9999 minor resistance will turn bias back to the upside for 1.0107 resistance.
In the bigger picture, we're still maintaining that firm break of 1.0342 key resistance is needed to confirm underlying bullish momentum in the cross. However, the corrective nature of the fall from 1.0342 is starting to give the medium term outlook a bullish favor. Hence, in stead of looking for topping signal around 1.0342, we'd now pay closer attention to upside acceleration as USD/CHF approaches this level again.
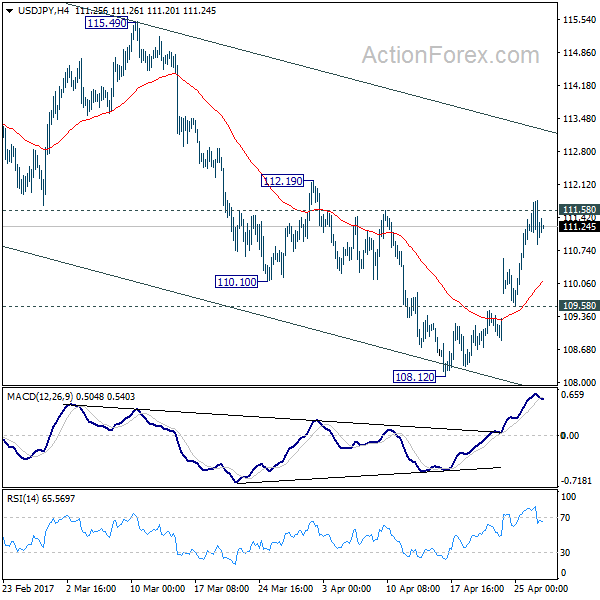
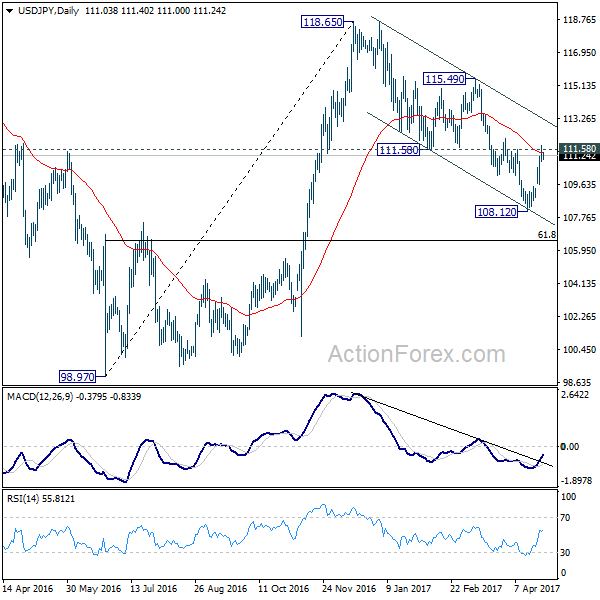
USD/JPY Daily Outlook
Daily Pivots: (S1) 110.68; (P) 111.23; (R1) 111.60; More....
At this point, further rise is expected in USD/JPY with 109.58 minor support intact. Sustained trading above 111.58 support turned resistance will indicate that fall from 118.65 is merely a corrective move and has completed. Outlook will then be turned bullish for 115.49 resistance and above. However, break of 109.58 will argue that fall from 118.65 is still in progress and will turn bias to the downside for 108.12 and below.
In the bigger picture, price actions from 125.85 high are seen as a corrective pattern. Current development suggests that it's not completed yet and is extending. In case of deeper decline, downside should be contained by 61.8% retracement of 75.56 to 125.85 at 94.77 to bring rebound. Rise from 75.56 is still expected to resume later after the correction from 125.85 completes.
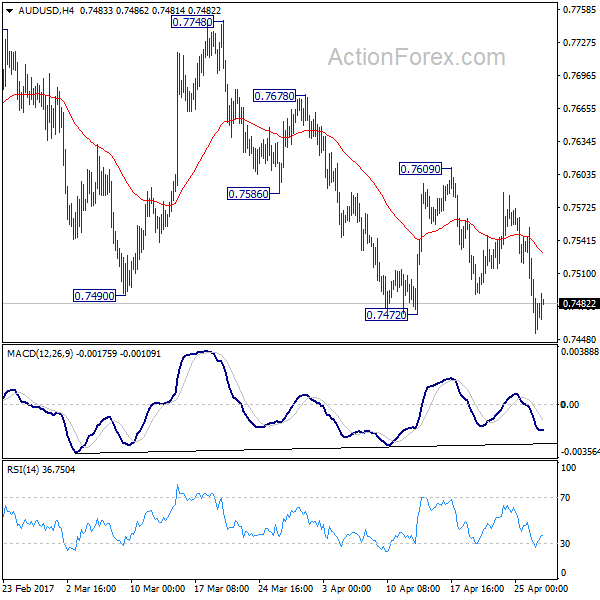
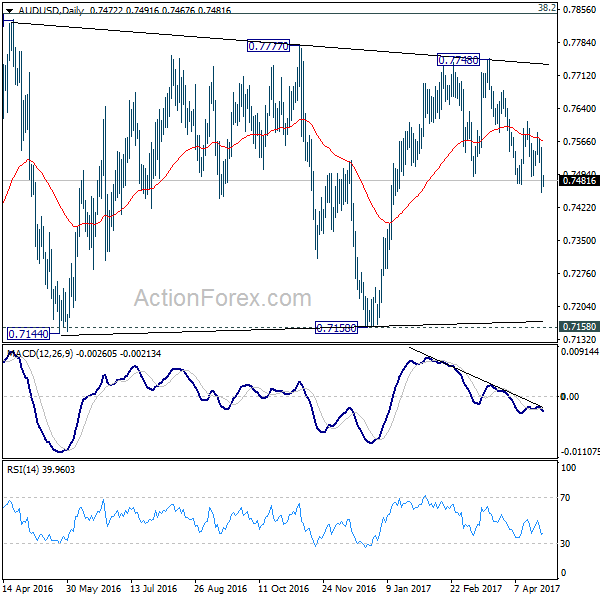
AUD/USD Daily Outlook
Daily Pivots: (S1) 0.7435; (P) 0.7493; (R1) 0.7532; More...
AUD/USD's break of 0.7472 support revives that case that whole rise from 0.7150 is completed at 0.7748. Intraday bias is turned back to the downside. Deeper fall is now anticipated back to test 0.7144/58 key near term support zone. On the upside, break of 0.7609 resistance is now needed to indicate completion of the fall from 0.7748. Otherwise, outlook will stay mildly bearish in case of recovery.
In the bigger picture, we're still treating price actions from 0.6826 low as a correction. And, as long as 38.2% retracement of 0.9504 to 0.6826 at 0.7849 holds, long term down trend from 1.1079 is expected to resume sooner or later. Break of 0.6826 low will target 0.6008 key support level. However, firm break of 0.7849 will indicate that rise from 0.6826 is developing into a medium term rebound, rather than a sideway pattern. In such case, stronger rise should be seen to 55 month EMA (now at 0.8144) and above.
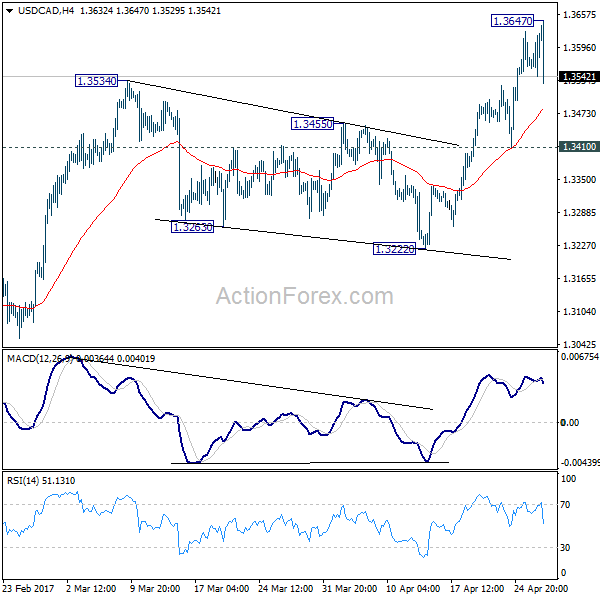
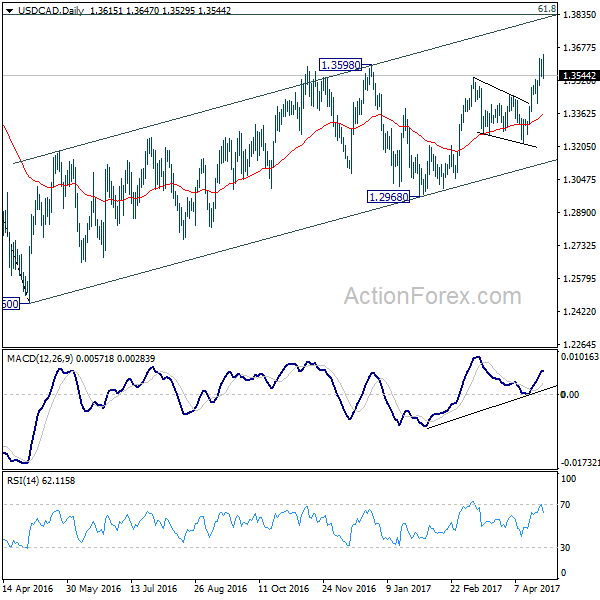
USD/CAD Daily Outlook
Daily Pivots: (S1) 1.3568; (P) 1.3568; (R1) 1.3647; More....
A temporary top is in place at 1.3647 after USD/CAD fails to sustain above 1.3598 key resistance. Intraday bias is turned neutral first. Some consolidations should be seen but downside of retreat would be contained by 1.3410 support to bring another rally. Break of 1.3647 will extend the whole medium rise from 1.2460 to next medium term fibonacci level at 1.3838. However, break of 1.3410 will turn bias back to the downside for 1.3222 support instead.
In the bigger picture, price actions from 1.4689 medium term top are seen as a correction pattern. The first leg has completed at 1.2460. The second leg from 1.2460 is likely still in progress and could target 61.8% retracement of 1.4689 to 1.2460 at 1.3838. We'd look for reversal signal there to start the third leg. However, break of 1.2968 will argue that the third leg has already started and should at least bring a retest of 1.2460 low. Meanwhile, sustained trading above 1.3838 would pave the way to retest 1.4689 high.