Sample Category Title
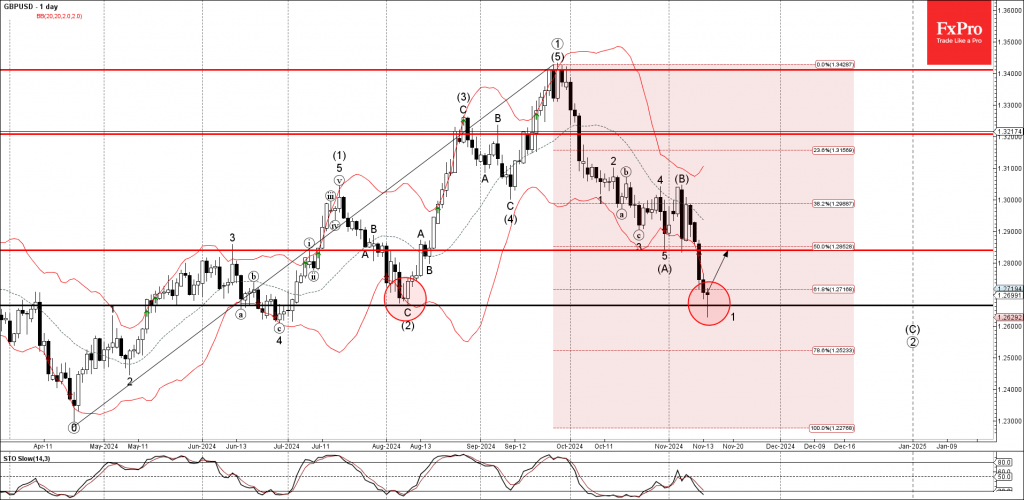
GBPUSD Wave Analysis
- GBPUSD reversed from strong support level 1.2665
- Likely to rise to resistance level 1.2840
GBPUSD currency pair recently reversed up from the strong support level 1.2665 (former monthly low from August), standing close to the lower daily Bollinger Band and the 61.8% Fibonacci correction of the upward impulse from April.
The upward reversal from the support level 1.2665 created the daily Japanese candlesticks reversal pattern Hammer Doji.
Given the strength of the support level 1.2665 and the oversold daily Stochastic, GBPUSD currency pair can be expected to rise to the next resistance level 1.2840, former support from the end of October.
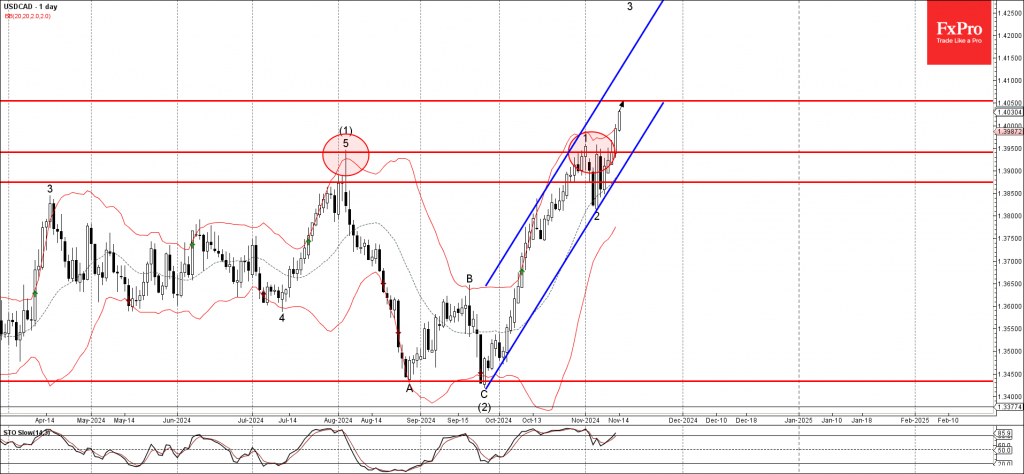
USDCAD Wave Analysis 14
- USDCAD broke resistance level 1.3950
- Likely to rise to resistance level 1.4050
USDCAD currency pair rising strongly after the earlier breakout of the resistance level 1.3950 (former multi-month high from August).
The breakout of the resistance level 1.3950 accelerated the active short-term impulse wav 3 of the higher order impulse wave (3) from the end of September.
Given the continuation of the bullish US dollar sentiment seen across the FX markets today, USDCAD currency pair can be expected to rise to the next resistance level 1.4050.
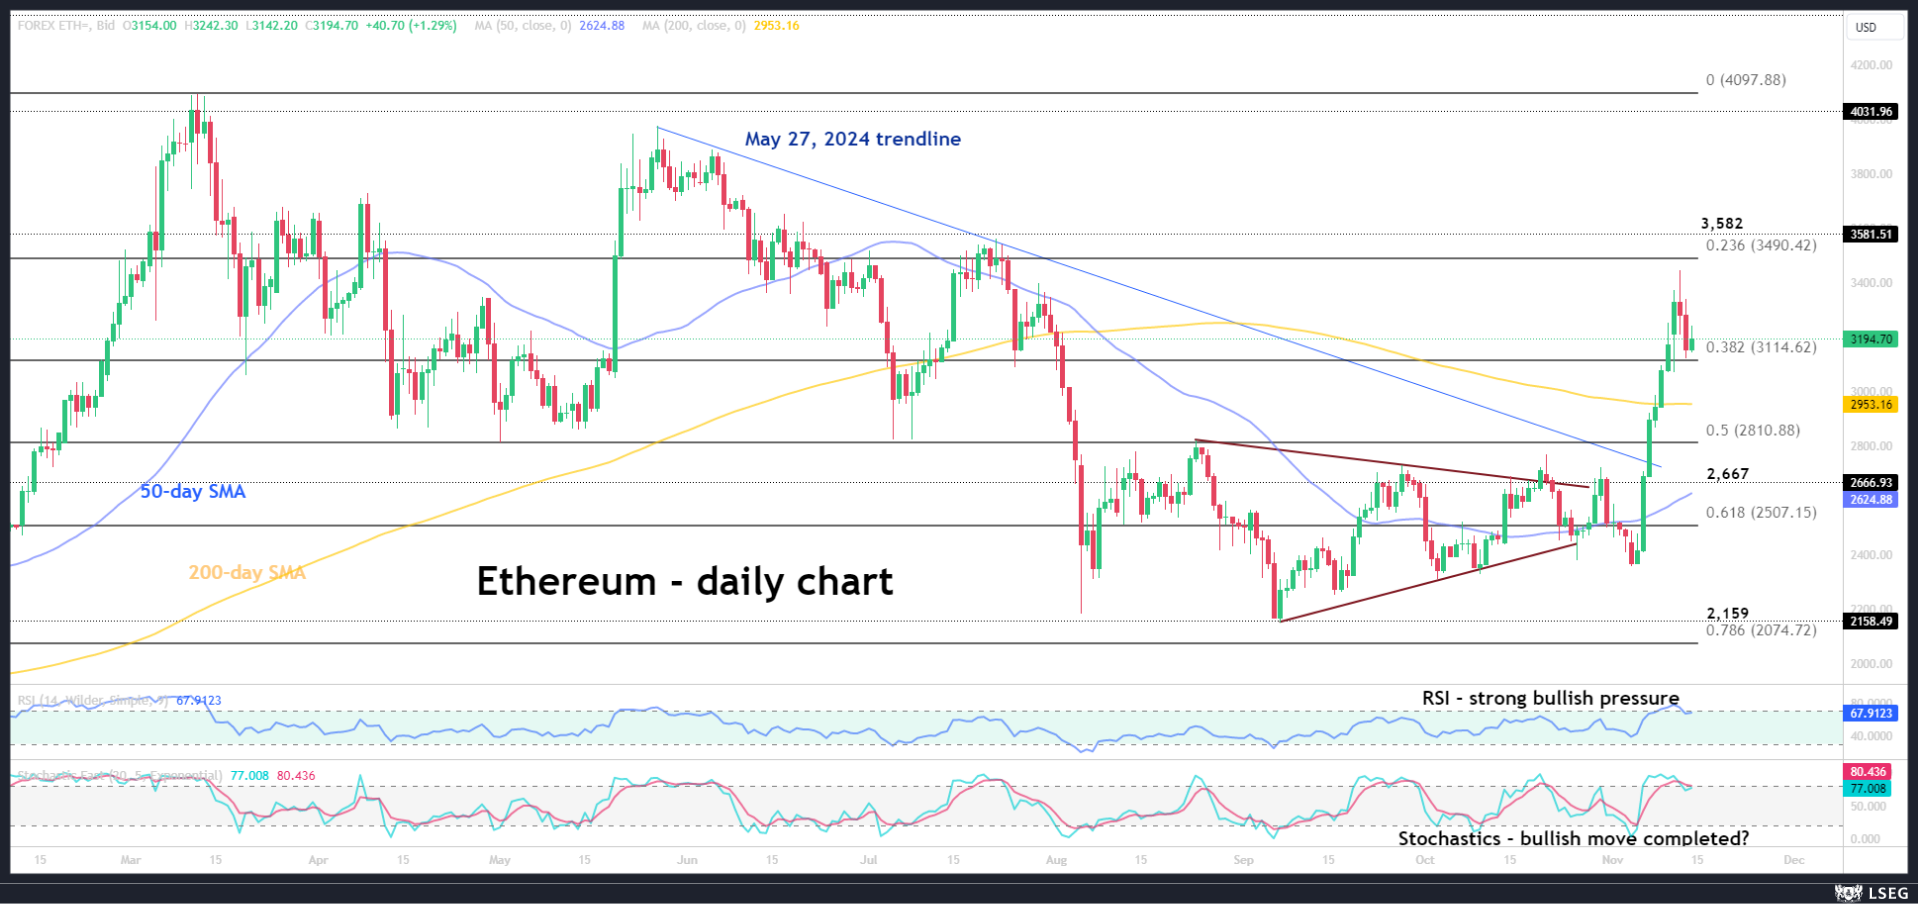
Ethereum Rally Takes a Breather
- Ethereum hovers above a key support level
- Profit-taking put a stop to the recent rally
- Momentum indicators could turn bearish soon
Ethereum has benefited from Trump’s win, reaching a four-month high, but it failed to close above the 3,500 level and thus remains quite far from its March 2024 high. The 20% post-US election rally triggered some profit-taking, pushing ethereum lower towards the 3,114 area. The short-term trend, though, remains bullish.
Meanwhile, the momentum indicators could be close to turning bearish. The RSI is edging lower, thus pointing to weaker bullish pressure in ethereum. Interestingly, the stochastic oscillator has dropped below both its overbought area (OB) and moving average. Should the stochastic oscillator fail to return inside the OB area, and instead it resumes its descent, it would be seen as a strong bearish signal.
Should the bulls remain confident, they would try to keep ethereum above the 38.2% Fibonacci retracement level of the October 13, 2023 – March 12, 2024 uptrend at 3,115, and then gradually push its towards the 3,490 level. If successful, and assuming that the April 2022 high at 3,582 is easily surmounted, the path could then be open for a move towards the 4,000 area.
On the other hand, the bears will try to regain the upper hand. A move below 3,115 could be the first step of a more protracted move lower. The bears could then test the resistance set by the 200-day simple moving average (SMA) at 2,953, which currently stands a tad above the 50% Fibonacci retracement at 2,811.
To conclude, ethereum’s post-US election rally has temporarily paused, with the world’s second biggest cryptocurrency trading above a key support level.
Crypto: Tug-of-War at New Altitude
Market Picture
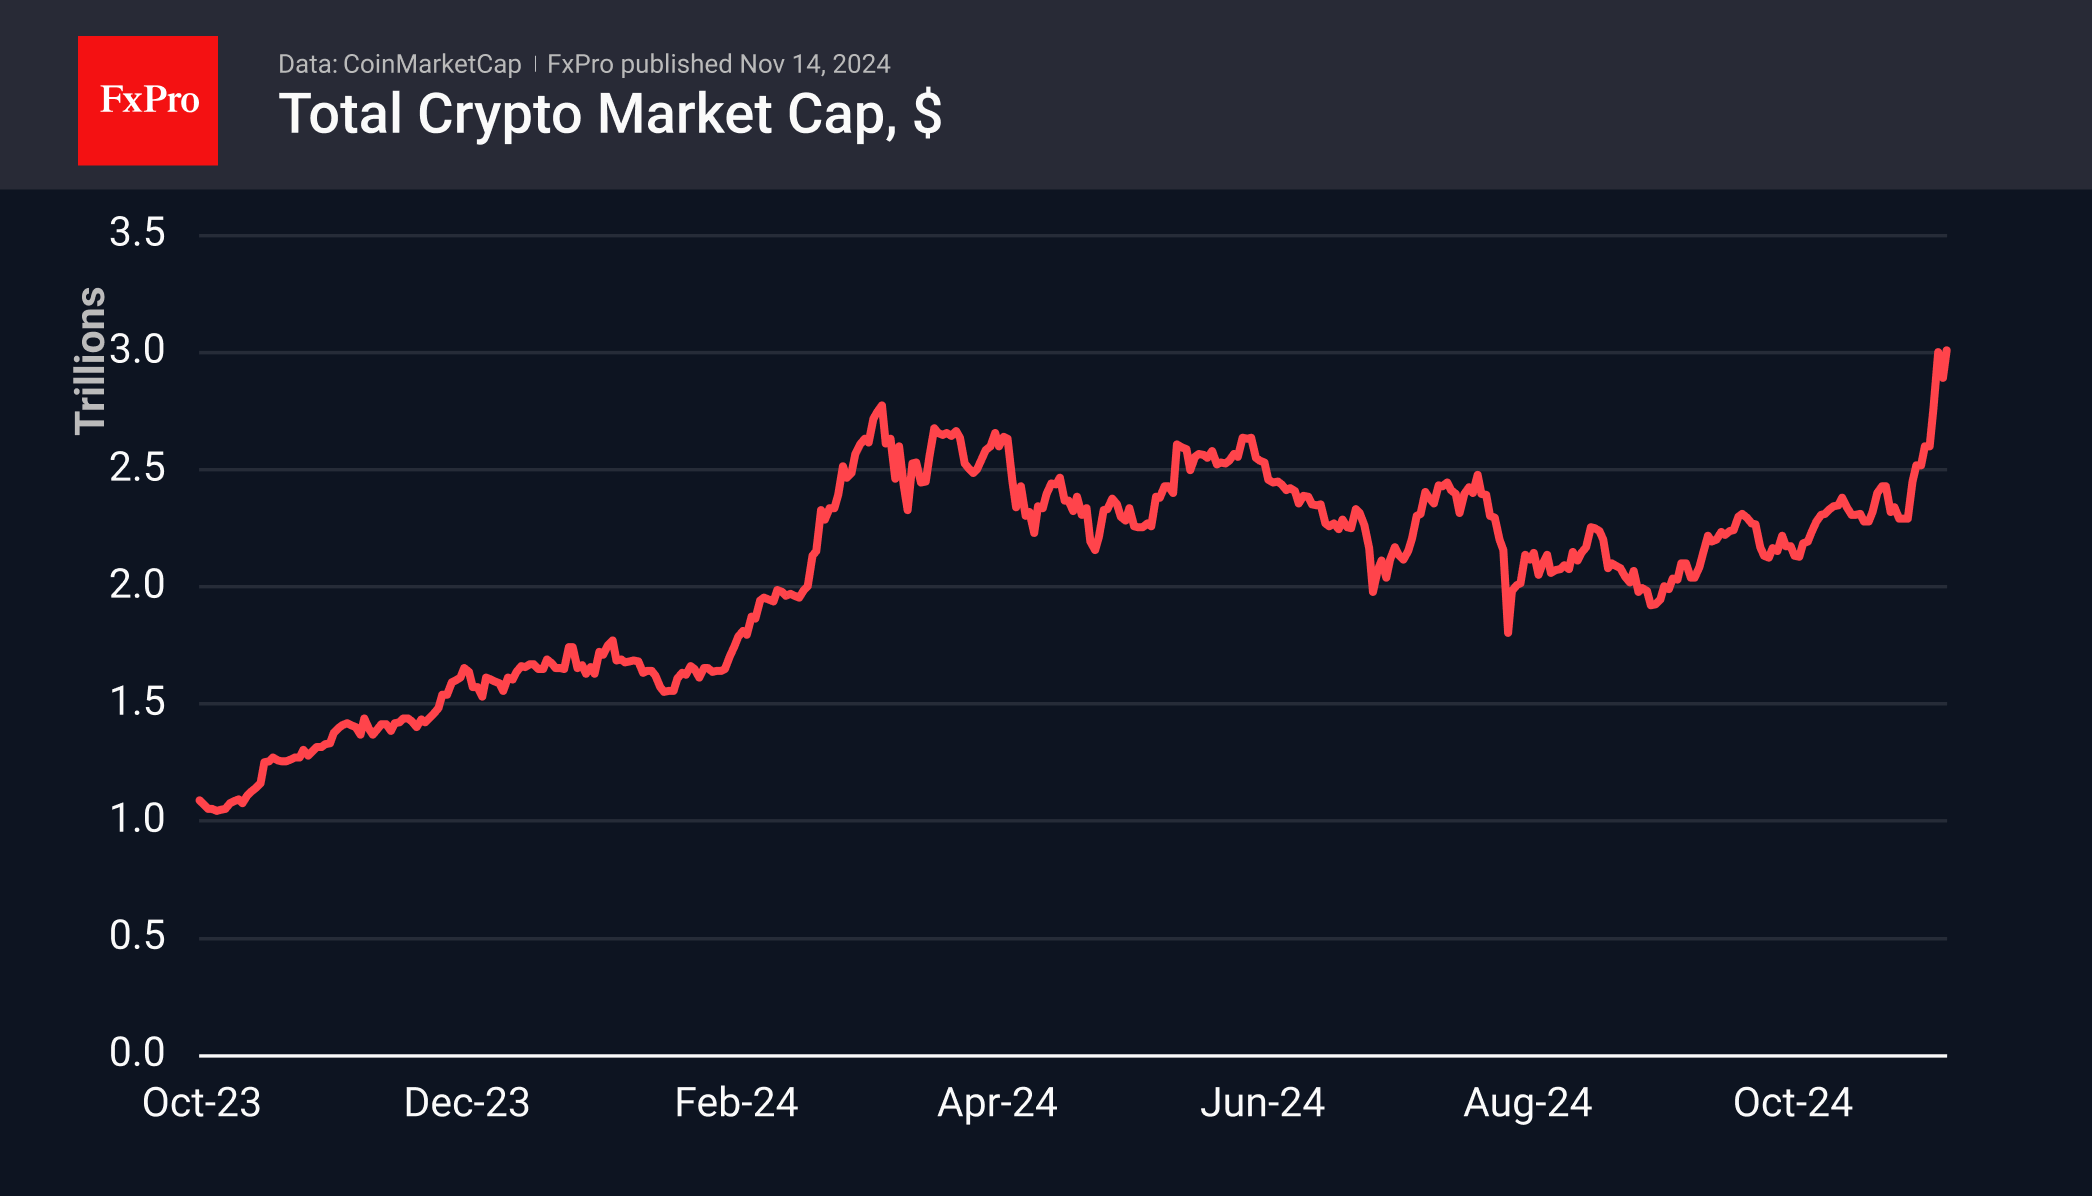
Cryptocurrencies continued to surge, pushing the total capitalisation of this market to a new high of $3 trillion. It was just $2.2 trillion on November 5th. In other words, over 10 days, the increase was more than 35%.
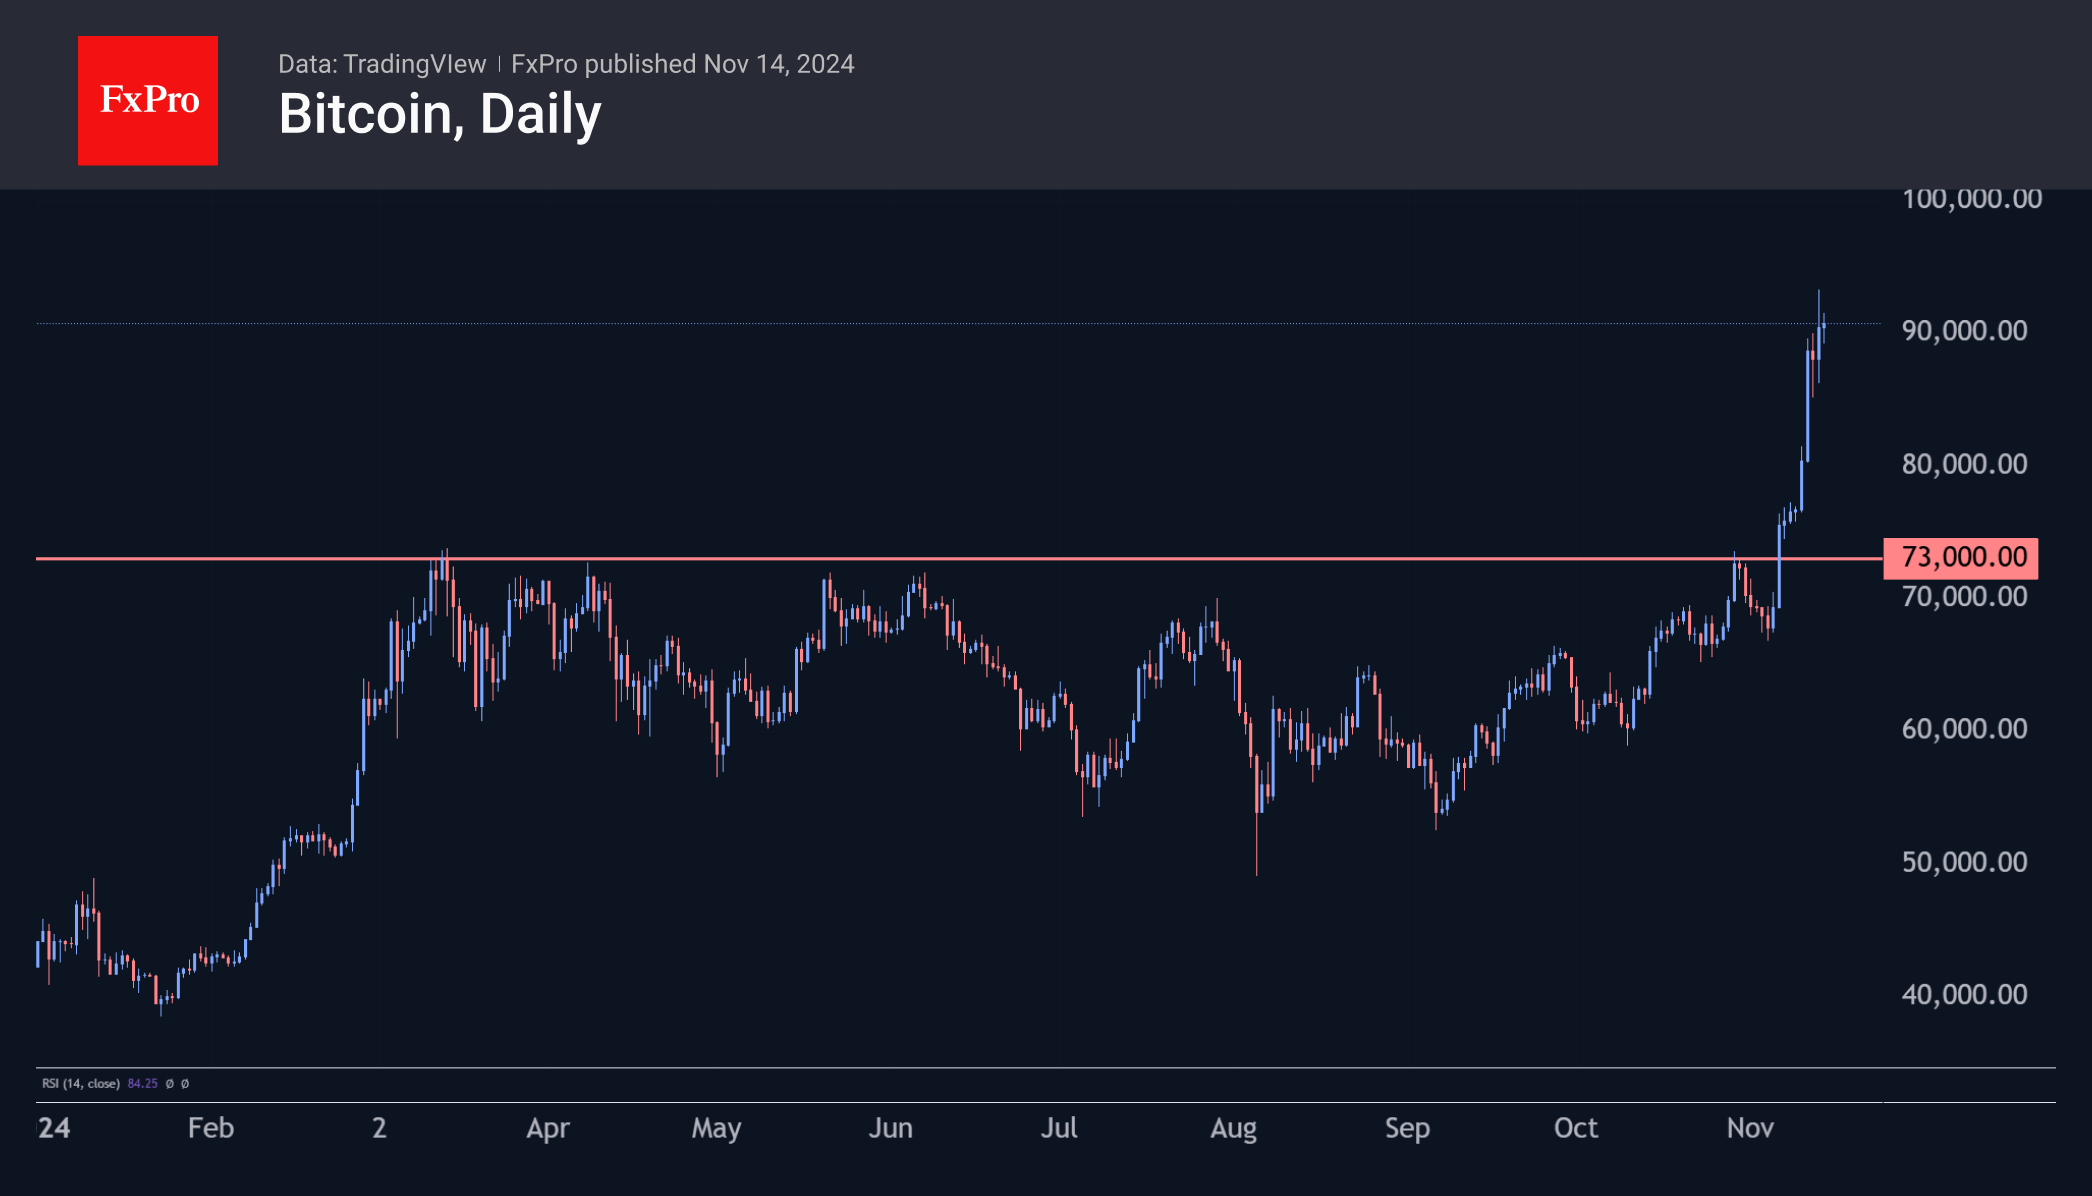
Bitcoin has gained nearly 20% since the start of the week, barely slowing at the $80K mark. It wasn’t until it approached $90K that we saw any significant shakeout of positions. On Wednesday, Bitcoin stormed to $93K, but after 4 hours, it was at $88K. We also saw a similar intraday range of over 5% on Tuesday.
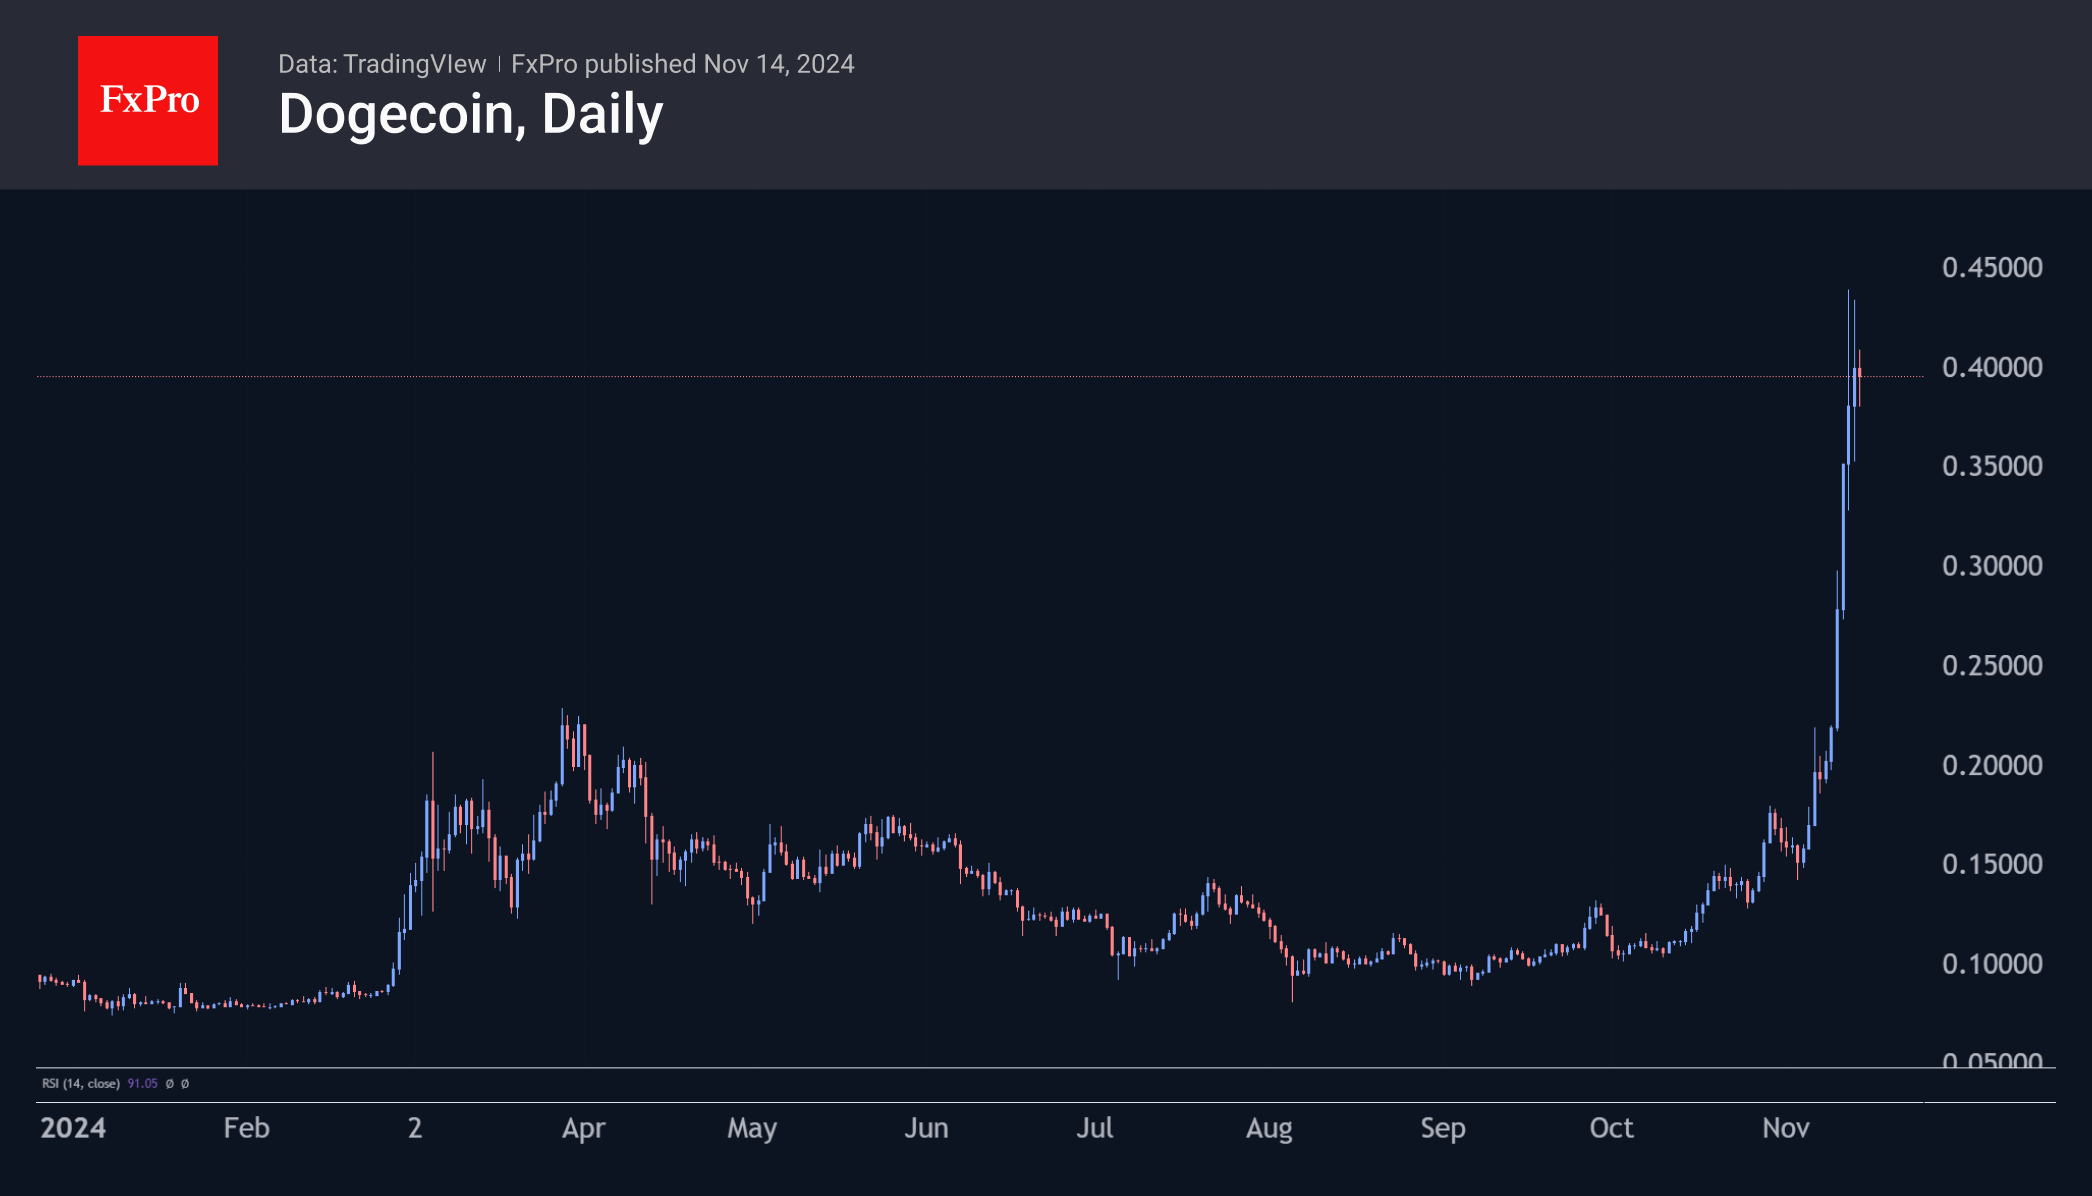
At these levels, more and more crypto enthusiasts are switching to looking for interesting altcoins as they lock in profits in the first cryptocurrency. The easiest choice is Dogecoin, which has gained over 200% from the lows of November 3rd to the present. Given bitcoin’s 60% share of the total crypto market capitalisation, which we last saw in 2021, the altcoin season has yet to begin.
Elon Musk has joined forces with former presidential candidate Vivek Ramaswamy to lead the US government’s new Department of Government Efficiency (DOGE). The idea for DOGE was first floated in August during Musk’s interview with Donald Trump. While it has nothing to do with the cryptocurrency itself, mentions of the word are supporting the rise in price of Dogecoin, which became the first major meme coin and was created as a joke.
News Background
Glassnode notes that realised profits for both short—and long-term holders of Bitcoin remain below previous peaks at the all-time high (ATH). In such circumstances, many investors are willing to wait for higher prices to lock in profits.
According to Bitwise CIO Matt Hougan, the first cryptocurrency will remain in the “early stages” and will only enter the maturity phase when it reaches $500K. Until Bitcoin equals gold and becomes a familiar asset for central banks and institutional investors, it will remain in the “early stage.”
ConsenSys CEO Joseph Lubin said Ethereum “stands to gain more than any other cryptocurrency” from Donald Trump’s victory in the US presidential election. He attributed this to ETH’s greater ‘maturity’ compared to its competitors.
The Italian government will increase the capital gains tax on cryptocurrencies to 28%, down from the previously proposed 42%. From 2023, the country’s citizens will be obliged to pay 26% to the state if the profit from cryptocurrencies exceeds €2,000.
Sunset Market Commentary
Markets
More dollar strength pulled EUR/USD to a first 1.05-quote since October 2023, but that level triggered some rebound action higher. It’s only a matter of time though for a test (and potential) break of the 1.0448 range bottom in place since 2023. Next support levels stand at 1.0406 and 1.0201 which are respectively 50% and 62% retracement on EUR/USD’s bounce from 0.9536 to 1.1276 in 2022-2023. The trade-weighted dollar touched 107 with the 2023-top at 107.35 being the near-term technical reference. USD/JPY changes hands at 156, making way to the 160 potential intervention area. The Ministry of Finance conducted FX purchases both in April and in July after passing this threshold. Fed governor Kugler - labelled amongst the most dovish FOMC members together with governor Cook, Chicago Fed Goolsbee and Philly Fed Harker on Bloomberg’s hawk-dove spectrometer - said that the Fed must focus on both inflation and jobs goals. “If any risks arise that stall progress or reaccelerate inflation, it would be appropriate to pause our policy rate cuts,” she said. “But if the labor market slows down suddenly, it would be appropriate to continue to gradually reduce the policy rate.” Kugler’s comments seem to be skewing to the upside inflation risks (stubborn housing inflation and high inflation in certain goods and services) which obviously carries some weight given her more dovish status. US eco data played second fiddle with weekly jobless claims and producer prices squeezed in between yesterday’s CPI data and tomorrow’s retail sales. Weekly claims continue to hover at low levels (217k from 221k). Headline PPI rose by 0.2% M/M as expected, following an upwardly revised 0.1% in September. Core PPI excluding volatile food and energy categories climbed 0.3% M/M and 3.1% Y/Y (vs consensus of +0.2% M/M and 3% Y/Y). Both services costs and goods prices rose by 0.3% in October. The data triggered a tick lower in US Treasuries, but the magnitude was smaller than the past days’ declines and like in the dollar was met with a countermove following one-way traffic. Daily changes on the US yield curve currently range between -5.9 bps and -3.6 bps with the wings of the curve outperforming the belly. German Bunds outperformed again, especially at the front end of the curve (2-yr yield -5.6 bps). We retain some interesting comments coming from Minutes of the October ECB meeting, pointing out that the disinflationary process was gathering steam with initials improvements in services as well. The ECB stance might approach neutral levels earlier than thought, cementing at least another 25 bps rate cut in December.
News & Views
In its November monthly report the International Energy Agency (IEA) forecasts world oil demand to rise by 920k b/d this year and just shy of an additional 1m b/d in 2025 (2024 102.8 mb/d, 2025 103.8 mb/d). The slowdown in growth from recent years reflects the end of the post-pandemic pent-up demand and below-par underlying global economic conditions, as well as clean energy technology deployment, the IEA assesses. This slowdown in growth compares to a growth of close to 2m b/d last year and 1.2 m b/d on average over the 2000-2019 period. China’s marked slowdown has been the main drag on demand, with 2024 growth to average just a tenth of the 1.4m b/d increase in 2023. Regarding the demand-supply balance, the IEA expects ongoing healthy supply growth. It expects non-OPEC supply growth at 1.5m b/d this year and next year, mainly driven by US production alongside higher output from Canada, Gyana and Argentina. OPEC+ postponed a scheduled increase of 180k b/d earlier this month and will reassess its policy at a meeting early December. However, even in a scenario where OPEC+ cuts remain in place, IEA expects global supply to exceed demand by more than 1m b/d next year.
Polish GDP growth unexpectedly contracted by 0.2% Q/Q in Q3, bringing the Y/Y-growth to 2.7%. Q2 growth was strong at 1.2% Q/Q and 3.2% Y/Y. The consensus expected Q3 growth at 0.3% Q/Q. The office didn’t release any details yet. A more in depth/detail release will be published on November 28. Poor retail sales data suggest a weak performance of private consumption. The National Bank of Poland recently indicated that uncertainty on the path of inflation probably will provide little to no room to cut the policy rate before March next year. MPC member Wnorowski today reconfirmed that the NBP could start to discuss rate cuts in Q1. Even so, the Polish 2-y yield today declined slightly more than regional peers (- 8 bps to 4.98%). The zloty held strong as EUR/PLN eased from near 4.3325.
USD/JPY Mid-Day Outlook
Daily Pivots: (S1) 154.67; (P) 155.15; (R1) 155.95; More...
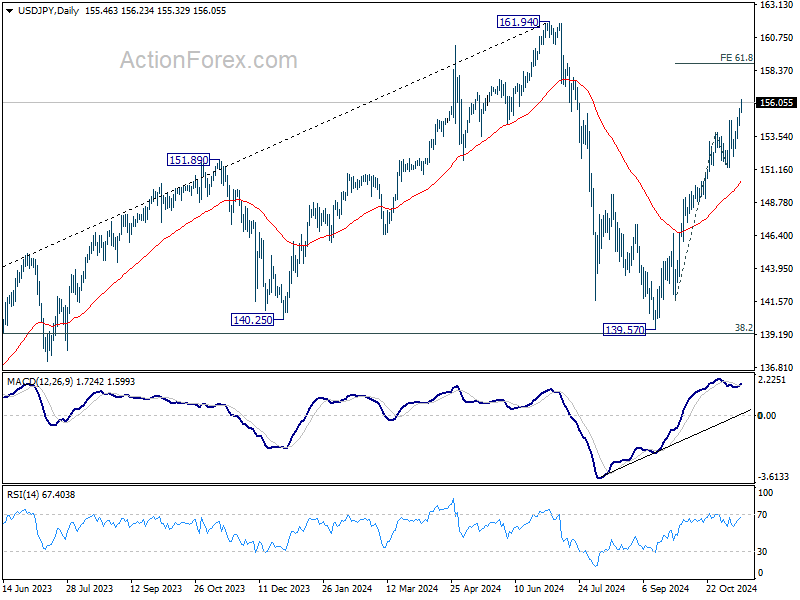
Intraday bias in USD/JPY remain son the upside at this point. Current rally from 139.57 should target 61.8% projection of 141.63 to 153.87 from 151.27 at 158.8. On the downside, below 153.40 minor support will turn intraday bias neutral again first. But near term outlook will remain bullish as long as 151.27 support holds, in case of retreat.
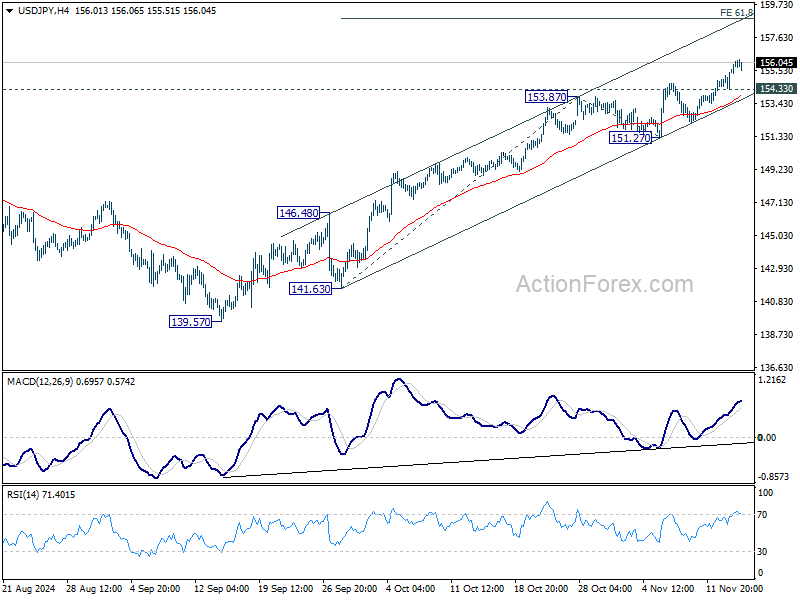
In the bigger picture, price actions from 161.94 are seen as a corrective pattern to rise from 102.58 (2021 low). The range of medium term consolidation should be set between 38.2% retracement of 102.58 to 161.94 at 139.26 and 161.94. Nevertheless, sustained break of 139.26 would open up deeper medium term decline to 61.8% retracement at 125.25.
USD/CHF Mid-Day Outlook
Daily Pivots: (S1) 0.8817; (P) 0.8841; (R1) 0.8883; More…
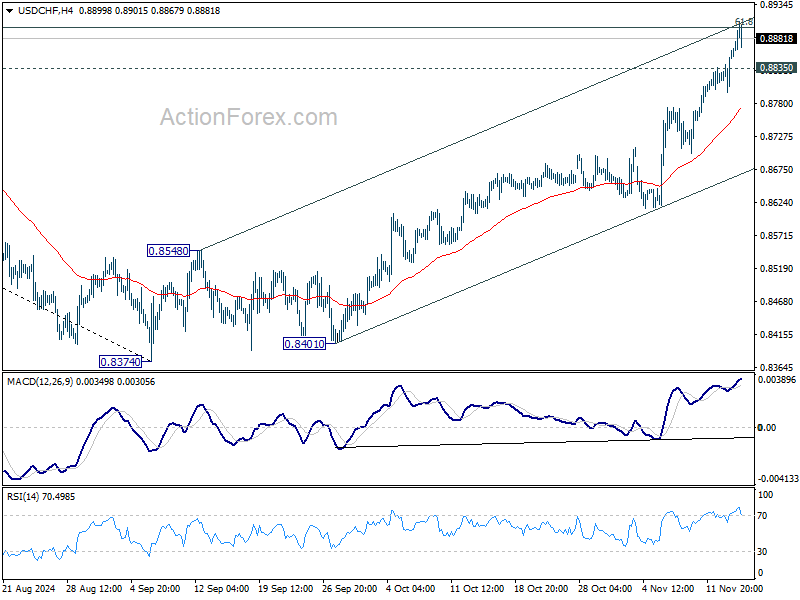
Intraday bias in USD/CHF remains on the upside for the moment. Sustained break of 61.8% retracement of 0.9223 to 0.8374 at 0.8899 will pave the way to 0.9223 high. On the downside, below 0.8835 minor support will turn intraday bias neutral and bring consolidations, before staging another rally.
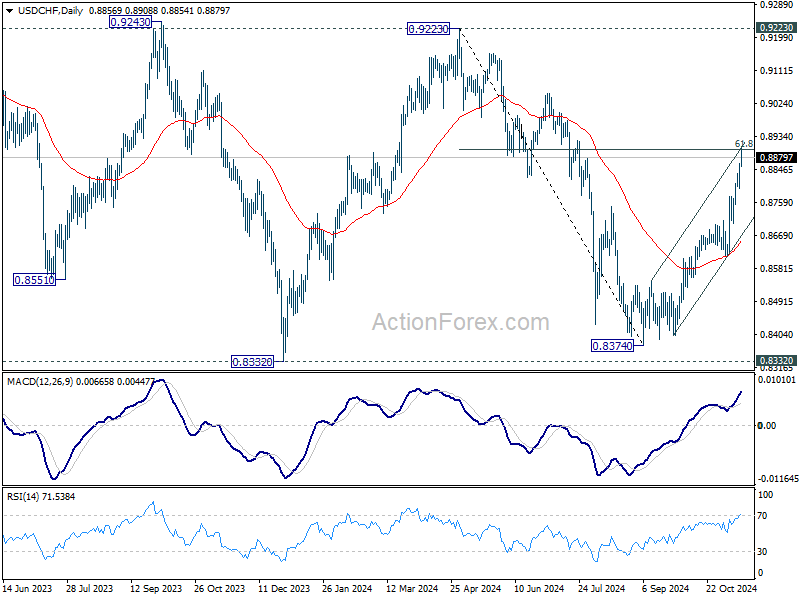
In the bigger picture, price actions from 0.8332 (2023 low) are currently seen as a medium term corrective pattern. Rise from 0.8374 is seen as the third leg. Overall outlook will continue to stay bearish as long as 0.9223 resistance holds. Break of 0.8332 low is in favor at a later stage when the consolidation completes.
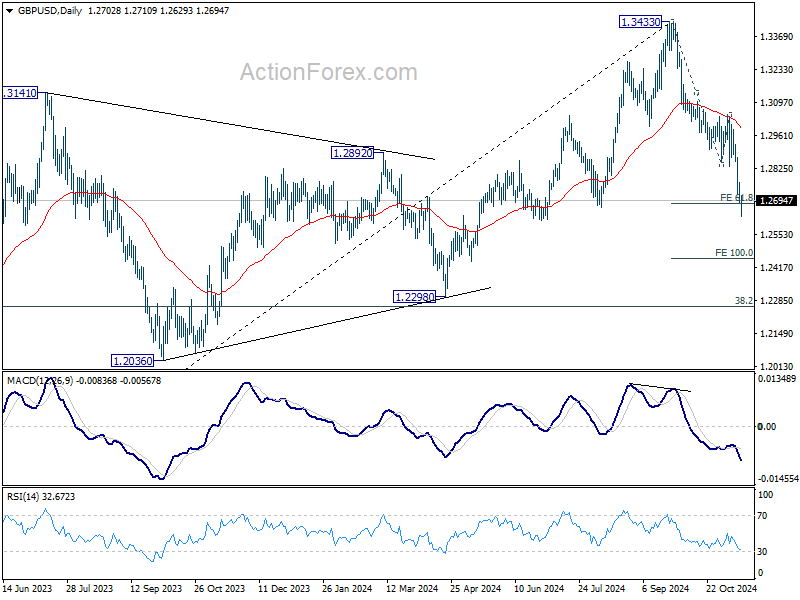
GBP/USD Mid-Day Outlook
Daily Pivots: (S1) 1.2673; (P) 1.2721; (R1) 1.2757; More...
Intraday bias in GBP/USD remains on the downside for the moment. Current fall from 1.3433 should target 100% projection of 1.3433 to 1.2842 to 1.3047 at 1.2456. On the upside, above 1.2768 minor resistance will turn intraday bias neutral first. But outlook will stay bearish as long as 13047 resistance holds, in case of recovery.
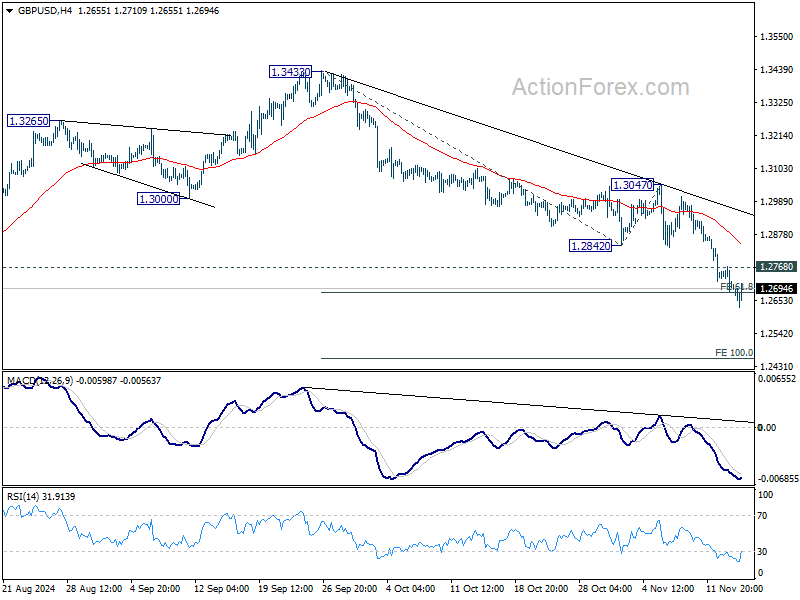
In the bigger picture, considering mildly bearish divergence condition in D MACD, a medium term top is likely in place at 1.3433 already. Price actions from there are seen as correction to whole up trend from 1.0351 (2022 low). Deeper decline would be seen to 38.2% retracement of 1.0351 to 1.3433 at 1.2256, which is close to 1.2298 structural support. Strong support should be seen there to bring rebound.
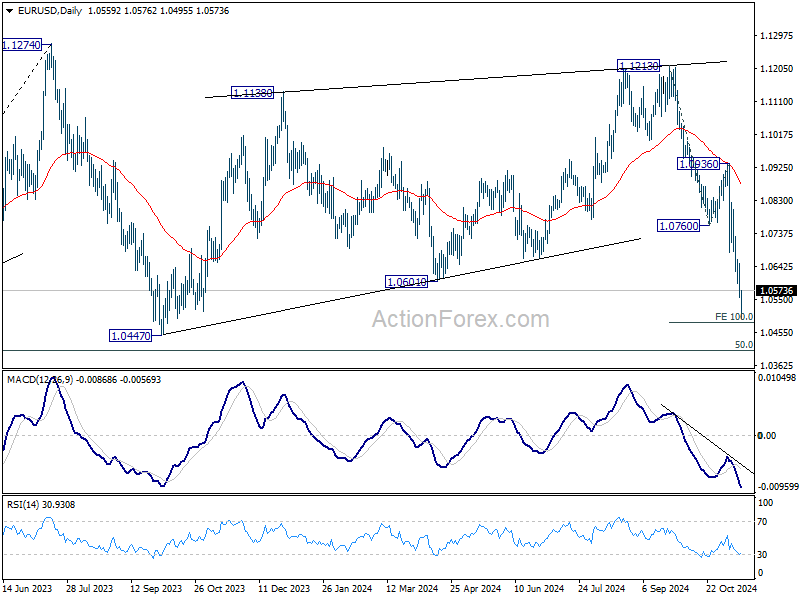
EUR/USD Mid-Day Outlook
Daily Pivots: (S1) 1.0529; (P) 1.0591; (R1) 1.0627; More...
Intraday bias in EUR/USD stays on the downside for now, as fall from 1.1213 is in progress for 100% projection of 1.1213 to 1.0760 from 1.0936 at 1.0483. Break there will target 1.0404 key fibonacci level. On the upside, above 1.0594 minor resistance will turn intraday bias neutral again and bring consolidations. But outlook will stay bearish as long as 1.0760 support turned resistance holds, in case of recovery.
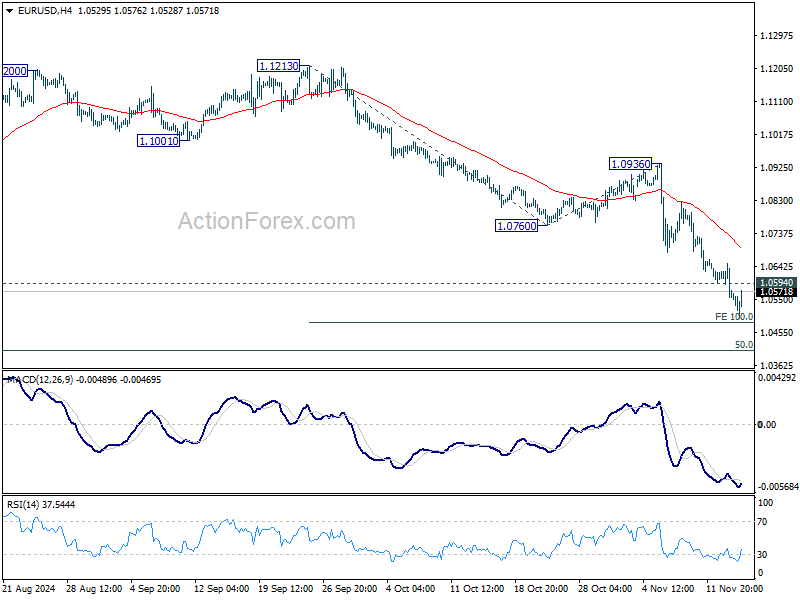
In the bigger picture, price actions from 1.1274 (2023 high) are seen as a consolidation pattern to up trend from 0.9534 (2022 low), with fall from 1.1213 as the third leg. Downside should be contained by 50% retracement of 0.9534 (2022 low) to 1.1274 at 1.0404, to bring up trend resumption at a later stage.