Sample Category Title
Dollar Gains Capped by 10-Year Yield’s Struggle with Critical Resistance Level
While Dollar extends recent gains following stronger than expected PPI data in early US session, it's upward momentum was somewhat capped by the retreat in treasury yields as their correlation continues. Nevertheless, the greenback is still staying as the strongest one for the day and the week. It remains to be seen if there is sustainable selling, or profit-taking, to indicate that the greenback has topped.
For now, Yen remains the worst performer for the week. The unusually quietness of Japanese authorities suggests that they might allow Yen to depreciate further towards 160 mark before coming back for verbal intervention again. Sterling is currently the second worst, followed by Aussie. On the other hand, Canadian Dollar is the second best, followed by Swiss Franc. Euro and Kiwi are positioning in the middle.
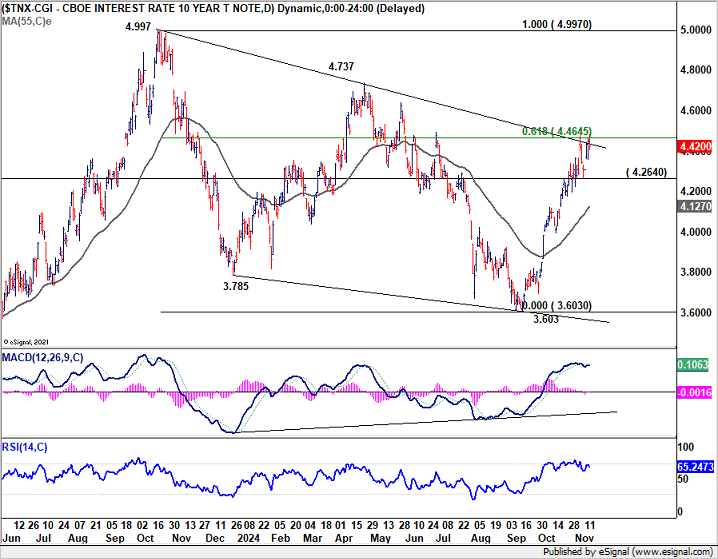
Technically, US 10-year yield is still struggling to break through 61.8% retracement of 4.997 to 3.603 at 4.465, as well as medium term falling trendline decisively. There is still prospect of a near term pull back. Break of 4.264 support will bring deeper fall back to 55 D EMA (now at 4.127). If that happens, it would be accompanied by corresponding correction in Dollar.
In Europe, at the time of writing, FTSE is up 0.51% DAX is up 1.48%. CAC is up 1.38%. UK 10-year yield is down -0.0178 at 4.505. Germany 10-year yield is down -0.037 at 2.359. Earlier in Asia, Nikkei fell -0.48%. Hong Kong HSI fell -1.96%. China Shanghai SSE fell -1.73%. Singapore Strait Times rose 0.48%. Japan 10-year JGB yield rose 0.0214 to 1.063.
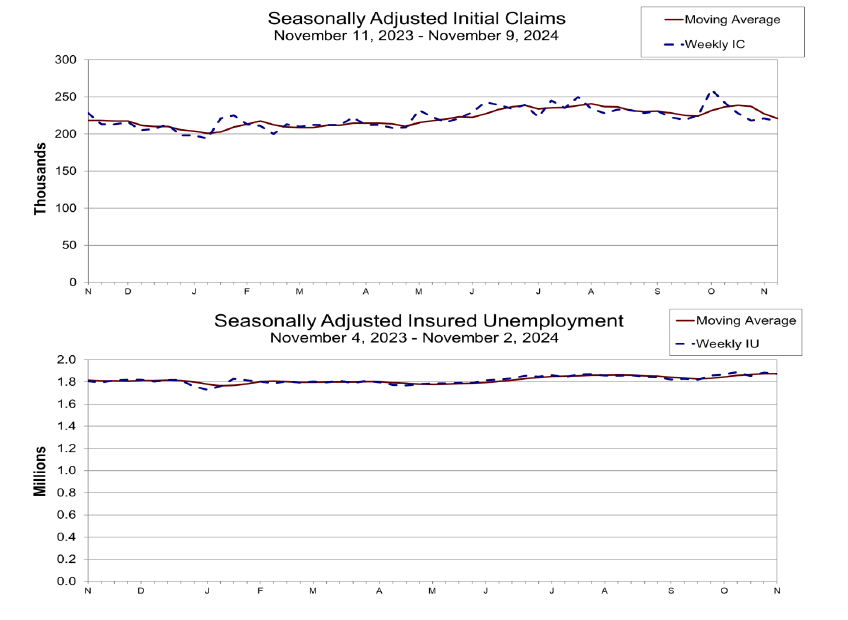
US initial jobless claims falls to 217k vs exp 224k
US initial jobless claims fell -4k to 217k in the week ending November 9, below expectation of 224k. Four-week moving average of initial claims fell -6k to 221k.
Continuing claims fell -11k to 1873k in the week ending November 2. Four-week moving average of continuing claims rose 1k to 1875k, highest since November 27, 2021.
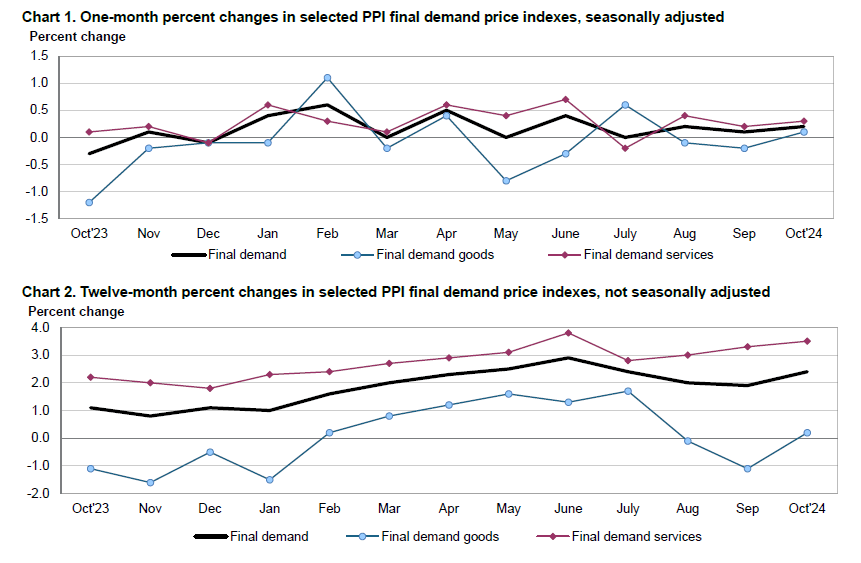
US PPI up 0.2% mom, 2.4% yoy in Oct
US PPI for final demand rose 0.2% mom in October, matched expectations. Most of the rise can be traced to a 0.3% mom advance services. Prices of goods inched up 0.1% mom. PPI less foods, energy, and trade services increased 0.3% mom.
For the 12 month period, PPI accelerated notably from 1.9% yoy to 2.4% yoy, above expectation of 2.3% yoy. PPI less foods, energy, and trade services rose 3.5% yoy, up from prior month's 3.3% yoy.
Fed’s Kugler notes significant disinflation amid steady cooling in labor market
In a speech today, Fed Governor Adriana Kugler said the US sees "considerable disinflation" paired with a "cooling" yet "resilient" labor market. This dual scenario means Fed must continue "paying attention to both sides of our mandate," referring to price stability and maximum employment.
On the inflation side, Kugler acknowledged recent moderation in wage growth and inflation expectations, noting these factors support further progress on inflation. However, she cautioned that persistent inflation in housing and specific goods and services sectors could "stall progress".
Meanwhile, she highlighted rebalancing in the labor market, attributing this to increased labor supply from immigration and a stronger pool of prime-age workers, alongside lower demand resulting from tight monetary policy.
Kugler indicated that if risks arise that impede progress or cause inflation to reaccelerate, it would be appropriate to pause policy rate cuts. Conversely, if the labor market slows down suddenly, Fed should consider continuing to gradually reduce the policy rate.
ECB accounts: Earlier path to 2% inflation, downside risks increase
In reviewing the October meeting accounts, ECB policymakers broadly agreed that the disinflationary trend in the Eurozone is progressing "well on track".
While "upside risks" to inflation persist, they are now viewed as less significant, whereas "downside risks" have increased, influenced by slower economic activity.
This shift in balance suggests that inflation may reach the 2% target "somewhat earlier" than anticipated, with projections potentially indicating a lower inflation rate in 2025 than previously forecast.
Divergent views emerged regarding the precise impact of weaker economic growth on inflation, with members agreeing to revisit a more detailed assessment in December when updated projections become available.
A critical element behind the decision to cut rates was "risk management." Members widely agreed that if the current economic slowdown proves "temporary", cutting rates now could be seen as "having brought forward" a December cut. However, if data reveals "persistent weakness," the move would constitute a "timely adjustment".
In light of this economic environment, ECB Governing Council reached a consensus to lower rates by 25 basis points.
ECB’s de Guindos: Inflation easing, but growth falls short of expectations
ECB Vice President Luis de Guindos shared a mixed outlook today, highlighting progress in inflation but tempered growth prospects.
“There’s good news with inflation and not so good news on economic growth,” he remarked, noting ECB’s expectation that services inflation will ease over the coming months.
De Guindos added that inflation is expected to “converge in a clear and stable manner towards price stability, 2%,” a target that reinforces the bank’s commitment to maintaining price control.
On the economic front, de Guindos admitted "recovery we were anticipating is not happening with the intensity we expected". Although household incomes have seen some improvement, it has yet to translate into stronger consumer spending.
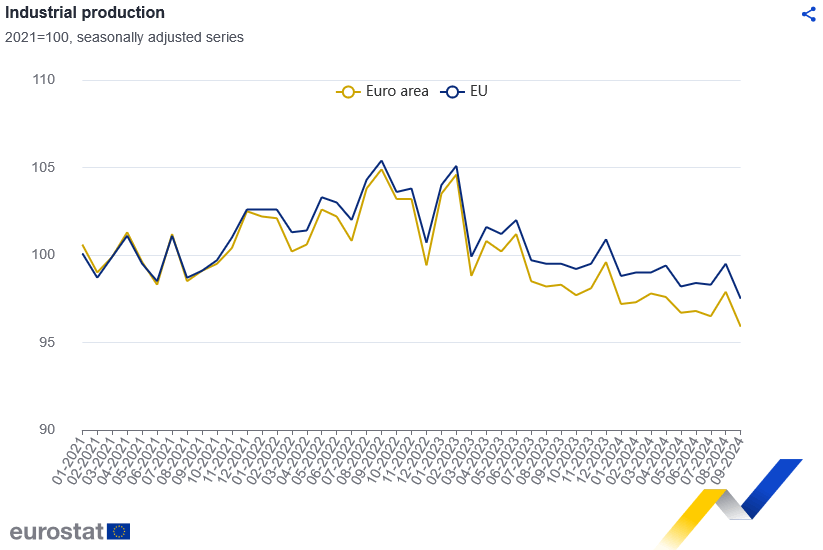
Eurozone industrial production falls -2.0% mom in Sep, EU down -2.0% mom too
Eurozone industrial production dropped significantly by -2.0% mom in September, underperforming market expectations of a -1.2% mom decline. Production for capital goods took a steep hit, falling by -3.8% mom, while energy output also dropped by -1.5% mom. Intermediate goods production stayed flat, and non-durable consumer goods saw increase of 1.6% mom, along with smaller rise of 0.5% mom in durable consumer goods.
The broader EU recorded a matching -2.0% mom fall in industrial output, with notable declines in countries like Ireland (-10.7%), Denmark (-5.0%), and the Netherlands (-2.9%). On the upside, Croatia, Portugal, and Slovenia saw increases of 5.8%, 2.7%, and 1.6%, respectively, although these gains were not enough to offset the overall downturn.
RBA's Bullock: Policy to stay restrictive until demand cools to sustainable levels
RBA Governor Michele Bullock commented at a panel discussion today on Australia's economic and labor market conditions, noting that the economy is still operating at a level that risks fueling inflation.
According to Bullock, while labor market tightness has eased slightly, “it’s still not easy to get staff,” indicating persistent hiring challenges for businesses.
Bullock attributed the resilience in the job market to strong "demand" and "population growth". These factors, she noted, continue to support employment levels despite some easing in labor market constraints.
Comparing RBA’s policy stance with other central banks, Bullock remarked that while others have already moved to lower rates, RBA remains "not as restrictive."
Nevertheless, she emphasized that the bank considers its policy "restrictive enough" to address inflation risks and is committed to maintaining this stance until there’s clear evidence of a sustained "downward trajectory in demand."
Australia's employment growth 15.9k in Oct, slowest rate in recent months
Australia's employment grew modestly in October, rising by 15.9k or 0.1% mom, falling short of the anticipated 25k increase. This represents the slowest pace of employment growth in recent months, following a period of more robust gains averaging 0.3% per month over the last six months. Full-time positions rose by 9.7k, while part-time jobs increased by 6.2k, both contributing to the incremental rise.
Unemployment rate remained steady at 4.1%, matching expectations, although the participation rate saw a slight dip from 67.2% to 67.1%. The number of unemployed rose by 1.3% mom, adding 8.3k to the job-seeking pool. In terms of labor utilization, monthly hours worked inched up by 0.1% mom, reflecting only minimal expansion in total labor demand.
This marks the third consecutive month with an unemployment rate of 4.1%, which stands 0.6% points higher than June 2023 low of 3.5%. Nonetheless, this rate remains 1.1% below the pre-pandemic level of 5.2% in March 2020.
The deceleration in employment growth could indicate a stabilizing labor market, aligning with recent RBA commentary on maintaining a restrictive policy stance until clear demand cooling is observed.
EUR/USD Mid-Day Outlook
Daily Pivots: (S1) 1.0529; (P) 1.0591; (R1) 1.0627; More...
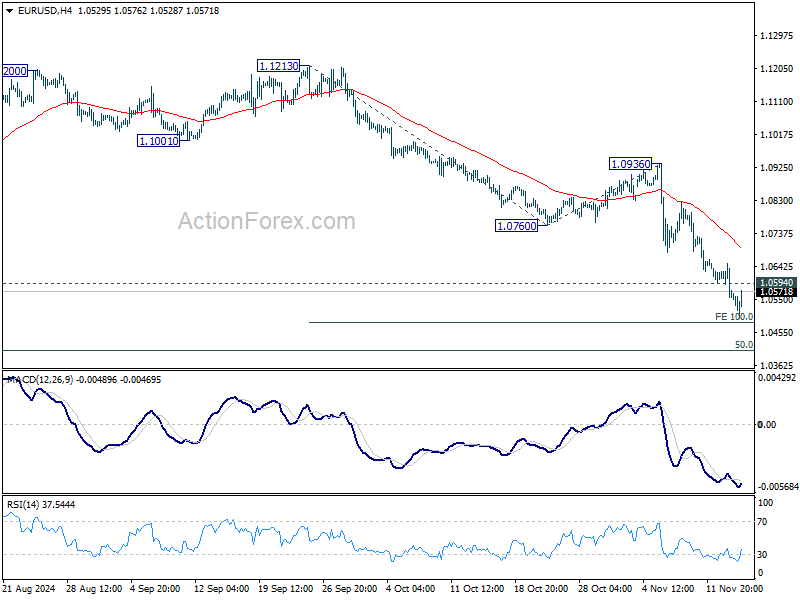
Intraday bias in EUR/USD stays on the downside for now, as fall from 1.1213 is in progress for 100% projection of 1.1213 to 1.0760 from 1.0936 at 1.0483. Break there will target 1.0404 key fibonacci level. On the upside, above 1.0594 minor resistance will turn intraday bias neutral again and bring consolidations. But outlook will stay bearish as long as 1.0760 support turned resistance holds, in case of recovery.
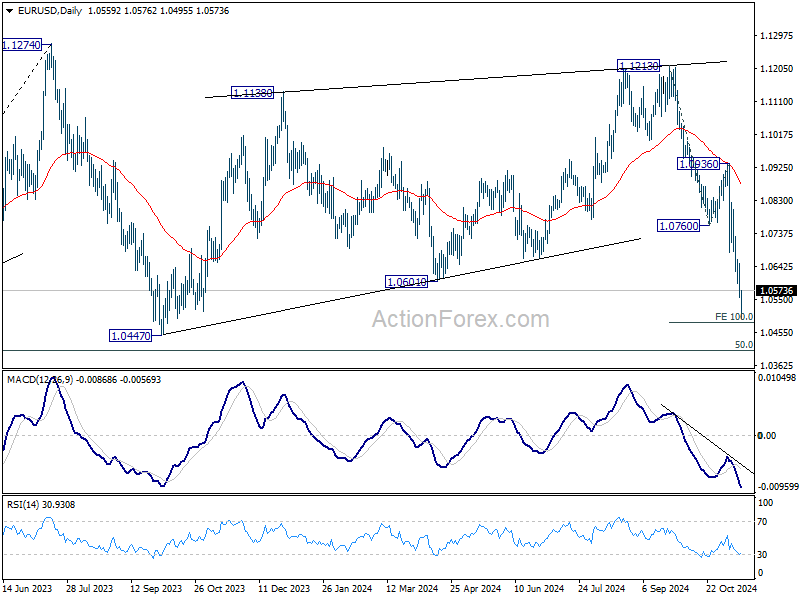
In the bigger picture, price actions from 1.1274 (2023 high) are seen as a consolidation pattern to up trend from 0.9534 (2022 low), with fall from 1.1213 as the third leg. Downside should be contained by 50% retracement of 0.9534 (2022 low) to 1.1274 at 1.0404, to bring up trend resumption at a later stage.
US initial jobless claims falls to 217k vs exp 224k
US initial jobless claims fell -4k to 217k in the week ending November 9, below expectation of 224k. Four-week moving average of initial claims fell -6k to 221k.
Continuing claims fell -11k to 1873k in the week ending November 2. Four-week moving average of continuing claims rose 1k to 1875k, highest since November 27, 2021.
US PPI up 0.2% mom, 2.4% yoy in Oct
US PPI for final demand rose 0.2% mom in October, matched expectations. Most of the rise can be traced to a 0.3% mom advance services. Prices of goods inched up 0.1% mom. PPI less foods, energy, and trade services increased 0.3% mom.
For the 12 month period, PPI accelerated notably from 1.9% yoy to 2.4% yoy, above expectation of 2.3% yoy. PPI less foods, energy, and trade services rose 3.5% yoy, up from prior month's 3.3% yoy.
ECB accounts: Earlier path to 2% inflation, downside risks increase
In reviewing the October meeting accounts, ECB policymakers broadly agreed that the disinflationary trend in the Eurozone is progressing "well on track".
While "upside risks" to inflation persist, they are now viewed as less significant, whereas "downside risks" have increased, influenced by slower economic activity.
This shift in balance suggests that inflation may reach the 2% target "somewhat earlier" than anticipated, with projections potentially indicating a lower inflation rate in 2025 than previously forecast.
Divergent views emerged regarding the precise impact of weaker economic growth on inflation, with members agreeing to revisit a more detailed assessment in December when updated projections become available.
A critical element behind the decision to cut rates was "risk management." Members widely agreed that if the current economic slowdown proves "temporary", cutting rates now could be seen as "having brought forward" a December cut. However, if data reveals "persistent weakness," the move would constitute a "timely adjustment".
In light of this economic environment, ECB Governing Council reached a consensus to lower rates by 25 basis points.
(ECB) Monetary policy accounts
Account of the monetary policy meeting of the Governing Council of the European Central Bank held in Ljubljana on Wednesday and Thursday, 16-17 October 2024
14 November 2024
1. Review of financial, economic and monetary developments and policy options
Financial market developments
Ms Schnabel noted that since the Governing Council’s previous monetary policy meeting on 11-12 September 2024, policy rate expectations had shifted back and forth. Incoming data had made it challenging for market participants to price in the speed and extent of both disinflation and the monetary policy easing cycle. The key drivers of financial market developments since the September meeting had been a sluggish euro area economy, a robust US economy and rising and volatile commodity prices.
The combination of weaker euro area macroeconomic data and higher commodity prices had affected the market’s view of the inflation outlook and the perceived balance of risks to inflation. Inflation fixings (swap contracts linked to monthly releases of the Harmonised Index of Consumer Prices excluding tobacco) had recently shifted upwards significantly, reversing part of the decline seen following the Governing Council’s July meeting, when energy prices had dropped notably. These swings in investors’ view of the inflation outlook illustrated the significant impact of energy prices on inflation expectations. At the same time, market-based indicators of risks to inflation based on option pricing remained tilted to the downside over the near and medium term, although they had become more balanced recently, while risks to the longer-term inflation outlook had become tilted to the upside again.
Incoming data for the euro area had also had a significant impact on monetary policy expectations. Market participants currently expected front-loaded rate cuts, with a 25 basis point rate cut at the current meeting and another cut in December 2024 fully priced in. But they also expected a more contained rate-cutting cycle overall, with lower total cuts from March 2025 onward and a higher terminal rate compared with expectations in September 2024. Participants in the Survey of Monetary Analysts (SMA) held broadly similar views on the near-term outlook for interest rates to those of markets, with some deviations as of the second half of 2025.
The reappraisal of the expected policy rate path had been much more pronounced in the United States, where market participants had notably revised up their expectations regarding the terminal policy rate. Expectations regarding the ECB’s terminal rate had also been pulled higher, albeit by less than in the United States, reflecting the weaker incoming macroeconomic data for the euro area. This had increased the divergence between the two terminal rates. At the same time, the uncertainty in rate markets, as measured by the dispersion of analysts’ forecasts for three-month forward interest rates one year ahead, had remained higher than the historical average in both the euro area and the United States, indicating that uncertainty around the policy rate path remained material.
The decomposition of changes in the risk-free rate curve in the euro area and the United States into inflation compensation and real rates showed that nominal rates had increased for medium and longer-term maturities in both currency areas. However, the rise had been much more pronounced in the United States, on the back of a stronger increase in both inflation compensation and real rates. In the euro area, the repricing of the inflation outlook had put upward pressure on risk-free rates, with inflation compensation rising significantly across maturities. By contrast, euro area real interest rates had declined across maturities, with the most pronounced drop at the short end of the curve, implying a further loosening of financing conditions. Almost the entire euro area real rate curve was currently close to neutral territory.
Bond investors at present expected a soft landing in the euro area with the policy rate moving back to a broadly neutral level. This view was supported by recent equity market developments, as major equity market indices had risen significantly in September and October. Developments in corporate bond markets also suggested that investors had shrugged off the weakening of the euro area economy. Corporate bond spreads had declined across the board, with the sharpest decline observed for high-yield non-financial corporate bonds. This was partly supported by a benign outlook for default rates in the corporate sector. Sovereign spreads relative to the German Bund, other than for French bonds, had declined over the inter-meeting period.
All in all, there had been a broad-based and pronounced easing of financial conditions since the Governing Council’s previous monetary policy meeting. This was driven by lower short-end real rates, higher equity prices and the weakening of the euro by 1% against the US dollar, in line with developments in the two-year yield differential between the euro area and the United States.
Regarding recent dynamics in money market rates, the pass-through of changes in policy rates to money market rates had been effective. At the same time, the gradual upward drift in repo rates relative to the deposit facility rate over the past few months had brought secured rates into the close vicinity of the deposit facility rate, which had not happened since 2020. By contrast, the spread between the unsecured euro short-term rate (€STR) and the deposit facility rate had remained broadly stable.
Several factors could explain the counterintuitive situation of borrowing cash being cheaper in the unsecured market than in the secured market. The dominant factor appeared to have been the significant improvement in collateral availability, partly as a consequence of the reduction in the Eurosystem’s market footprint. In contrast, there had been little evidence so far of upward pressure on repo rates stemming from liquidity shortages. In addition, factors related to regulation and market microstructure had limited the ability of cash lenders to arbitrage between secured and unsecured markets, with only a few lenders active across both markets.
Since the narrowing of the spread between the rate on the main refinancing operations and the deposit facility rate to 15 basis points as of 18 September 2024 there had been only limited recourse to the Eurosystem’s standard refinancing operations, as market-based funding had remained attractive.
The global environment and economic and monetary developments in the euro area
Starting with inflation in the euro area, Mr Lane recalled that headline inflation had been 1.8% in September according to the Eurostat flash estimate (subsequently revised down to 1.7% in the final release, which became available on 17 October), substantially lower than in August and below the path foreseen in the September ECB staff macroeconomic projections. The downside surprise largely reflected a drop in energy inflation, but core inflation had also played a role. This, in turn, was due to downside surprises in goods inflation and – to a lesser degree – services inflation. With respect to underlying inflation, the exclusion-based indicators that were already available for September had moved down. Meanwhile, the underlying inflation indicators available up to August had eased or were stable. The Persistent and Common Component of Inflation (PCCI) remained at the bottom of the range, at 2.0%. The higher levels of some of the other measures reflected their more backward-looking nature at a time when the propagation of past shocks was still ongoing. The domestic inflation indicator, in particular, remained high at 4.4%, as it mainly covered services items. However, taken together, the month-on-month seasonally adjusted services inflation rates for August and September were closer to the long-term average, suggesting a moderation in inflation dynamics compared with earlier in the year.
Services inflation remained high but was expected to decelerate. This prediction was supported for example by the PCCI for the services component. Services PCCI had stood at around 2.4% since the start of the year – reflecting that a significant part of services inflation, at around 4%, was due to backward-looking elements and one-off factors. For example, large increases in insurance fees at the start of 2024 had continued to push up the annual services inflation rate, but would lead to negative base effects at the start of 2025. Historically, such increases had not been signals for future inflation in the services segment. This implied that services inflation should over time converge to the level of services PCCI, as those one-off factors dropped out of the data.
The incoming data and signals for wage growth in 2025 were either in line with or below the September projections. Forward-looking wage trackers were broadly in line with the September projections and pointed to an easing of wage growth in 2025. Survey indicators also suggested a marked deceleration in wage growth in the coming year.
After the recent downside surprises to inflation, the December Eurosystem staff projections would allow a comprehensive assessment of the inflation outlook. Headline inflation was expected to rise again later in 2024, before declining to target in the course of 2025, earlier than had been foreseen before. The latest expert surveys indicated inflation rates for 2024 and 2025 that were below the September projections baseline. The inflation expectations of euro area firms and consumers had also declined across all horizons.
Turning to the external environment, global growth momentum was broadly steady but also uneven. The global composite Purchasing Managers’ Index (PMI) excluding the euro area had fallen to 52.5 in September, from 53.2 in August. While services had remained resilient, manufacturing output had stagnated. The deceleration appeared to be driven by a fading of the inventory build-up seen earlier in the year. Global import growth was likely to moderate following the frontloading of orders in the second quarter, but an overall environment of robust growth should support trade towards the end of the year.
The euro had remained broadly stable in nominal effective terms since the Governing Council’s previous monetary policy meeting. Both oil and gas prices had increased since then, but the futures curve for oil prices continued to be downward-sloping. The latest data from the International Energy Agency suggested a positive supply balance for oil throughout 2025, which supported a decrease in oil prices in 2025.
For the euro area, the incoming information suggested that economic activity had been weaker than expected. The euro area composite output PMI had fallen to 49.6 in September from 51.0 in August. The deterioration in the PMI was broad-based across countries and sub-indices. The interest rate-sensitive manufacturing sector had contracted further, with the manufacturing output PMI falling to 44.9 in September from 45.8 in August. The services sector continued to expand but the pace of expansion was slowing, with the PMI for services activity declining to 51.4 in September from 52.9 in August, partly reflecting an unwinding of the Olympic Games-related boost to services in August. These latest readings signalled a weaker near-term outlook than had been foreseen in the September projections.
Household incomes had risen in the second quarter, but the available data indicated that household consumption had fallen quarter on quarter in real terms, surprising to the downside. The saving rate had stood at 15.7% in the second quarter, well above the pre-pandemic average of 12.9%. The elevated saving rate likely reflected the higher real returns on savings, efforts to recuperate losses in real net wealth and strong growth in non-labour income, for which the marginal propensity to consume was low. To the extent that consumption only responded to an increase in income with a lag, the high saving rate might also include a temporary component. Indeed, survey evidence pointed to a gradual recovery in household spending. Retail sales had edged up in August, while the European Commission’s consumer confidence indicator had risen in September.
Housing investment seemed to be close to a trough and should be supported by lower financing costs and the recovery in house prices, but the outlook for business investment was more uncertain. According to the ECB’s latest contacts with non-financial companies, weak demand, loss of competitiveness and increasing concerns about the uncertain regulatory environment for the green transition were causing firms to delay investment and instead focus on efficiency and cost-cutting.
With respect to external trade, euro area exports were decreasing, reflecting a declining market share for the euro area linked to a loss in competitiveness. The recent decline in the PMI for new export orders indicated that the situation was unlikely to improve in the near term.
The expert surveys pointed to a growth outlook that was somewhat weaker than the September baseline. The ECB’s SMA reported growth projections for 2024, 2025 and 2026 that were, respectively, 0.1, 0.2 and 0.3 percentage points below the September projections. The growth projections of the ECB’s Survey of Professional Forecasters and Consensus Economics respondents stood 0.1 percentage points below the baseline for each of the three years. With respect to fiscal policies, new draft budgetary plans had just been announced for many but not all euro area countries.
The labour market remained resilient and the incoming information was consistent with the near-term outlook in the September projections. The unemployment rate had stayed at its historical low of 6.4% in August. However, surveys pointed to slowing employment growth and a further moderation in the demand for labour.
Turning to monetary and financial analysis, shorter-term market interest rates had declined since the Governing Council’s previous monetary policy meeting, owing mainly to weaker news about the euro area economy and the further fall in inflation. While financing conditions remained restrictive, the average interest rates on new loans to firms and on new mortgages had fallen slightly in August, to 5.0% and 3.7% respectively. Growth in lending to households showed early signs of improvement. According to the latest euro area bank lending survey, credit standards for mortgages had eased for the third quarter in a row, owing especially to greater competition among banks. Lower interest rates and better housing market prospects had led to a strong increase in the demand for mortgages. In line with this, mortgage lending had picked up slightly, growing at an annual rate of 0.6% in August. Banks expected similar developments in demand for housing loans in the fourth quarter of the year.
Growth in lending to firms and demand for bank loans by firms remained weak. The bank lending survey for the third quarter of 2024 confirmed that credit standards for loans to firms had remained at the restrictive levels reached after more than two years of progressive tightening. While banks had reported zero net tightening in credit standards for business loans for the first time since mid-2021, they had cited risk perceptions related to the general economic and firm-specific outlooks as factors tending towards a tightening of credit conditions. Banks had reported a moderate net increase in the demand for loans to firms for the first time in two years, driven mainly by declining interest rates and a muted contribution from fixed investment. Overall, lending to firms continued to be subdued, growing at an annual rate of 0.8% in August, which had been driven by monthly flows that had been broadly fluctuating around zero since the start of the year. Looking ahead to the fourth quarter of the year, banks expected a renewed but moderate tightening of credit standards and a further net increase in loan demand by firms.
Monetary policy considerations and policy options
In summary, the incoming information on inflation showed that the disinflationary process was well on track. Indicators of economic activity had surprised somewhat to the downside, further weighing on the inflation outlook. Meanwhile, financing conditions remained restrictive. Inflation was expected to rise in the coming months before declining to target in the course of 2025. Domestic inflation remained high, as wages were still rising at an elevated pace. At the same time, labour cost pressures were set to continue easing gradually, with profits partially buffering their impact on inflation.
Overall, the incoming information suggested that the downside risks to the growth outlook in the September baseline, with the associated weakening of inflation pressures, had become more prominent. Based on this assessment, Mr Lane proposed that the Governing Council lower the deposit facility rate – the rate through which it steered the monetary policy stance – by 25 basis points. In line with the operational framework, this meant that the rate on the main refinancing operations and the rate on the marginal lending facility would also be lowered by 25 basis points.
This proposal was motivated by prudent risk management. If the slowdown signalled by indicators of economic activity and the downside surprise to inflation proved to be temporary, a decision to cut rates at the October meeting could, ex post, turn out as merely having brought forward a December cut. By contrast, if the data suggested a more persistent weakness, which confirmed a stronger disinflationary process, cutting at the current meeting would, ex post, signal a nimble adjustment of policy to changing macroeconomic conditions. Retaining full optionality was therefore important and acted as a hedge against the materialisation of risks in either direction to the growth and inflation outlooks. In its communication, the Governing Council should therefore continue to refrain from giving guidance about the speed and scale of monetary easing at future meetings.
2. Governing Council’s discussion and monetary policy decisions
Economic, monetary and financial analyses
As regards the external environment, members took note that nowcasts pointed to steady growth in global activity in the second half of 2024, which supported the expectation of a pick-up in world trade. Members widely stressed the uncertainty surrounding the external environment. This was suggested by, among other things, the latest survey data, which included a decline in the global PMI for output in both manufacturing and services, albeit still in expansionary territory. The US economy had proven more robust than expected. For China it was noted that growth could be expected to benefit from monetary and fiscal stimulus, but at the same time it was cautioned that the need for such stimulus could point to economic fragilities. This was also significant for commodity price dynamics, since China was an important source of demand. Furthermore, geopolitical conflicts such as the situation in the Middle East remained a major source of uncertainty, not only via direct effects on oil prices and shipping costs but also by dampening confidence.
With regard to economic activity in the euro area, members concurred that the incoming information suggested growth had been somewhat weaker than expected. While industrial production had been particularly volatile over the summer months, surveys indicated that manufacturing had continued to contract. For services, surveys showed an uptick in August, likely supported by a strong summer tourism season, but the latest data pointed to more sluggish though continued growth. Businesses were increasing investment only slowly, while housing investment continued to fall. Exports had weakened, especially goods exports. Although household incomes had risen in the second quarter, consumption had remained weak. The saving rate had stood at 15.7% in the second quarter, well above its pre-pandemic average. At the same time, recent survey evidence pointed to a gradual recovery in household spending. The economy was expected to strengthen over time, as rising real incomes allowed households to consume more. The gradually fading effects of restrictive monetary policy were expected to support consumption and investment, and exports were expected to contribute to the recovery as global demand rose.
The weaker incoming data were seen to increasingly raise the question of what should drive the projected economic expansion. It was remarked that none of the demand components – consumption, investment or exports – had as yet shown the strengthening that was foreseen in the September staff projections. In particular, questions were raised on the consumption-led growth in economic activity in the projections, with the data pointing to a substantial increase in the saving rate instead. Different explanations were offered for the increase in the saving rate. These included relatively elevated interest rates encouraging a postponement in consumption, savings set aside for refinancing fixed rate loans – taken out in times of very low interest rates – at higher interest rates, as well as the uncertainty related to the outlook for fiscal policies and the possibility of Ricardian effects, i.e. people saving more in anticipation of higher taxes to service higher public debt. Such factors would dampen the positive impact that higher real disposable incomes should have on consumption in the short term. At the same time, it was considered plausible that higher real disposable income would, after a delay, eventually translate into higher consumption. Indicators supporting this narrative were the continued upward trend in consumer confidence, albeit from low levels, the uptick in retail sales and the recent higher demand for consumer credit. Comfort was also drawn from the observation that the interest rate-sensitive housing market appeared to have reached a turning point, with house prices rising again and demand for mortgages increasing measurably.
With respect to the weakness in investment, it was underlined that this not only constrained domestic demand but also hampered capital deepening and challenged the narrative of a rapid pick-up in productivity embedded in the projections. It was recalled that investment typically hinged to a large extent on prospects for demand, and demand was seen as remaining particularly subdued at a time when geopolitical and structural factors were increasing uncertainty for exports and the manufacturing sector. Transmission of past monetary policy tightening was therefore only one factor holding back investment. This also meant that monetary policy easing alone would not lead to a decisive turnaround, especially if the root causes were structural, such as overregulation, or related to political uncertainty. However, it was argued that evidence of sluggish consumption and investment did not contradict expectations of a soft landing for the economy, and the available information did not suggest that the euro area was heading for a recession.
In this context, it was noted that the negative news came mainly from soft survey data, while new hard data had been limited and had been giving contradictory signals. Reference was made in this respect to the upward surprise in industrial production for August, which contrasted with the weaker PMI survey for September. At this stage, concerns thus related mainly to downside risks to the September projections rather than to a need to revise the baseline. In this context, it was also recalled that growth rates had remained dispersed across euro area countries. In particular, the point was made that the headwinds facing the largest euro area economy reflected mainly structural weaknesses in the manufacturing sector, in conjunction with high energy costs and losses in price competitiveness.
The labour market had remained resilient. The unemployment rate had stayed at the historical low of 6.4% in August. However, surveys pointed to slowing employment growth and a further moderation in demand for labour. It therefore remained crucial to monitor labour market developments, including looking at evidence of labour hoarding (which could also affect productivity). Job vacancies were declining, and it was argued that the associated easing of labour market tightness would imply fewer incentives for firms to hoard labour. The concern was raised that, with companies starting to shed labour in some countries, a tipping point could be reached, even though the aggregate euro area unemployment rate had remained stable so far at a historically low rate and had surprised on the downside.
Members reiterated their call for fiscal and structural policies to be aimed at making the economy more productive, competitive and resilient. That would help to raise potential growth and reduce price pressures in the medium term. To this end, it was crucial to swiftly follow up, with concrete and ambitious structural policies, on Mario Draghi’s proposals for enhancing European competitiveness and Enrico Letta’s proposals for empowering the Single Market. Implementing the EU’s revised economic governance framework fully, transparently and without delay would help governments bring down budget deficits and debt ratios on a sustained basis. Governments should now make a strong start in this direction in their medium-term plans for fiscal and structural policies.
It was noted that the reformed fiscal governance framework allowed an appropriate balance between fiscal consolidation and the necessary investment in growth-enhancing reforms. Draft budgetary plans were currently being submitted to the European Commission and should be closely assessed in time for the Governing Council’s December monetary policy meeting. Concern was expressed that the multi-year nature of the plans and the focus on the years ahead could leave 2024 as a year with still excessive fiscal spending. In this context, it was recalled that the higher fiscal expenditure and deficits induced by the pandemic and the energy price shock following Russia’s invasion of Ukraine had been meant to be transitory and that more fading-out should have been observed already. With limited fiscal space available looking ahead, it was widely felt that even more emphasis needed to be put on structural policies that fostered economic activity by enhancing the growth potential.
Against this background, members assessed that the risks to economic growth remained tilted to the downside. Lower confidence could prevent consumption and investment from recovering as fast as expected. This could be amplified by sources of geopolitical risk, such as Russia’s unjustified war against Ukraine and the tragic conflict in the Middle East, which could also disrupt energy supplies and global trade. Lower demand for euro area exports due, for instance, to a weaker world economy or an escalation in trade tensions between major economies would further weigh on euro area growth. Growth could also be lower if the lagged effects of monetary policy tightening turned out stronger than expected. Growth could be higher if the world economy grew more strongly than expected or if easier financing conditions and declining inflation led to a faster rebound in consumption and investment.
With regard to price developments, members concurred that the incoming information on inflation showed that the disinflationary process was well on track. Annual inflation had fallen further to its lowest level since April 2021, mainly driven by energy base effects and lower than expected energy prices. There was wide agreement that the incoming data since the September meeting had increased confidence in an ongoing disinflation process and that inflation would converge to the medium-term target.
In discussing the latest information, it was noted that the outcome for headline inflation in September 2024 would imply a lower inflation path than had been expected in the September staff projections and therefore signalled a downside risk. This also implied that the 2% target could be reached earlier in 2025, after a temporary bump around the turn of the year, and pointed in the same direction as the latest market and analyst expectations, which saw inflation below target in 2025. At the same time, it was observed that the low September outcome for headline inflation largely reflected energy price developments, which were notoriously volatile. Against this background, it was cautioned against using short-term movements in headline inflation as a guide for the medium-term outlook. Indeed, progress in core inflation had been more limited.
The view was expressed that despite downward surprises and outcomes below target it was too early to declare victory in terms of a timely and sustainable return to target. Reference was made to the fact that services inflation was still hovering at rates around 4%. A note of caution was expressed that, although the momentum of services price dynamics had come down, it still remained high. At the same time, services inflation was still being kept high by items that typically adjusted sluggishly or that were indexed to past inflation. This upward impact would, however, naturally fade as inflation converged to 2%.
Assessing the outlook for services inflation was seen to warrant close monitoring of wage developments. Overall wage growth had been lower than expected, though negotiated wage growth was expected to be high and volatile for the rest of the year before moderating in 2025. The ECB’s forward-looking wage tracker corroborated expectations in the September projections that wage pressures would ease in 2025. Reference was made to wage tracker scenarios putting wage growth below 3% in the second half of 2025, implying that it would not exert cost pressures. However, it was recalled that most of the moderation in wage growth had yet to materialise. Whether wage growth would fall as expected would also depend on the perception of real wages and the accumulated loss of purchasing power across sectors and countries.
As regards longer-term inflation expectations, members took note that most measures of longer-term inflation expectations were standing at around 2%. It was pointed out that a large majority of participants in the Survey of Professional Forecasters believed that inflation would in the longer term be right at the 2% target. In this context, it was argued that recent movements in longer-term market-based measures of inflation compensation needed to be assessed with some caution, as they appeared to have been driven by the high volatility of energy prices.
Against this background, members assessed that there were both upside and downside risks to inflation. Inflation could turn out higher than anticipated if wages or profits increased by more than expected. Upside risks to inflation also stemmed from the heightened geopolitical tensions, which could push energy prices and freight costs higher in the near term and disrupt global trade. Moreover, extreme weather events, and the unfolding climate crisis more broadly, could drive up food prices. By contrast, inflation might surprise on the downside if low confidence and concerns about geopolitical events prevented consumption and investment from recovering as fast as expected, monetary policy dampened demand more than expected, or if the economic environment in the rest of the world worsened unexpectedly.
It was argued that the downside risks to economic growth implied downside risks to the inflation outlook, reflecting a natural correlation of risks, at least in the case of demand shocks. There were still upside and downside risks, but it was felt that the upside risk had become less intense and the downside risk more pronounced. However, it was stressed that geopolitical conflicts remained a significant source of upside risk because of their implications for energy prices, as shown by the way that the volatility of energy prices had affected the inflation outcome in September. It was argued that, excluding geopolitical risk, the risk on the upside had receded substantially.
Turning to the monetary and financial analysis, members noted that shorter-term market interest rates had declined since the Governing Council’s September monetary policy meeting, owing mainly to weaker news on the euro area economy and the further fall in inflation, but market participants also expected a less extensive rate-cutting cycle overall. Market participants were now pricing in a 25 basis point rate cut for the October meeting and another 25 basis point cut in December. The change in market expectations and sentiment had been rapid and substantial since the September meeting, when the next rate cut had generally not been expected until December.
Expected real interest rates (based on the expectations for inflation and interest rates embodied in market pricing) had declined across maturities since the time of the previous meeting, with the most pronounced drop at the short end of the curve. While still positive, expected real interest rates were now relatively low across the maturities beyond the very short term, with medium and longer-term real interest rates now well within the range of neutral estimates. Broader financial conditions had eased since the previous meeting, driven by stronger equity markets, tighter credit spreads for both corporate and sovereign bonds and a weaker euro exchange rate, in addition to lower short-term market interest rates.
The reduction in policy rates in September had been transmitted smoothly to money market interest rates and there had been only a limited increase in the take-up in the main refinancing operations after the narrowing of the spread between the interest rate on the main refinancing operations and the deposit facility rate, which was seen as a successful outcome of the changed operational framework for implementing monetary policy. Repo rates had recently been increasing relative to the deposit facility rate. This was mainly driven by a reduction in collateral scarcity and the smaller Eurosystem footprint in financial markets rather than by the gradual reabsorption of excess liquidity. The Eurosystem’s new operational framework was seen as well prepared to tame a potential increase in money market volatility. In any case, money markets warranted continuous monitoring.
Financing conditions remained restrictive, although the average interest rates on new loans to firms and on new mortgages had fallen slightly in August. This suggested that the pass-through of past policy rate increases had gradually started to fade and provided an initial indication that bank lending rates would ease from restrictive levels. In this regard, it was observed that the limited easing of bank lending rates appeared to be a mirror image of the slower tightening in the banking system than in financial markets when interest rates had been increasing. In addition, balance sheet normalisation, including the close to complete repayment of targeted longer-term refinancing operations and the continued gradual roll-off of the asset portfolio, was inducing banks to maintain deposit rates at an elevated level. Still, banks were likely to adjust their funding mix in response to the revised interest rate outlook, which would affect the speed of monetary policy transmission.
Overall, bank lending conditions still appeared to be relatively tight, while showing some signs of a softening. According to the latest bank lending survey, credit standards for business loans had been unchanged in the third quarter after more than two years of progressive tightening. In addition, credit standards for mortgages had eased for the third quarter in a row, owing especially to greater competition among banks. The demand for loans by firms had risen for the first time in two years, while lower interest rates and better housing market prospects had led to a particularly strong increase in the demand for mortgages. These developments were seen as a positive signal for a recovery in economic growth and could also indicate that the dampening effects of high interest rates were gradually fading. In addition, the measurable increases in mortgage demand were a first sign that the recent cuts in interest rates and looser financing conditions were starting to be transmitted to the economy, given the high interest rate-sensitivity of the housing sector. It was also suggested that these developments could be the beginning of a more sustained turnaround that might help to stabilise the household saving rate and even start to bring it down, in a context of rising loans for consumption. It was also argued, however, that, while the bank lending survey was less negative than had been expected, it was doubtful that the pick-up in loan demand marked a major turnaround.
Credit growth had remained sluggish overall. Mortgage lending had picked up slightly, to grow at an annual rate of 0.6% in August, while consumer credit was growing more robustly at 3.1%. Lending to firms continued to be subdued, growing at an annual rate of 0.8% in August, on the back of two consecutive months of negative net flows. At the same time, while many firms were reliant on banks, enterprises had responded to the easing in broader financial conditions by increasingly tapping bond and equity markets, so it was important to consider their overall external financing beyond bank loans.
Monetary policy stance and policy considerations
Turning to the monetary policy stance, members assessed the data that had become available since the previous monetary policy meeting in accordance with the three main elements that the Governing Council had communicated in 2023 as shaping its reaction function. These comprised (i) the implications of the incoming economic and financial data for the inflation outlook, (ii) the dynamics of underlying inflation, and (iii) the strength of monetary policy transmission.
Starting with the inflation outlook, year-on-year inflation was expected to rise in the coming months, partly because previous sharp falls in energy prices would drop out of the annual rates. Nonetheless, inflation was expected to decline to target in the course of next year. This continuing disinflationary process should be supported by easing labour cost pressures and the past monetary policy tightening gradually feeding through to consumer prices. Most measures of longer-term inflation expectations remained well anchored, standing at around 2%.
Members broadly concurred with the assessment of the incoming inflation information, which showed that the disinflationary process was well on track. Headline inflation had turned out lower than expected in September and was close to target. The upside risks to inflation were now also seen as lower, although they were still present and needed careful monitoring. The downside risks were higher and were affected by subdued economic conditions. This was underlined by the recent weaker than expected readings in indicators of economic activity. As a result, inflation would probably now reach the 2% target somewhat earlier. It could thus be lower in 2025 than previously expected.
There was therefore broad agreement that the convergence of inflation to the ECB’s medium-term target was well on track and that the configuration of upside and downside risks had become more balanced. A range of views were expressed about the extent to which the baseline outlook for inflation had been affected, but a more comprehensive reassessment would be undertaken alongside the December projections. Members would then see more clearly to what extent weaker growth, if persistent, affected the future path of disinflation. It would then also be seen whether the projected consumption-led recovery was materialising.
It was stressed that the incoming information had been limited. It should therefore be seen as broadly confirming the inflation outlook contained in the September projections for 2025 and beyond, with only a slight acceleration in the disinflationary trajectory. At the same time, it was recalled that the staff projection for 2025 inflation had been revised up slightly over the past two projection rounds, so recent developments might imply only a reversal of these upward revisions. A large, persistent undershooting of the 2% inflation target requiring a sustained policy response remained unlikely. This was mainly because structural inflationary trends such as geopolitical fragmentation and climate change were likely to lead to more frequent adverse supply shocks. Such a scenario of undershooting probably required a combination of factors that were not yet present. These included disappointing economic growth that moved into recessionary territory, a weakening in the financial system, wage pressures fading away and a downward shift in inflation expectations.
By contrast, it was also suggested that the change in the inflation outlook had been more significant, with recent downside surprises and rapid changes in market expectations pointing to an increasing risk of undershooting the target in the course of 2025, possibly in a sustained manner, especially if wage growth moderated substantially. This could now be seen as a greater risk than overshooting the target.
Turning to underlying inflation, members noted that most measures had either declined or were unchanged. Domestic inflation was still elevated, as wage pressures in the euro area remained strong. At the same time, it was important to consider the full range of underlying inflation indicators. Of these, only domestic inflation remained substantially above 2%, while the PCCI was firmly anchored at 2%. There was also a case for placing greater emphasis on more forward-looking indicators of underlying inflation. Core inflation had fallen in September, although it remained relatively high and there was still fairly limited progress in its overall recent trend.
The developments in domestic and core inflation were partly linked to persistently high services inflation. Nevertheless, there had recently been some positive signs, which could suggest that the worst had passed. For example, for the first time since the surge in inflation, little or no incremental price inflation had been recorded in services (when base effects were excluded) and services inflation momentum was declining, albeit from high levels. It was argued, however, that more readings would be needed for a clearer picture and that key data confirming a significant decline in domestic and services inflation would only arrive in the first half of 2025. Labour cost dynamics would also continue to be a key concern for domestic inflation, and wage pressures needed to be carefully monitored. Despite slight declines, wage growth was still elevated and was expected to remain high and volatile for the rest of the year, given the significant role of one-off payments and the staggered nature of wage adjustments. At the same time, labour cost pressures were set to continue easing gradually, with wage growth likely to moderate and profits partially buffering their impact on overall inflation. Again, it was stressed that key data confirming a significant deceleration in wage growth and unit labour costs would likely only arrive in 2025, also in view of disappointing productivity growth.
Finally, members generally agreed that monetary policy transmission from the past tightening continued to dampen economic activity, even though some signs of easing were already starting to be visible, as restrictiveness was gradually but progressively withdrawn. Financing conditions remained restrictive and continued to weigh overall on consumption and investment, and this exerted downward pressure on growth and inflation. At the same time, with the recent easing in monetary and financial conditions and the recent decline in expected real interest rates across much of the maturity spectrum, the policy stance might be approaching the estimated neutral territory earlier than previously thought.
It was underlined that transmission from past monetary tightening was ongoing, owing to various lags, even as the first effects of easing materialised. Many holders of fixed rate mortgages, for example, had not yet seen their interest rates increase. However, mortgage payments were still set to go up, even if interest rates were now falling in aggregate, because the mortgages had been taken out when interest rates were very low. It was suggested that savings might have been more responsive to interest rates than implied by models estimated on the small changes observed in the past, whereas the increases in interest rates had been very large and rapid to counter the recent inflation surge. It was also argued that high interest rates continued to weigh on investment, even with longer-term real interest rates now in neutral territory. In this context, continuing restrictiveness at the short end of the yield curve could be dampening aggregate demand by more than implied by models. Finally, it was emphasised that the strength of monetary policy transmission interacted with the weakness of the economy, for example making banks more reluctant to lend.
At the same time, the gradually fading effects of restrictive monetary policy were expected to support consumption and investment in the future. There were also initial signs that the recent easing of monetary policy restriction and the anticipation of more to come were starting to be transmitted to the economy in the interest rate-sensitive housing sector, in line with its quick responsiveness to the start of the hiking cycle in 2022. Looking ahead, other cyclical components such as the construction sector would probably be supported and demand more generally should be boosted by the easing of financial conditions, while manufacturing sectors facing structural challenges were unlikely to benefit as much. Still, the recent easing of restriction would need time to work its way through the economy and the lagged effects from past rate hikes would extend beyond the end of 2024.
Monetary policy decisions and communication
Against this background, members considered the proposal by Mr Lane to lower the three key ECB interest rates by 25 basis points. In particular, based on the updated assessment of the inflation outlook, the dynamics of underlying inflation and the strength of monetary policy transmission, it was now appropriate to take another step in moderating the degree of monetary policy restriction by lowering the deposit facility rate – the rate through which the Governing Council steered the monetary policy stance.
The incoming information on inflation had shown that the disinflationary process was well on track. There was increasing confidence that inflation would converge to the 2% medium-term inflation target in a timely manner. The disinflationary trend was getting stronger, becoming more robust and gaining momentum. Recent inflation figures had been weaker than expected and had now fallen – albeit temporarily – below target. The latest reading was seen as a continuation of a sequence, while it was contended that the fall in September, mainly linked to lower energy prices, was insufficient by itself to justify a rate cut. Wage growth had been evolving broadly in line with the projections. There were also initial signs of improvement in services inflation, as well as indications that services and domestic inflation would decline materially in the coming year. Among measures of underlying inflation, only domestic inflation continued to be substantially above 2%. Comfort could also be drawn from the recent performance and stability of the staff inflation projections, which had improved over the past year. In addition, inflation expectations across a range of measures were well anchored at about 2%. At the same time, it was still too early to declare victory in the fight against inflation, especially since the main decline in services inflation and wage growth had yet to materialise. It was also important to see a configuration of wages, productivity growth and profit margins that was consistent with not only reaching the 2% target but also staying there sustainably.
The inflation outlook had been affected by recent downside surprises in indicators of economic activity, and it was regarded as important that monetary policy fulfil its primary objective of price stability without harming the real economy by more than was necessary. In this context, it was maintained that the weaker growth outlook primarily reflected structural rather than cyclical demand factors, outside the realm of monetary policy.
Risk management considerations were widely seen as a key element supporting a decision to cut interest rates at the current meeting. In particular, if the slowdown signalled by indicators of economic activity and the downside surprise to inflation proved to be temporary, a decision to cut rates now could, ex post, turn out as merely having brought forward a December cut. As such, there was little risk associated with cutting, especially given that interest rates would remain in restrictive territory and continue to support the disinflationary process. By contrast, if the recent data signalled a more persistent weakness, which confirmed a stronger disinflationary process, cutting today would be justified as a timely adjustment of policy to changing macroeconomic conditions. This reasoning also meant that the risks from cutting at the present meeting and potentially being too early were lower than the risks of waiting and potentially acting too late. As such, it was also contended that acting now could provide insurance against downside risks that could lead to an undershooting of the target further ahead and would support a soft landing. Furthermore, the point was made that a decision to cut interest rates now was a response to the materialisation of the downside risks identified in the past, rather than to prevailing or new risks.
Against this background, all members supported the proposal by Mr Lane to reduce the degree of monetary policy restriction through a third 25 basis point rate cut. This was a data-driven decision, justified by a wide range of indicators of the inflation outlook pointing in the same direction. Moreover, it reflected an interpretation of these data trends and continuity with respect to previous cutting decisions, rather than a dependence on any individual data point. It was also consistent with the policy considerations put forward at the previous meeting, which had highlighted that the Governing Council might decide to move more quickly should the data come in weaker than anticipated.
A few members initially expressed a view that they would have preferred to accrue more information and to wait until December, when a comprehensive assessment of the medium-term outlook for inflation was available. However, these members could see the precautionary risk management case for cutting now, and thus expressed their readiness to support the proposal.
Looking ahead, members emphasised that they remained determined to ensure that inflation would return to the 2% medium-term target in a timely manner and that they would keep policy rates sufficiently restrictive for as long as necessary to achieve this aim. They would also continue to follow a data-dependent and meeting-by-meeting approach to determining the appropriate level and duration of restriction. There should be no pre-commitment to a particular rate path – the need for full optionality for the period ahead was reiterated – in order to be free to respond as necessary. It was underlined that the speed at which the degree of restrictiveness should be reduced depended on the evolution of incoming data, which should continue to be evaluated against all three of the established elements of the reaction function. In particular, the materialisation of different risk factors could either accelerate or decelerate the disinflationary process. Such data-dependence did not amount to data point dependence. Moreover, it was argued that the closer rates were to neutral territory, the more cautious one would have to be that monetary policy did not itself become a factor slowing down the pace of disinflation.
Members also agreed with the Executive Board proposal to continue applying flexibility in the partial reinvestment of redemptions falling due in the pandemic emergency purchase programme portfolio.
Taking into account the foregoing discussion among the members, upon a proposal by the President, the Governing Council took the monetary policy decisions as set out in the monetary policy press release. The members of the Governing Council subsequently finalised the monetary policy statement, which the President and the Vice-President would, as usual, deliver at the press conference following the Governing Council meeting.
Gold Falls for the Fifth Consecutive Trading Session
On Thursday, the price of a troy ounce of Gold is lower, approaching 2,560.00 USD.
The current value of Gold is at an eight-week low, influenced by the strong US dollar. The market analyses the latest inflation statistics released in the US and draws rather ambitious conclusions.
The inflation statistics came out within expectations. The only thing that might have hurt investors' attention was the three-month inflation numbers, which rose on a year-on-year basis. Even so, the CPI data increases the likelihood of the Federal Reserve cutting interest rates in December. The odds of a rate cut are around 80%, up from less than 60% a couple of days ago.
Since last Friday's sell-off, the gold price has fallen by 4%. The stock exchange opinion is as follows: since Donald Trump will become the new US President, the Fed will be forced to stop the easing cycle sooner or later. This is due to the protectionist policies that Trump and his administration usually pursue, which can stoke inflation.
A strong US dollar will visibly weigh on the value of Gold and force the precious metal to retreat.
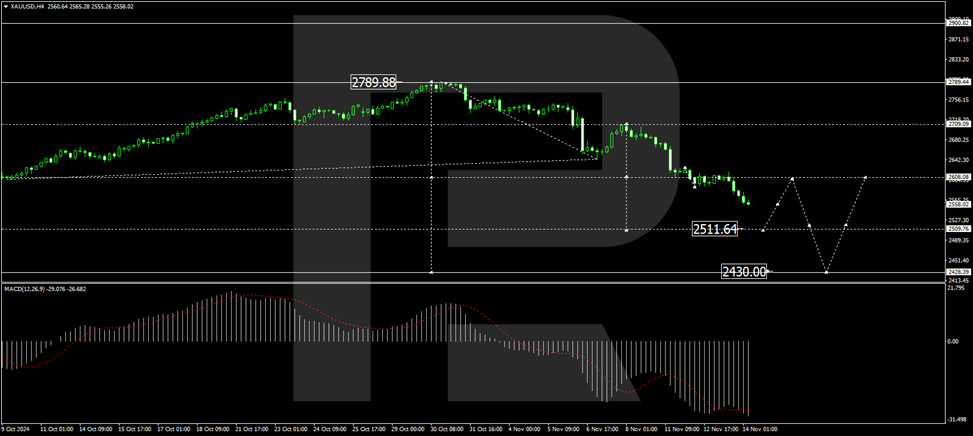
Technical analysis of XAUUSD
On the H4 chart of XAUUSD, the market has formed a consolidation range around the level of 2,608.00 and, with a downside exit, continues the development of the second half of the third wave of the trend to the level of 2511.65. After working off this level, we will consider the probability of the beginning of the correction wave to the level of 2,608.00 (test from below). After the correction is completed, we expect a new wave of decline to 2,430.00. Technically, this scenario is confirmed by the MACD indicator. Its signal line is under the zero level and is directed downwards.
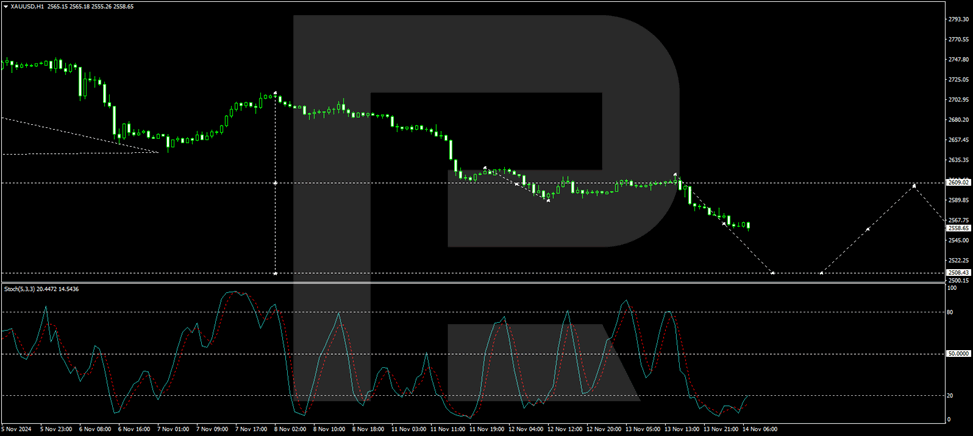
On the H1 chart of XAUUSD, the market broke through the level of 2,590.00 downwards and reached 2,560.00. We expect the development of a compact consolidation range around this level. A correction link to 2,577.00 is possible in case of an upward exit. Conversely, in case of a downward exit, we will consider the continuation of the wave to the local target of 2,511.65. Technically, this scenario is confirmed by the Stochastic oscillator. Its signal line is under 50 and is directed downwards to 20.
Fed’s Kugler notes significant disinflation amid steady cooling in labor market
In a speech today, Fed Governor Adriana Kugler said the US sees "considerable disinflation" paired with a "cooling" yet "resilient" labor market. This dual scenario means Fed must continue "paying attention to both sides of our mandate," referring to price stability and maximum employment.
On the inflation side, Kugler acknowledged recent moderation in wage growth and inflation expectations, noting these factors support further progress on inflation. However, she cautioned that persistent inflation in housing and specific goods and services sectors could "stall progress".
Meanwhile, she highlighted rebalancing in the labor market, attributing this to increased labor supply from immigration and a stronger pool of prime-age workers, alongside lower demand resulting from tight monetary policy.
Kugler indicated that if risks arise that impede progress or cause inflation to reaccelerate, it would be appropriate to pause policy rate cuts. Conversely, if the labor market slows down suddenly, Fed should consider continuing to gradually reduce the policy rate.
ECB’s de Guindos: Inflation easing, but growth falls short of expectations
ECB Vice President Luis de Guindos shared a mixed outlook today, highlighting progress in inflation but tempered growth prospects.
“There’s good news with inflation and not so good news on economic growth,” he remarked, noting ECB’s expectation that services inflation will ease over the coming months.
De Guindos added that inflation is expected to “converge in a clear and stable manner towards price stability, 2%,” a target that reinforces the bank’s commitment to maintaining price control.
On the economic front, de Guindos admitted "recovery we were anticipating is not happening with the intensity we expected". Although household incomes have seen some improvement, it has yet to translate into stronger consumer spending.
Gold Technical: Medium-Term Uptrend Damaged, Spooked by Rapid Rise in 10-Year US Treasury Yield
- Trump Trade of a stronger US dollar and rapidly rising longer-term US Treasury yields have triggered a negative feedback loop into Gold (XAU/USD)
- The longer-term positive aspect of Gold as a hedge and safe haven asset play to counter a potential wider US federal budget deficit will now take a backseat.
- Watch the US$2,484/US$415 support on Gold (XAU/USD)
Since our last publication, Gold (XAU/USD) has rallied as expected and hit a fresh all-time intraday high of US$2,790 on 30 October. The up move has stopped short of the highlighted US$2,850/886 key medium-term resistance zone.
The strong US dollar and rising 10-year Treasury yield are headwinds for Gold
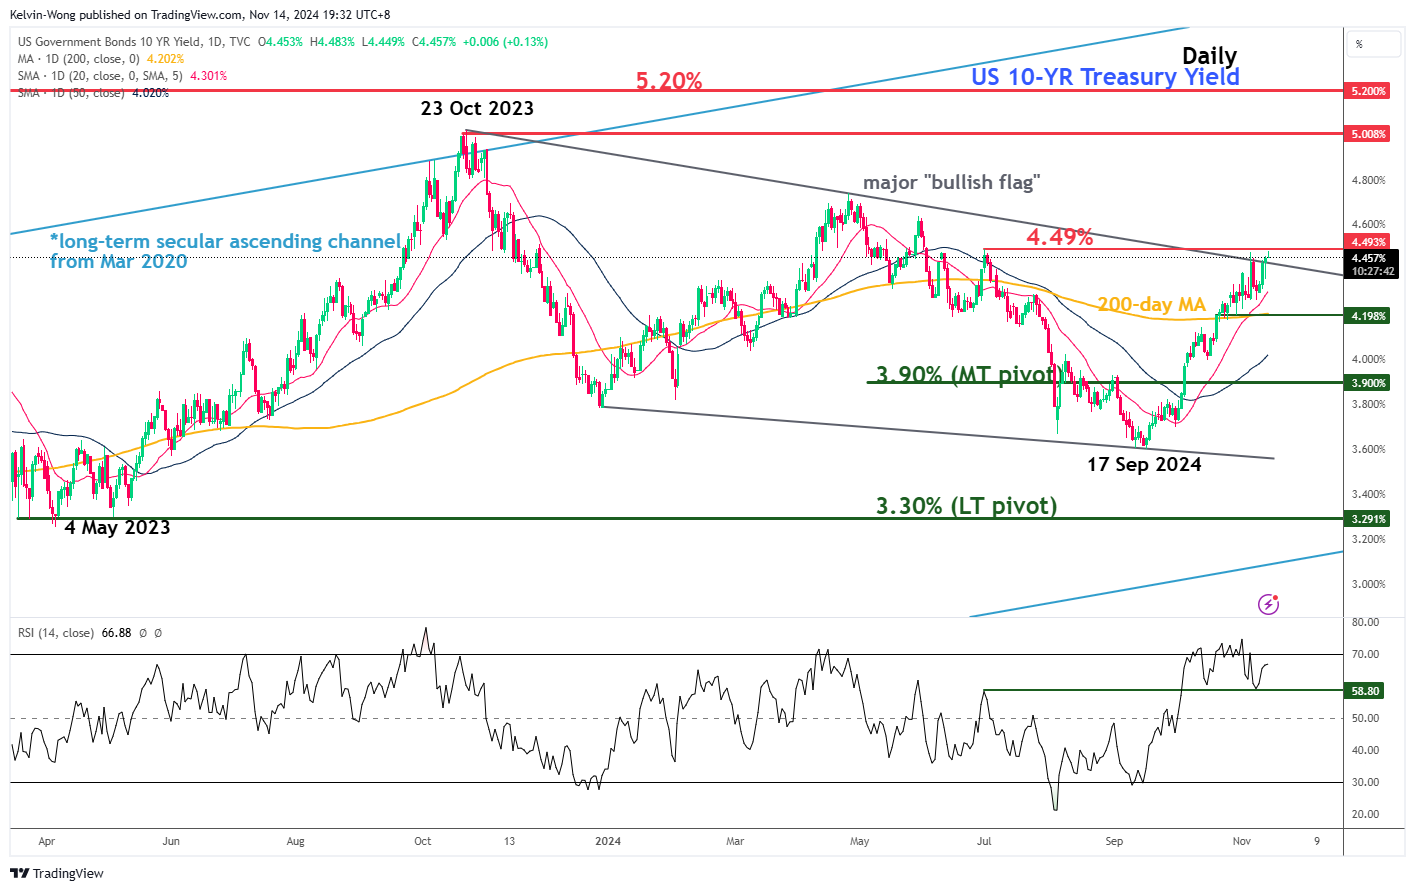
Fig 1: 10-year US Treasury yield medium-term & major trends as of 14 Nov 2024 (Source: TradingView, click to enlarge chart)
After the outcome of the US presidential election on 6 November, market participants continued to focus on the Trump Trade that triggered a significant rally in the US dollar against the major and emerging currencies.
The US Dollar Index rose sharply, broke above a major resistance zone of 105.50/106.37, and hit a year-high high on Wednesday, 13 November.
All in all, it has recorded a gain of 7% from its 27 September low to Thursday, 14 November current intraday value of 106.96 at this time of the writing.
The current persistent strength seen in the US dollar has been primarily attributed to a rapid rise in the 10-year US Treasury yield despite the US Federal Reserve has just started its interest rate cut cycle in September.
The bond vigilantes have likely started to price in a possible scenario that the current Fed’s interest rate cut cycle is likely to be a short and shallow one where the Fed may only cut once or twice next year in 2025 due to the risk of a resurgence of higher inflationary expectations caused by Trump’s proposed policies of deep corporate tax cuts and higher trade tariffs on China and the rest of the world’s exports to the US.
The 10-year US Treasury yield has rallied by 85 basis points since its 17 September low and may be poised for a potential major bullish breakout above 4.49% that can potentially eye the major resistance of 5.20% next (see Fig 1).
If such a bullish scenario arises on the 10-year US Treasury yield, market participants may choose to focus their attention on the negative short-term aspect of Gold caused by a strong US dollar and a further rise in the 10-year US Treasury yield that increases the opportunity costs of holding Gold as it is a non-fixed income asset.
The longer-term positive aspect of Gold as a hedge and safe haven asset play to counter a potential wider US federal budget deficit caused by Trump’s “generous” corporate tax cuts policy, in turn, a catalyst for an erosion of confidence in the demand for US Treasuries has now taken a backseat.
The bearish break of US$2,590 sees further potential weakness in Gold
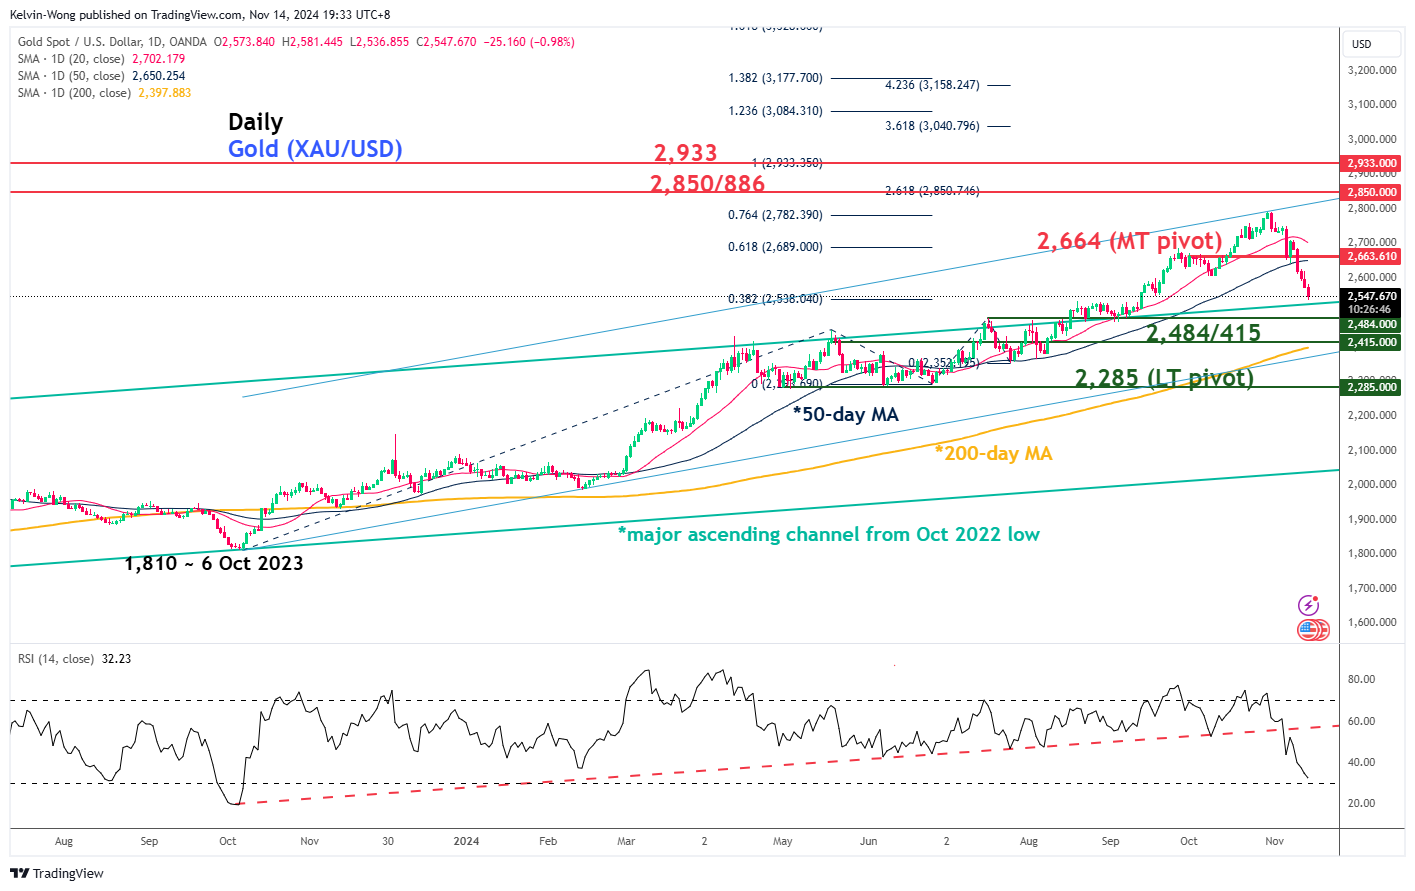
Fig 2: Gold (XAU/USD) medium-term & major trends as of 14 Nov 2024 (Source: TradingView, click to enlarge chart)
Gold (XAU/USD) broke decisively below a key medium-term support zone of US$2,600/US$2,590 on Wednesday, 13 November.
Earlier this week on Monday, 11 November, it broke below its 50-day moving average that held its price actions in the past four months since 3 July which suggests that its medium-term uptrend phase has been damaged (see Fig 2).
The next support zone to watch will be at US$2,484/US$415 (also coincides with the key 200-day moving average), and only a clear break with a weekly close below the US$2,285 long-term pivotal support is likely to put the major uptrend phase of Gold (XAU/USD) in place since October 2022 low in jeopardy.
On the other hand, clearance above the 2,664 key medium-term pivotal resistance may ignite the bullish tone for the resurgence of a fresh impulsive upmove sequence to set sight again on the US$2,850/US$2,886 resistance zone in the first step.
Eurozone industrial production falls -2.0% mom in Sep, EU down -2.0% mom too
Eurozone industrial production dropped significantly by -2.0% mom in September, underperforming market expectations of a -1.2% mom decline. Production for capital goods took a steep hit, falling by -3.8% mom, while energy output also dropped by -1.5% mom. Intermediate goods production stayed flat, and non-durable consumer goods saw increase of 1.6% mom, along with smaller rise of 0.5% mom in durable consumer goods.
The broader EU recorded a matching -2.0% mom fall in industrial output, with notable declines in countries like Ireland (-10.7%), Denmark (-5.0%), and the Netherlands (-2.9%). On the upside, Croatia, Portugal, and Slovenia saw increases of 5.8%, 2.7%, and 1.6%, respectively, although these gains were not enough to offset the overall downturn.