Sample Category Title
Eurozone industrial production falls -2.0% mom in Sep, EU down -2.0% mom too
Eurozone industrial production dropped significantly by -2.0% mom in September, underperforming market expectations of a -1.2% mom decline. Production for capital goods took a steep hit, falling by -3.8% mom, while energy output also dropped by -1.5% mom. Intermediate goods production stayed flat, and non-durable consumer goods saw increase of 1.6% mom, along with smaller rise of 0.5% mom in durable consumer goods.
The broader EU recorded a matching -2.0% mom fall in industrial output, with notable declines in countries like Ireland (-10.7%), Denmark (-5.0%), and the Netherlands (-2.9%). On the upside, Croatia, Portugal, and Slovenia saw increases of 5.8%, 2.7%, and 1.6%, respectively, although these gains were not enough to offset the overall downturn.
NZDUSD Gets Closer to New 2024 low
- NZDUSD continues its sell-off
- Post-US election reaction dictates price action
- Momentum indicators have turned bearish
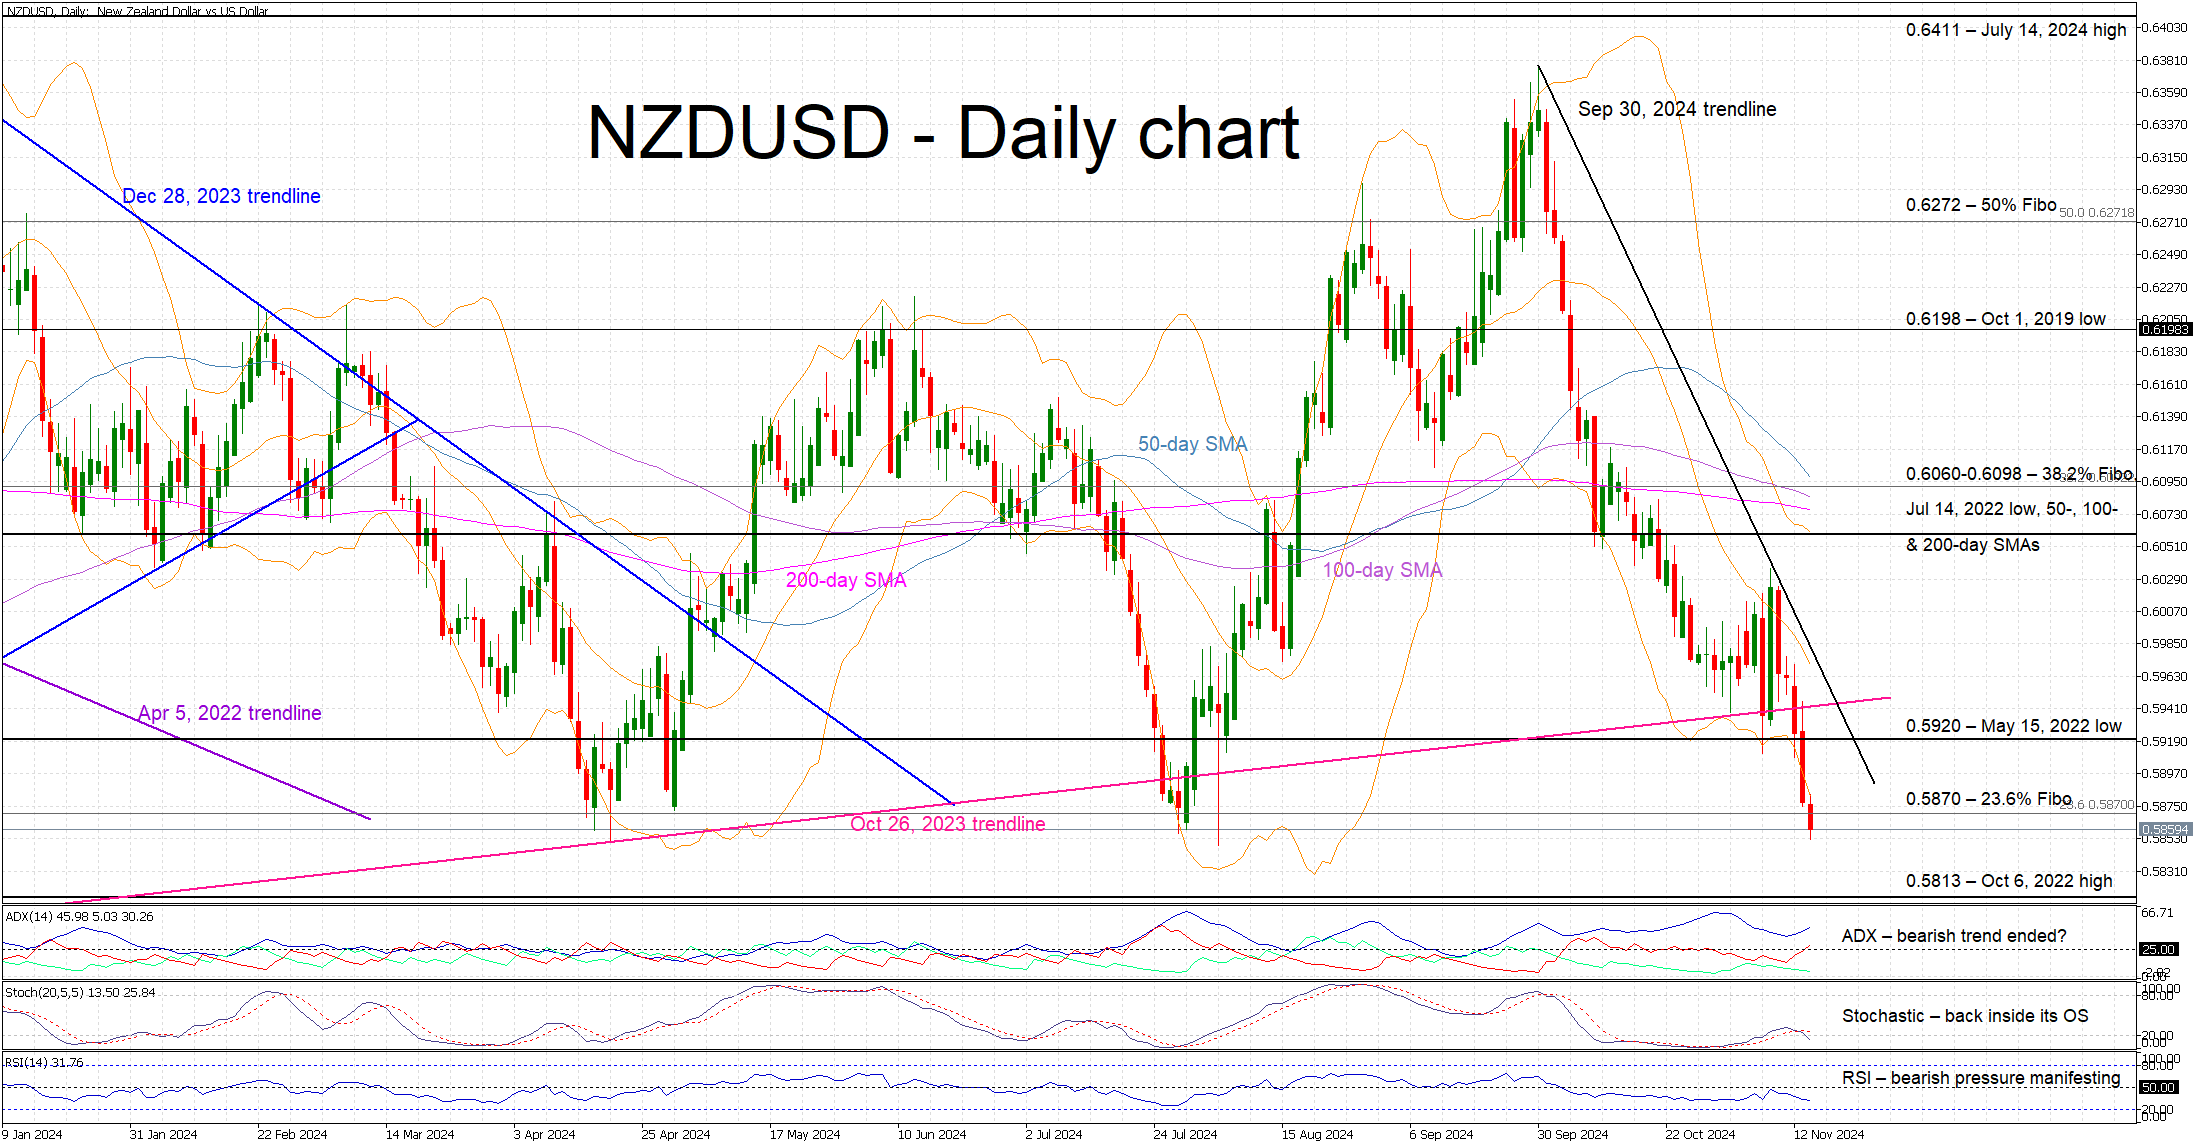
NZDUSD is edging lower again today, recording its fifth consecutive red candle, and keeping the bearish trend from the September 30, 2024 trendline intact. NZDUSD has easily broken below the key October 24, 2023 ascending trendline, and it is now trying to achieve a daily close below by the 0.5870 level. The latest move is the combined result of the US presidential election boosting the dollar, and increased expectations of an aggressive RBNZ rate cut weakening the kiwi.
Meanwhile, the momentum indicators have turned bearish. Specifically, the RSI has dropped above its 50-midpoint, indicating that bearish pressure is increasing. Similarly, the Average Directional Movement Index (ADX) is edging higher and hence confirming the current bearish trend. More importantly, the stochastic oscillator has returned inside its oversold area (OS). It may stay there for a while before showing an appetite for a decisive move higher.
If the bears remain confident, they could try to finally push NZDUSD below the 23.6% Fibonacci retracement of the April 5, 2022 – October 13, 2022 downtrend at 0.5870, and hence have the chance to record a new 2024 low. The door would then be open for a further selloff towards the October 6, 2022 high at 0.5813.
On the other hand, the bulls are anxiously trying to regain market control and keep NZDUSD above 0.5870. If successful, they could then push NZDUSD above both the May 15, 2022 low at 0.5920 and the October 26, 2023 trendline. Higher, the path looks clear until the busy 0.6060-0.6098 range, which is defined by the 38.2% Fibonacci retracement, the July 14, 2022 low, and the 50-, 100- and 200-day simple moving average (SMAs).
To sum up, NZDUSD bears are firmly in control and are potentially preparing for another selloff, if the post-US election euphoria lingers.
AUDUSD Remains in Red; Sellers Seem Cautious
- AUDUSD charts new low after disappointing jobs data
- Short-term outlook remains bearish; sellers eye 0.6470 support
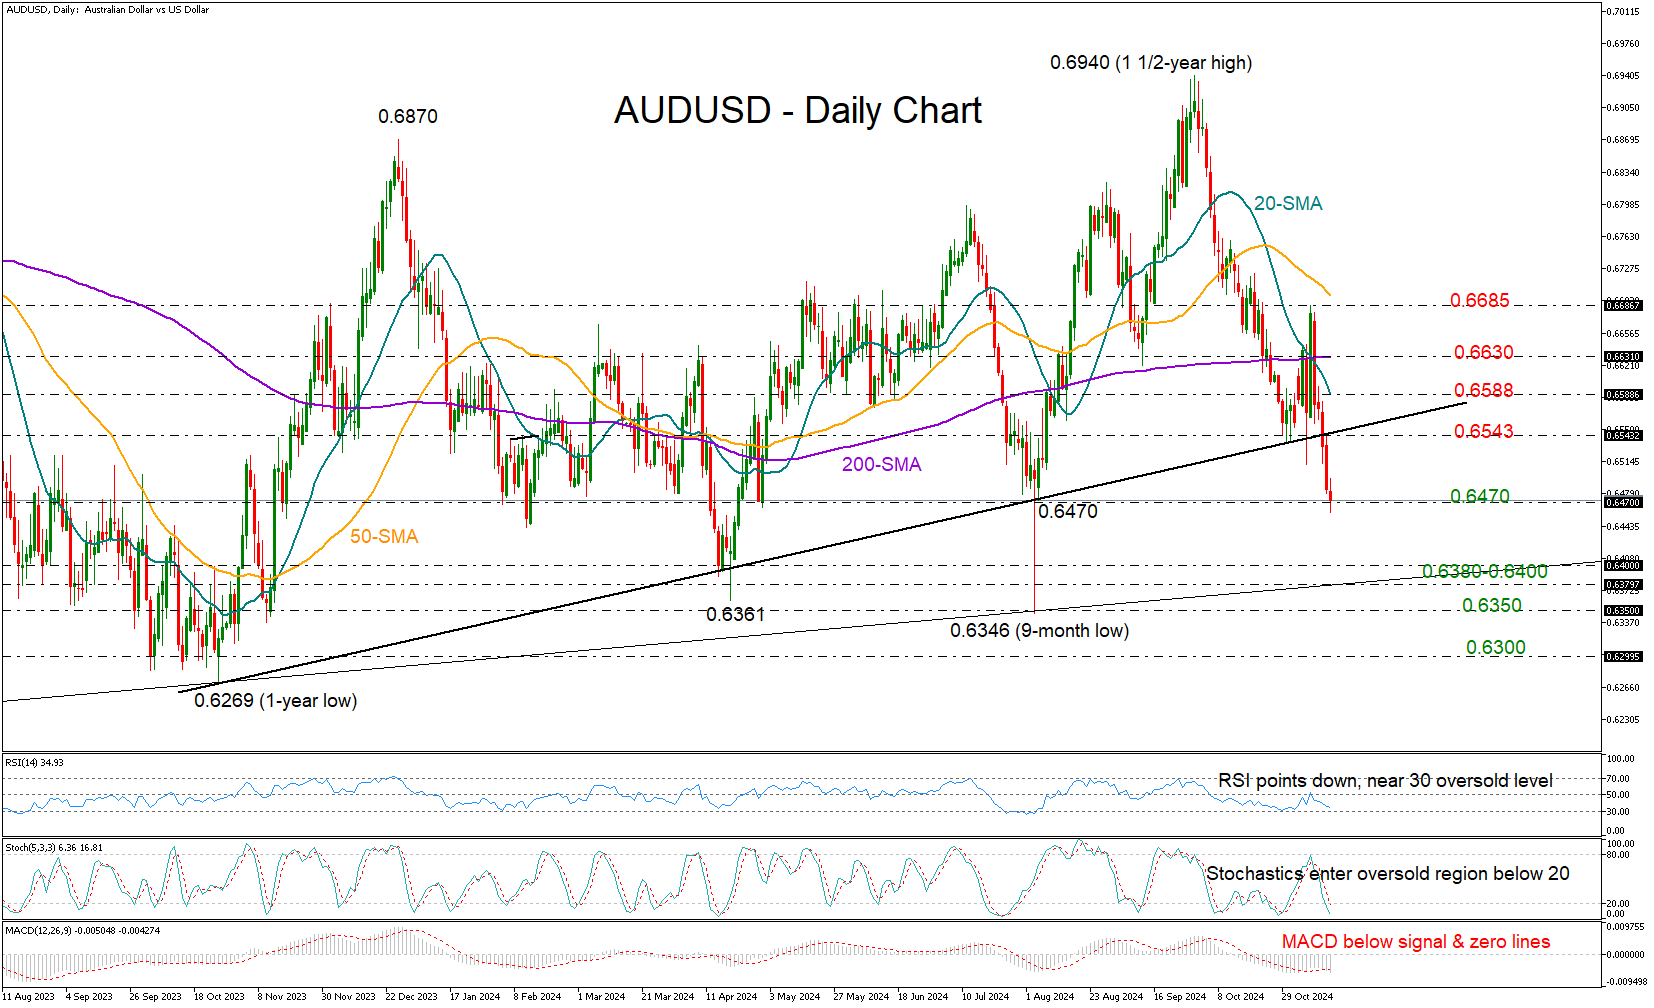
AUDUSD continues its bearish slide, hitting a three-month low of 0.6458 in the wake of weaker-than-expected Australian jobs data early on Thursday.
Having slumped below the key support trendline that delivered two impressive bullish cycles earlier this year, the pair might be at risk of a bearish continuation, though with the price returning above the August base of 0.6470, hesitation among sellers is evident.
Moreover, with the RSI and stochastic oscillator fluctuating near oversold levels, a rebound is possible. In the opposite case, additional losses could target the 0.6380-0.6400 zone, where the important 2022 trendline is positioned. A close below that floor could initially stall near 0.6350 and then around the October 2023 base of 0.6300.
On the upside, an upside reversal could challenge the broken trendline at 0.6543. If that proves easy to claim, the bulls may next head for the 20-day SMA at 0.6588 and then toward the flattening 200-day SMA at 0.6630. A sustained rally above the previous high of 0.6685 could signal a shift in the downtrend.
Overall, while AUDUSD is facing a bearish situation, the technical signals suggest selling pressure could soon lose pace.
GBP/USD Outlook: Steep Post-US Election Bear Leg Extends Below 1.2700
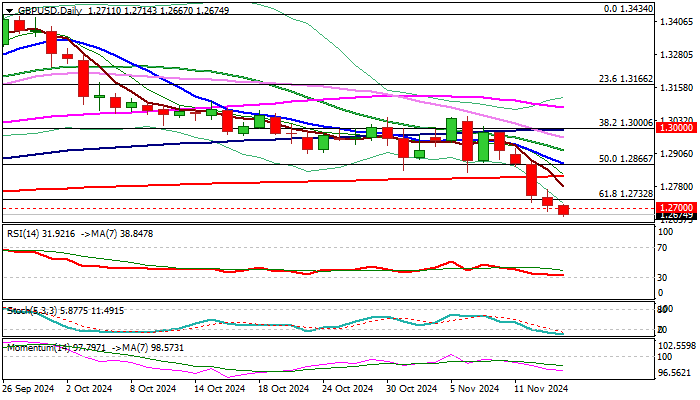
Cable continues to trend lower, riding on the wave of so-called Trump trades, as dollar rose significantly on post-election euphoria.
Steep bear leg extends into fifth consecutive day and hit new multi-week low, coming close to target at 1.2664 (Aug 8 low) guarding 1.2612 (June 27 low) on renewed probe through 1.2700 support, after bears cracked this level on Wednesday but failed to register close below it.
Oversold conditions so far do not impact bears, but some price adjustment should be expected in coming sessions.
Broken Fibo support at 1.2732 reverted to initial resistance, with 200DMA (1.2818) to cap upticks and keep larger bearish structure intact for fresh push lower.
Res: 1.2700; 1.2782; 1.2818; 1.2836.
Sup: 1.2664; 1.2612; 1.2599; 1.2567.
Commodity Currencies Reach New Lows
The rally in Bitcoin, meme coins, and the US dollar that followed Donald Trump’s presidential victory continues to gain momentum. The tariff cuts announced by the new president-elect have already contributed to declines in gold and commodity prices. Combined with the potential for heightened trade tensions with China, the current environment is pressuring currencies such as the AUD and CAD.
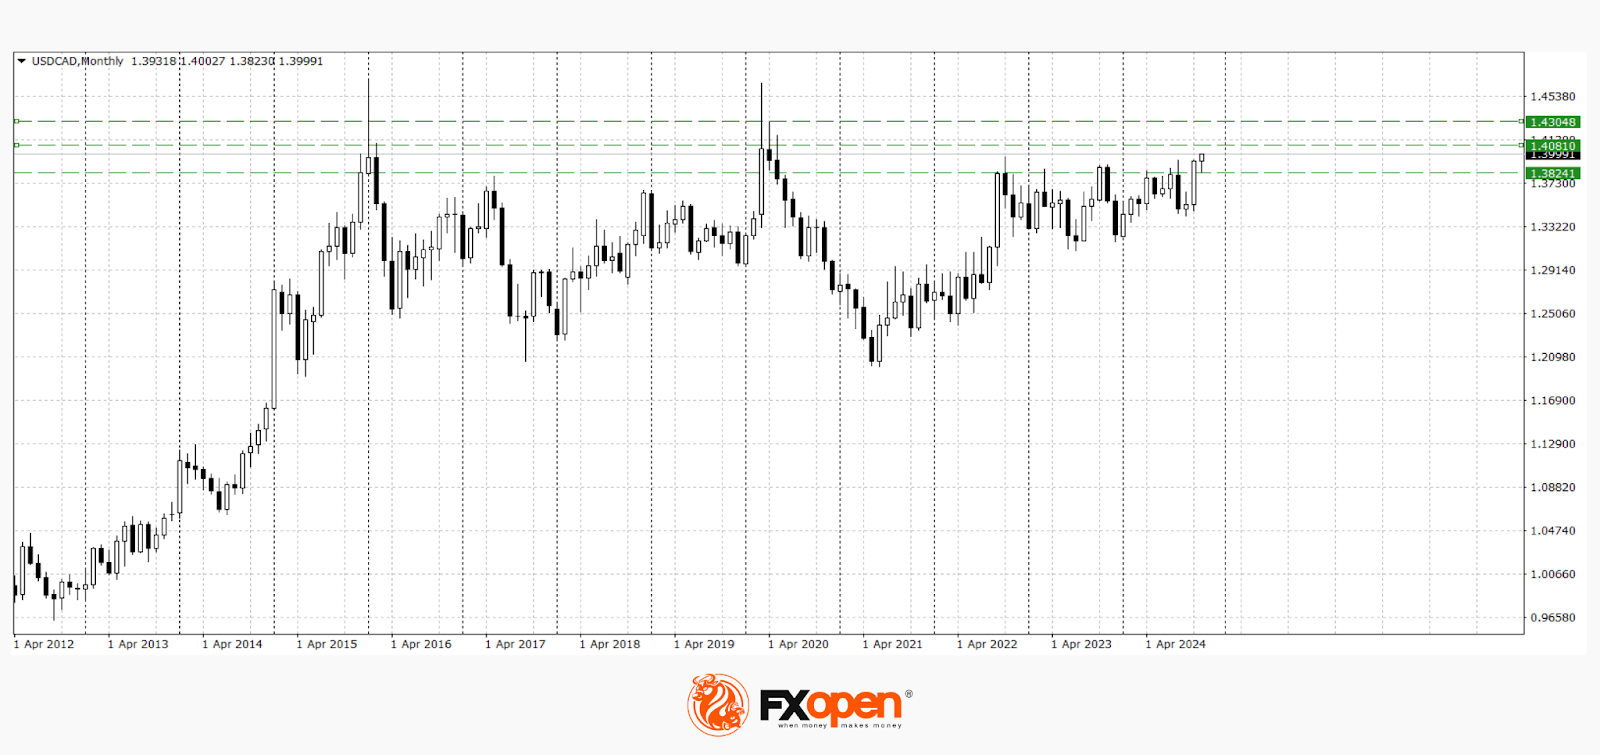
USD/CAD
Yesterday, USD/CAD buyers managed to test the psychological resistance level at 1.4000. The pair has long traded within the range of 1.3960–1.3800, but it has recently broken above this channel to reach a two-year high at 1.3960. Technical analysis points to the potential for further gains towards 1.4200–1.4300, provided the 1.4000–1.3960 levels hold as support. A downward correction, however, could bring the pair back to 1.3960–1.3900.
Key events likely to impact USD/CAD pricing today include:
- At 16:30 (GMT +3:00): US Initial Jobless Claims.
- At 16:30 (GMT +3:00): US Producer Price Index (PPI) for October.
- At 19:00 (GMT +3:00): Weekly US crude oil inventory report.
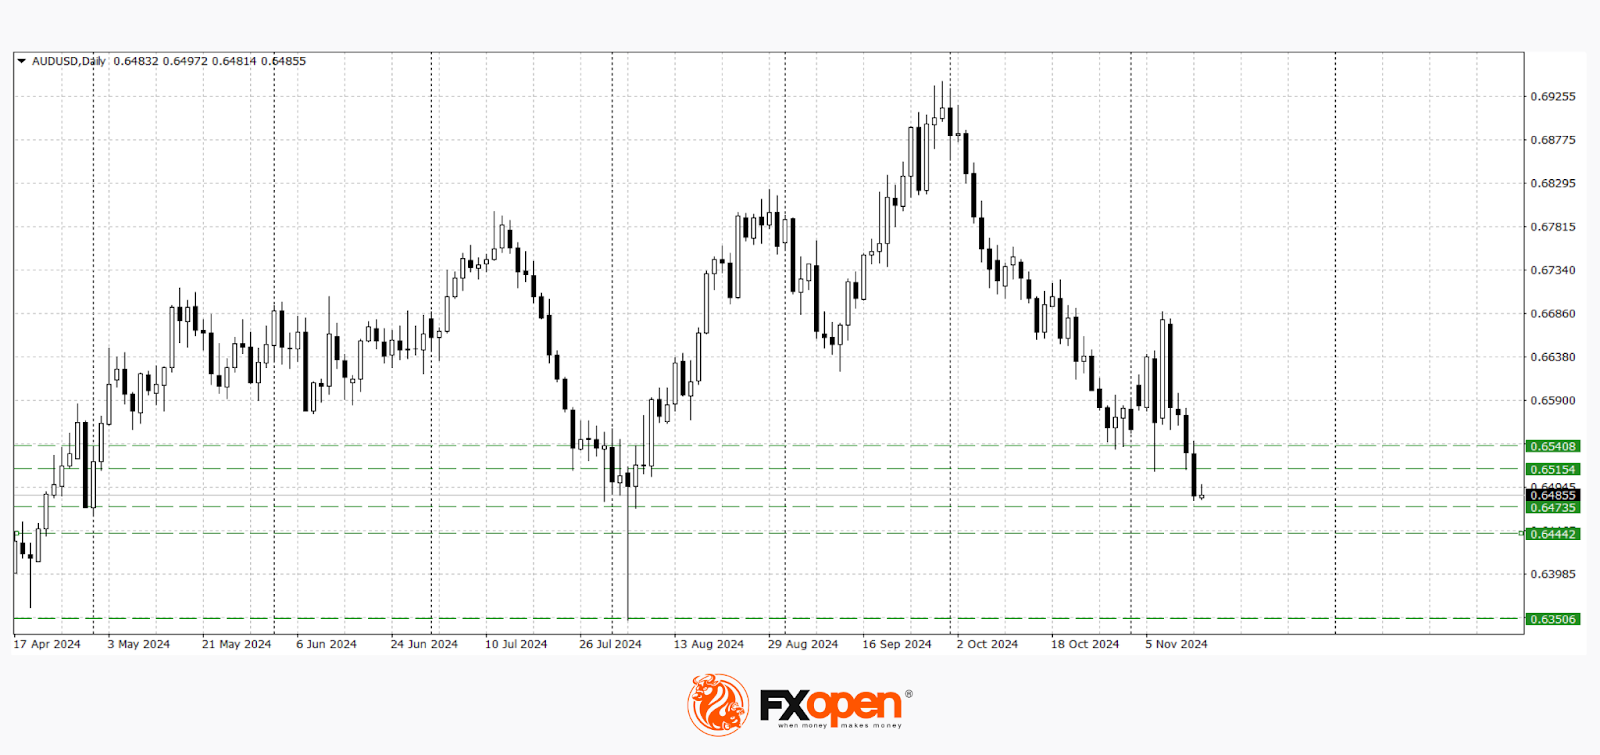
AUD/USD
Early in this trading week, AUD/USD sellers broke through a significant range at 0.6520–0.6500. The next potential support area is around 0.6470–0.6440. Should the pair break below these levels, new yearly lows around 0.6350 are possible. If an upward correction begins, the pair may rise towards 0.6520–0.6540.
Key events affecting AUD/USD include:
- At 23:30 (GMT +3:00) today: Remarks by US Federal Reserve Chair Jerome Powell.
- Tomorrow at 05:00 (GMT +3:00): Thomson Reuters/Ipsos’ Primary Consumer Sentiment Index (PCSI) for Australia for November.
- Tomorrow at 05:00 (GMT +3:00): Press conference by China’s National Bureau of Statistics.
Trade over 50 forex markets 24 hours a day with FXOpen. Take advantage of low commissions, deep liquidity, and spreads from 0.0 pips. Open your FXOpen account now or learn more about trading forex with FXOpen.
This article represents the opinion of the Companies operating under the FXOpen brand only. It is not to be construed as an offer, solicitation, or recommendation with respect to products and services provided by the Companies operating under the FXOpen brand, nor is it to be considered financial advice.
S&P 500 Index Stabilises Near Resistance Block
The ATR indicator on the S&P 500’s 4-hour chart (US SPX 500 mini on FXOpen) currently shows a reduction in price volatility.
This drop in volatility can likely be attributed to:
→ The market having fully absorbed the impact of Trump’s recent presidential win;
→ No unexpected news from yesterday’s CPI report, which matched analysts’ inflation expectations.
Looking ahead, Morgan Stanley analysts believe the bull market could face challenges from:
→ A rise in treasury bond yields, potentially diverting investor funds;
→ A strengthening dollar, which could reduce export revenues for large companies;
→ Indicators suggesting stock valuations are becoming even more stretched.
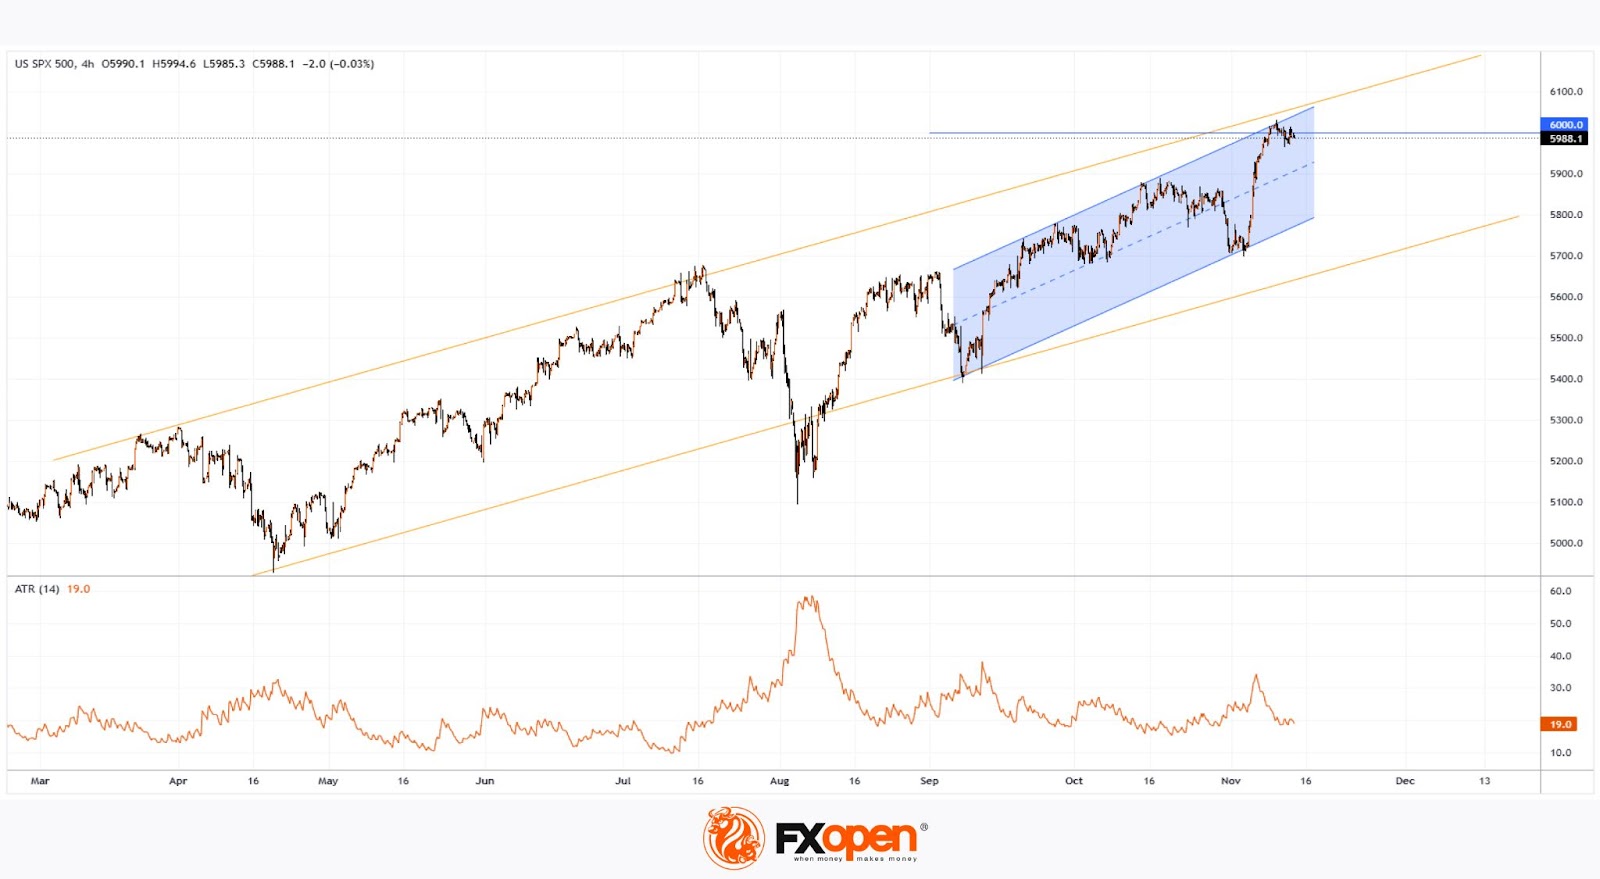
Technical analysis of the S&P 500 chart (US SPX 500 mini on FXOpen) highlights that price is at a resistance zone created by:
→ The upper boundary of the upward blue channel, which began in early September;
→ The upper edge of the long-term ascending channel (shown in orange, previously charted in our S&P 500 analysis on October 14);
→ The psychological level of 6,000 points.
Given these factors, it’s reasonable to anticipate that bulls may encounter difficulties if they attempt to push past the 6,000 level.
A potential pullback may emerge following the S&P 500's 4% rise since early November—perhaps towards the channel’s median or lower boundary.
Trade global index CFDs with zero commission and tight spreads. Open your FXOpen account now or learn more about trading index CFDs with FXOpen.
This article represents the opinion of the Companies operating under the FXOpen brand only. It is not to be construed as an offer, solicitation, or recommendation with respect to products and services provided by the Companies operating under the FXOpen brand, nor is it to be considered financial advice.
Dollar and US Yield Momentum is Strong
Markets
US October inflation figures printed bang in line with expectations. Headline inflation picked up to 2.6% and core inflation matched September’s 3.3% with clear signs of price stickiness in housing-related costs (0.4% m/m) and core services ex housing. The latter rose 0.31% m/m and accelerated on an annualized three-month rolling average to 4.24% - the quickest since April of this year. US yields fell as much as 12.6 bps at the front in absence of an upward inflation surprise which, according to Fed Kashkari on Tuesday, could have nudged the Fed into pause in the wake of Trump’s election victory. The dust settled quickly and yields eventually lost less than halve of the initial losses at the front while the long end added almost 7 bps. The 10-yr yield escaped from a 13-month long downward wedge to test resistance at 4.47%. German rates were inspired by Merz keeping the door wide open for reforming the constitutional debt brake when speaking at a business conference yesterday. Merz’ CDU/CSU party is leading the polls ahead of the February 23 snap election. Yields in the country added between 2.8-3.5 bps with Bunds underperforming vs swap. Dollar domination continued on currency markets. EUR/USD broke below 1.06 (previous YtD low) with an immediate technical acceleration bringing the pair towards 1.056, the weakest level since November 2023. EUR/USD is on track to revisit the 2023 low of 1.0448. The trade-weighted index cracked 106 and moves beyond the April/YtD high of 106.51 in Asian dealings this morning. Dollar and US yield momentum is strong and there is little from the economic calendar’s side that could change that near term. Fed chair Powell speeches later today but will probably stick to the script of last week on the most important market topic today – Trump policy: “We don't guess, we don't speculate, and we don't assume.” Sterling was better bid after Tuesday’s slide, losing only against its larger Anglo-Saxo counterpart. EUR/GBP returned from an intraday high just south of 0.835 to 0.831. The UK calendar is empty but for a speech by Bank of England governor Bailey at the Mansion House. He shares the stage with Chancellor Reeves. UK Treasury said Reeves’ debut address would “set out how we will support our world-leading financial services sector to grow, innovate and finance growth around the country".
News & Views
The Australian labour market shows tentative signs of cooling in October but without endangering the broader healthy picture. Monthly job growth erased from a very strong 61.3k in September to 15.9k in October. The Australian Bureau of Statistics analyses that the 0.1% increase was the slowest in recent months. Over the previous six months employment rose by an average of 0.3% per month. The unemployment rate for the third month in a row printed at 4.1%, about 0.6% higher compared to the 3.5% of June 2023, but still 1.1 ppts below the March 2020 level when it was 5.5%. The number of unemployed people was 67k higher compared to a year ago, but still 82k lower compared to the March 2020 reference. With population growth in October outpacing the small rise in employment and unemployment, the participation rate fell slightly to 67.1% (from 67.2%). The report won’t change the RBA assessment that its too early to ease policy any time soon. Markets currently discount a first rate cut by summer next year. The Aussie dollar nevertheless continues to suffer from broader USD strength with AUD/USD falling below the 0.65 big figure (currently 0.647).
Eurex Clearing has postponed the introduction of a futures contract tied to European Union debt, Bloomberg reported yesterday. The launch was originally planned for this year. However, in comments to Bloomberg, Eurex indicated that it was a key prerequisite that the EU bond program becomes sustainable and of a long-term nature beyond 2026. After stepping up issuance during the pandemic, the EU currently has no concrete plans to issue bonds raising the volume of debt beyond 2026. The exchange indicated it wants to see new debt beyond 2026 to support a 10-y futures contract.
Something Must Give
US inflation came in parallel to expectations, confirming that headline inflation in the US stagnated near 0.3% level for a third month, the yearly figure rebounded from 2.4% to 2.6% as expected, while core inflation remained stuck at 3.3%. The difference between the headline and core inflation comes from weak oil prices, which help tame the index that includes the volatile food and energy prices, but housing, used cars, airfares and medical care continued to push the core figure higher. And the core CPI hasn’t eased since July, averaging near 3.5% this year, according to Bloomberg. In summary, the data looked good, but could’ve been better. The market reaction to the data was mixed. The US 2-year yield eased after hitting a fresh high since summer, the probability of a 25bp cut in December jumped back to 80% from around 60% before the CPI data, and Minneapolis Federal Reserve (Fed) Neel Kashkari hinted that he liked yesterday’s inflation data. On the long end of the curve, however, the US 10-year continued to push higher and is preparing to reach the 4.50% level as next stop amid the rising bets that the yield deserves to hit the 5% mark on prospects of higher inflation under Trump’s pro-growth policies, upcoming tariffs and the Fed’s potential ignorance of the upcoming inflationary pressures. The US 30-year yield is now at 4.65%.
As such, the US dollar – that looked slightly soft after the CPI data –rebounded to extend its rally to fresh highs. The US dollar index has now hit the highest levels in a year, it’s clearly in the overbought market territory, with the RSI index screaming that the dollar has been probably bought too fast and in a too short period of time and a minor correction could be healthy at the current levels. Yet, the picture is clear, the US dollar outlook is comfortably positive and the bulls are tempted to buy on rising suspicion regarding the Fed’s ability to keep cutting the interest rates. Note that the bets for next year cuts have halved since last month.
As such, the EUR/USD tanked to 1.0534 level this morning with the bears eyeing the 1.05 mark. The RSI indicator – that’s warning of oversold conditions in parallel to the overbought conditions of the dollar index – seems to be the only challenge for the euro bears right now. Across the channel, Cable eased to 1.2673, the pair is also very close to oversold conditions. The AUDUSD pulled out the 65 cents support and is weakening below this level, supported by the data that showed that inflation in Australia fell to a 3-year low. And the USDJPY spiked past the 156 level this morning, near overbought as well, but with some additional margin left before the Japanese authorities intervene directly to ease the selling pressure near the 160s level. The USDCHF rallied past the 200-DMA and the USD/CAD has pulled out the 1.40 target and is consolidating gains above this psychological mark. I believe that the temptation to long the US dollar at the current overbought levels should start fading in the short-run and bring in some tactical shorts to ride on a minor correction. But the medium-term outlook looks bullish for the US dollar. Price pullbacks could be interesting opportunities to strengthen the bullish US dollar positions.
Data watch
The US will reveal its latest PPI update today, and the figures are expected to point at an uptick in factory-gate prices in October. The headline PPI is seen rebounding from 1.8% to 2.3% in October, and core PPI from 2.8% to 3%. And don’t forget that there are components in these figures that feed into the Fed’s PCE index. Therefore, even if these numbers are in line with expectations, they should be warning that a 25bp cut from the Fed is probably not the right thing to do. I am not saying that the Fed won’t do it. I am just saying that it’s probably not the right thing to do.
Fed Chair Powel will speak today. I am curious to hear what he say to say, if he says anything at all in the face of the US politics that are turning into a massive TV reality show.
Elsewhere, the S&P500 consolidated near ATH levels, Nasdaq 100 was slightly down, while the Dow Jones was slightly up. The Russell 2000 stocks didn’t like the upside pressure in yields probably, because the index fell nearly 1%. European stocks failed to cheer the weaker euro, as Trump is much less supportive of the valuations on this side of the Atlantic Ocean than he is at home. The only positive in Trump’s threats is its potential to push the European Central Bank (ECB) to cut rates thoroughly to give support to the already-weakened European economies. But alas, to do be able to cut the rates, the ECB needs to make sure that inflation has stabilized. Yet, the rapid depreciation of the euro puts that objective in jeopardy.
In energy, oil made a short attempt to the upside yesterday on a surprise decline in US oil inventories last week, but gains remained limited. The barrel of US crude is seeing a strong resistance this morning near the $68pb level. Numerous failures to clear the $72.85pb Fibonacci resistance keeps the market in the hands of the bears, with the ambition to pish the price of a barrel to $65pb target.
US PPI and Euro Area GDP Data on Today’s Menu
In focus today
From the US, October PPI is due for release today. Yesterday's CPI print was largely in line with expectations (see more in section below) hence it will be interesting to see if October PPI data mirrors this. In the evening, the Fed chair Powell will be on the wires.
In the euro area, we will receive the second estimate of Q3 GDP. Focus will be on employment developments in Q3, since a continued strong labour market is important for the growth outlook in 2025. We will also receive industrial production data for September, which will show how actual production fared. The data is interesting as hard data has been better compared to PMIs in the manufacturing sector. We also get the ECB minutes from the October meeting.
In Sweden, the final inflation data for October is released at 8.00 CET. The reading will provide insights into last week's flash estimate, which was a bit higher than expected, and deviated 0.3-0.4 pp. from the Riksbank's September forecasts. We suspect the deviation could be due to higher food prices, as was largely the case in September.
Overnight, we get the monthly batch of data in China for retail sales, home sales, home prices, industrial production and investments. Focus will be on the housing data as a recovery here holds the key to unleashing private consumption as well. Some early data has suggested home sales rebounded in October following the recent stimulus measures.
Similarly, we also receive Japanese Q3 national accounts including GDP growth overnight. Both the Tankan and PMI surveys suggest the recovery has remained on track. Demand also looks quite solid, particularly exports. Consensus sees modest 0.2% GDP growth following the 0.7% Q2 rebound.
Economic and market news
What happened yesterday
In the US, October CPI was largely in line with expectations at 0.2% m/m SA (cons: 0.2%, prior: 0.2%). While the annual figure jumped to 2.6% y/y from 2.4%, the uptick was almost purely related to a weaker print a year ago. The core measure also came in as expected at 0.28% m/m SA (cons: 0.3%, prior: 0.31%). Around 60% of the increase in core prices attributed to the shelter component, which ticked higher in October, but remains on a cooling trend. All other major components in the core inflation basket showed easing price pressures. Overall, the print supports our call for the Fed to deliver a 25bp cut in December. Moreover, a series of Fed speakers was on the wire, all expressing uncertainty over where rates ultimately would settle.
In politics, the US Republican party secured the 218 seats required to control the House of Representatives. This officially confirms the very widely anticipated red sweep as the GOP now controls the House, the Senate and the Presidency.
In Germany, the country's biggest industrial union, IG Metall, reached a new wage agreement with employers. The new agreements include a wage increase of 2.0% in 2025 and 3.1% in 2026 plus a one-off payment of EUR 600 in 2025 (down from EUR 1,400 in 2024). The low increase for 2025 reflects weaker bargaining power in German industry. With 3.9 million members, IG Metall's deal sets a key low benchmark for other sectors and may also influence the ECB's December staff projections for wage growth next year, supporting the case for back-to-back rate cuts in 2025. However, the employment situation in German industry is relatively weak, meaning that its impact on aggregate euro area wage growth could be lower than usual. In 2026 real wage growth in Germany is expected to markedly rebound as the collective agreement also includes an 8pp increase in the supplementary payment, benefitting lower-wage groups most. While wage growth has been elevated in the recent period, we believe elevated wage growth concerns have become smaller for the ECB.
In Sweden, the Rikbank's minutes from the November meeting suggested that the board see balanced risk to their inflation forecasts and that upside risks to inflation stem primarily from a weaker SEK and food prices.
In crypto space, Bitcoin continued its upward trend, breaching USD 90,000 for the first time ever during yesterday's session spurred by Trump's election win last week. Prior to his victory, Bitcoin was hovering around USD 70,000. As of this morning, it is trading around USD 89,840.
Equities: Global equities were marginally lower yesterday with the US once again outperforming, although not to the same extent as in the first days after the US election. The Republican party surpassed the 218-line for the House of Representatives. Hence, we can now firmly conclude the red sweep, although nine districts still need to be decided.
Despite equities moving slightly lower yesterday, we observed the VIX index drifting lower. While not being overly controversial, it still suggests to us that investors are rather confident about the economic outlook, and we are seeing opinions converging. We would not be surprised to see surveys soon indicating that investors are aligning in terms of risk levels, regional, sectoral, and style allocations. In the US yesterday: Dow +0.1%, S&P 500 +0.02%, Nasdaq -0.3%, and Russell 2000 -0.9%. Asian markets are mixed this morning. The same could be said about Western market futures, with European futures being higher while US ones are slightly lower.
FI: European rates traded in a very tight range yesterday, with 10y bunds in a 4bp high-low range. The US CPI sent short-end US bond yields sharply lower, albeit it was short lived. By the end of the trading session the US yield curve steepened in both the 2s10s and the 10s30s segments. After a couple of days with ASW-spreads trading in positive territory, the Bund-spread went negative again yesterday amid significant supply. ECB's Kazaks argued for a measured pace in rate cuts and highlighted that the Q3 GDP print made him less concerned with the labour market situation.
FX: Despite details leaning to the softer side, a renewed leg of broad dollar strength followed yesterday's US CPI. EUR/USD is consolidating at year-to-date lows below 1.06 whereas USD/SEK is challenging previous 2024-highs around 11.00. EUR/SEK and EUR/NOK both kept within previous ranges, but NOK/SEK edged slightly higher. The sterling fared second best within G10, holding steady versus the dollar on the day and strengthening slightly versus the euro. USD/JPY is back above 155 for the first time since the last round of Japanese FX interventions in mid-July.
GBP/JPY Daily Outlook
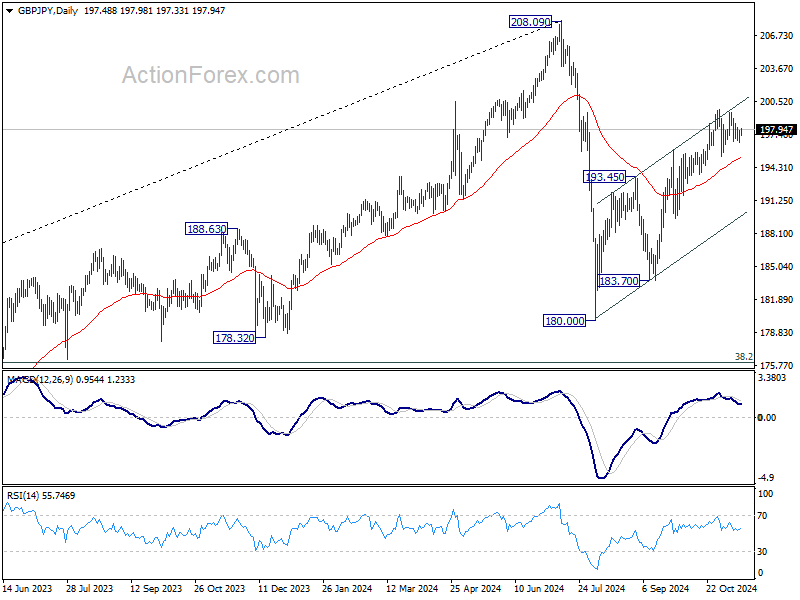
Daily Pivots: (S1) 196.89; (P) 197.35; (R1) 198.05; More...
Intraday bias in GBP/JPY remains neutral as range trading continues below 199.79. Further rally is expected as long as 55 D EMA (now at 195.24) holds. Above 199.79 will resume the rebound from 180.00 to retest 208.09 high. However, sustained break of 55 D EMA will argue that the corrective rise has completed already, and turn near term outlook bearish for 180.00/183.70 support zone.
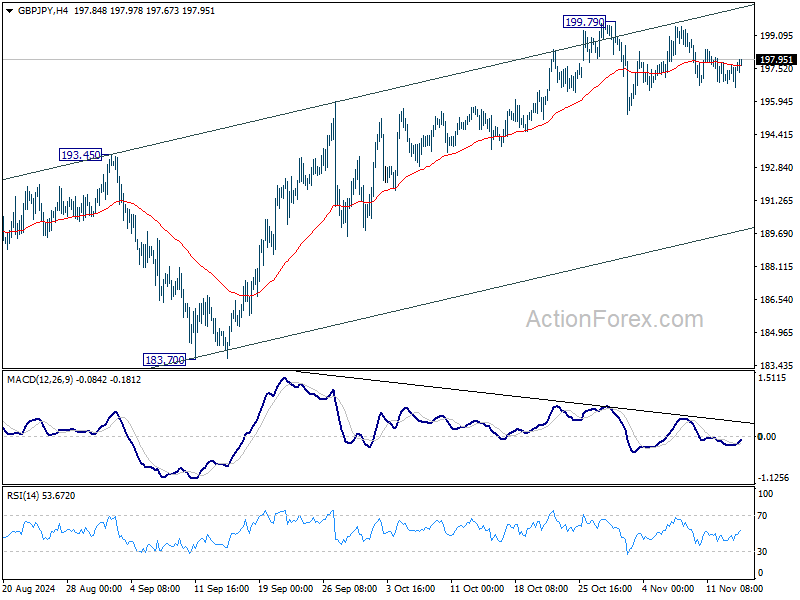
In the bigger picture, price actions from 208.09 are seen as a correction to whole rally from 123.94 (2020 low). The range of consolidation should be set between 38.2% retracement of 123.94 to 208.09 at 175.94 and 208.09. However, decisive break of 175.94 will argue that deeper correction is underway.