Sample Category Title
EUR/AUD Daily Outlook
Daily Pivots: (S1) 1.6247; (P) 1.6280; (R1) 1.6320; More...
EUR/AUD is staying in consolidation above 1.6161 temporary low and intraday bias remains neutral. Risk will stay mildly on the downside as long as 1.6598 holds, in case of stronger rebound. On the downside, break of 1.6161 will resume the decline from 1.6590 to target a test on 1.5996/6002 key support zone.
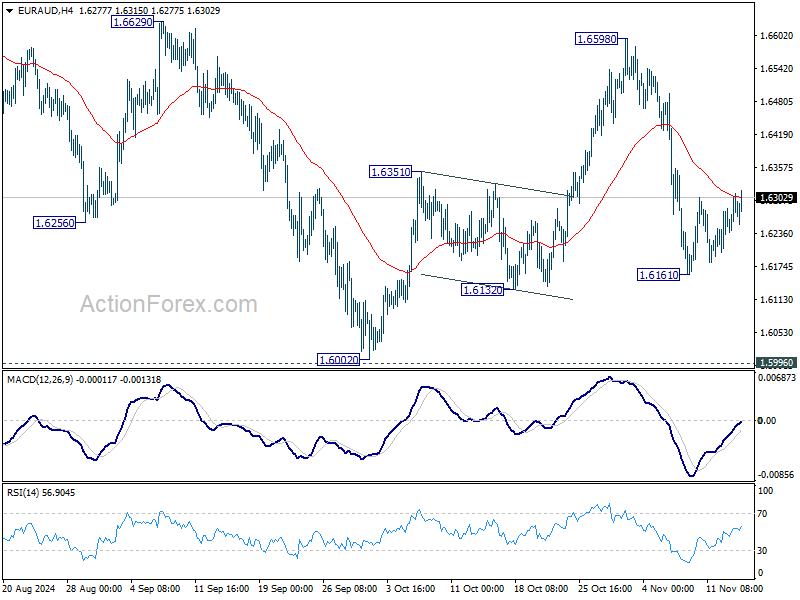
In the bigger picture, as long as 1.5996 cluster support , up trend from 1.4281 (2022 low) is still expected to resume through 1.7180 at a later stage. However decisive break of 1.5996 will argue that the medium term trend might have reversed. Deeper fall would be seen to 61.8% retracement of 1.4281 (2022 low) to 1.7180 at 1.5388, even as a correction.
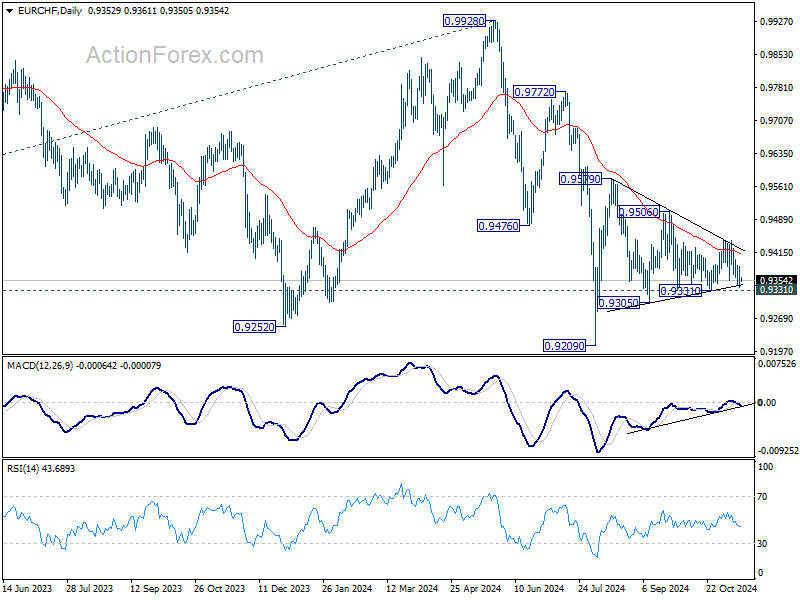
EUR/CHF Daily Outlook
Daily Pivots: (S1) 0.9338; (P) 0.9363; (R1) 0.9385; More....
Range trading continues in EUR/CHF and intraday bias stays neutral. On the downside, break of 0.9331 will target 0.9305 support first. Firm break there will bring retest of 0.9209 low. On the upside, break of 0.9444 will bring stronger rally to 0.9506 resistance next.
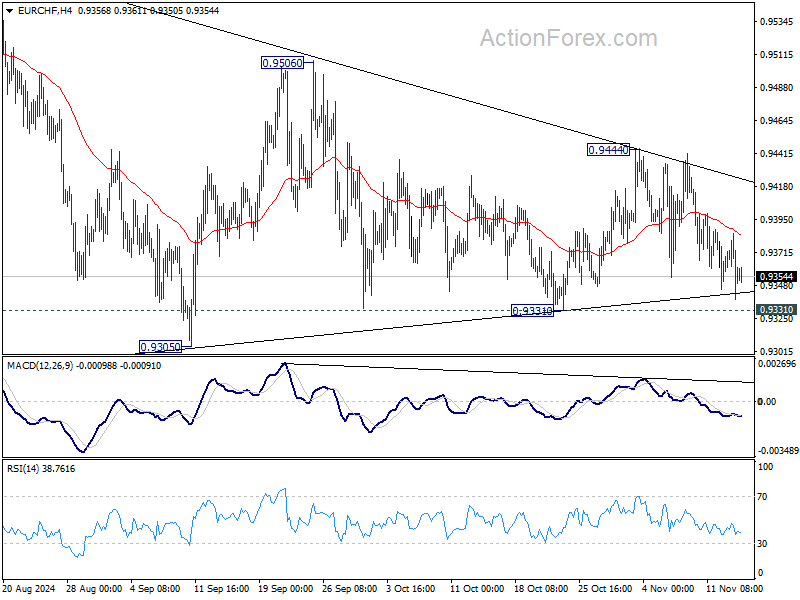
In the bigger picture, fall from 0.9928 is seen as part of the long term down trend. Repeated rejection by 55 D EMA (now at 0.9419) keeps outlook bearish for breaking through 0.9209 low at a later stage. Nevertheless, sustained trading above 55 D EMA will confirm medium term bottoming at 0.9209 and bring stronger rebound back towards 0.9928 key resistance.
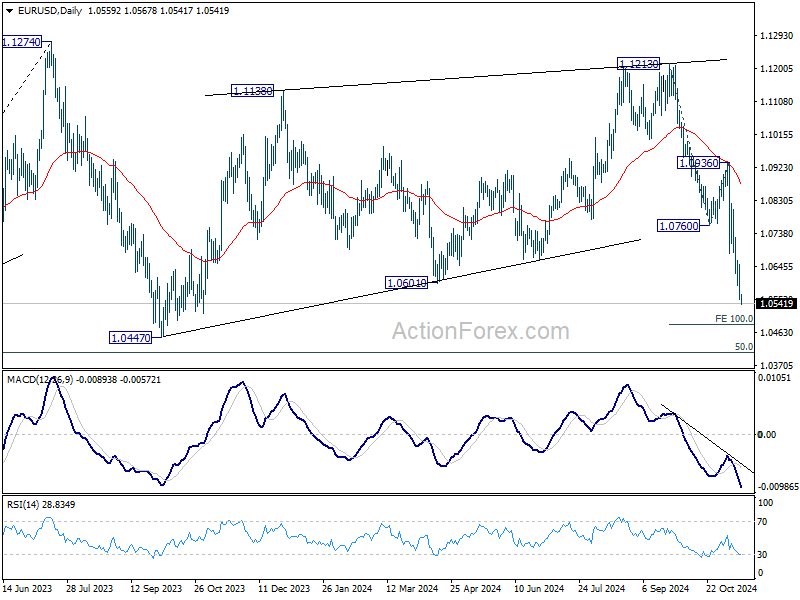
EUR/USD Daily Outlook
Daily Pivots: (S1) 1.0529; (P) 1.0591; (R1) 1.0627; More...
EUR/USD's fall from 1.1213 resumed after brief recovery and intraday bias is back on the downside. Further decline should be seen to 100% projection of 1.1213 to 1.0760 from 1.0936 at 1.0483. Break there will target 1.0404 key fibonacci level. On the upside, above 1.0652 minor resistance will turn intraday bias neutral again first. But outlook will stay bearish as long as 1.0760 support turned resistance holds, in case of recovery.
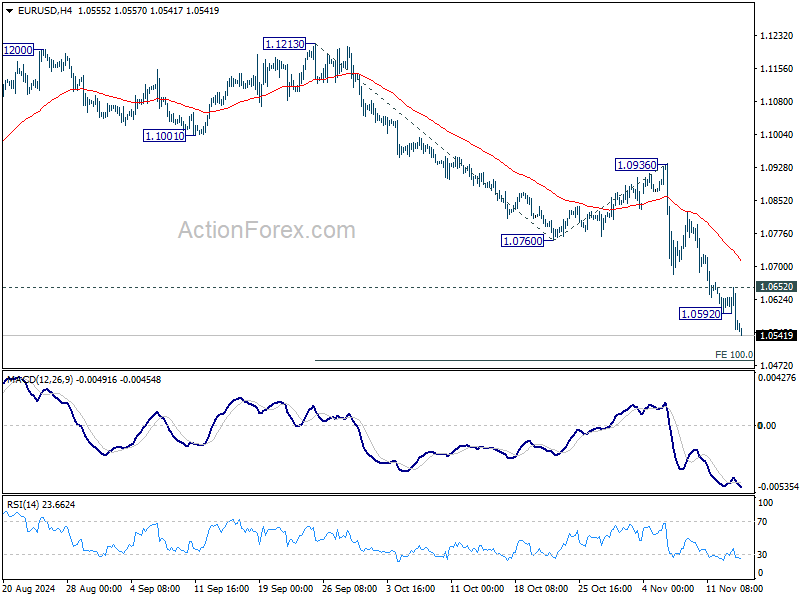
In the bigger picture, price actions from 1.1274 (2023 high) are seen as a consolidation pattern to up trend from 0.9534 (2022 low), with fall from 1.1213 as the third leg. Downside should be contained by 50% retracement of 0.9534 (2022 low) to 1.1274 at 1.0404, to bring up trend resumption at a later stage.
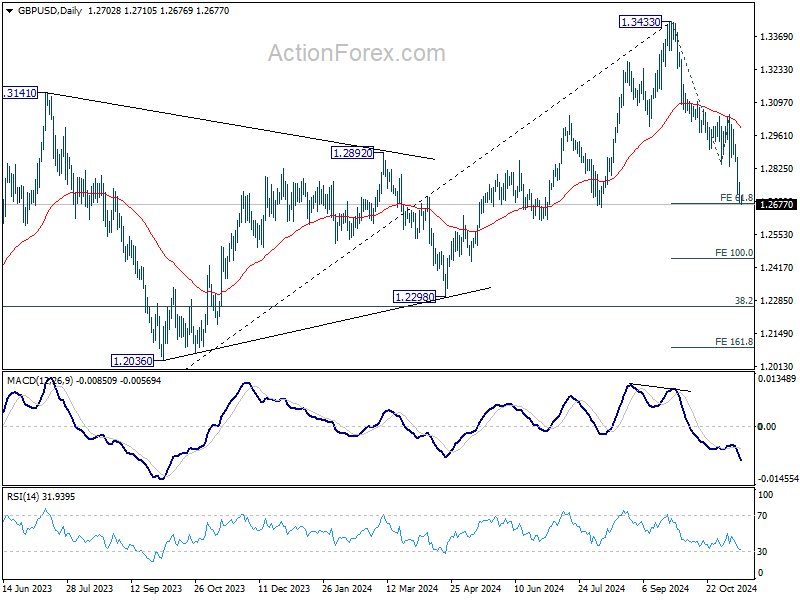
GBP/USD Daily Outlook
Daily Pivots: (S1) 1.2673; (P) 1.2721; (R1) 1.2757; More...
GBP/USD's fall from 1.3433 continues today and intraday bias stays on the downside. Next target is 100% projection of 1.3433 to 1.2842 to 1.3047 at 1.2456. On the upside, above 1.2768 minor resistance will turn intraday bias neutral first. But outlook will stay bearish as long as 13047 resistance holds, in case of recovery.
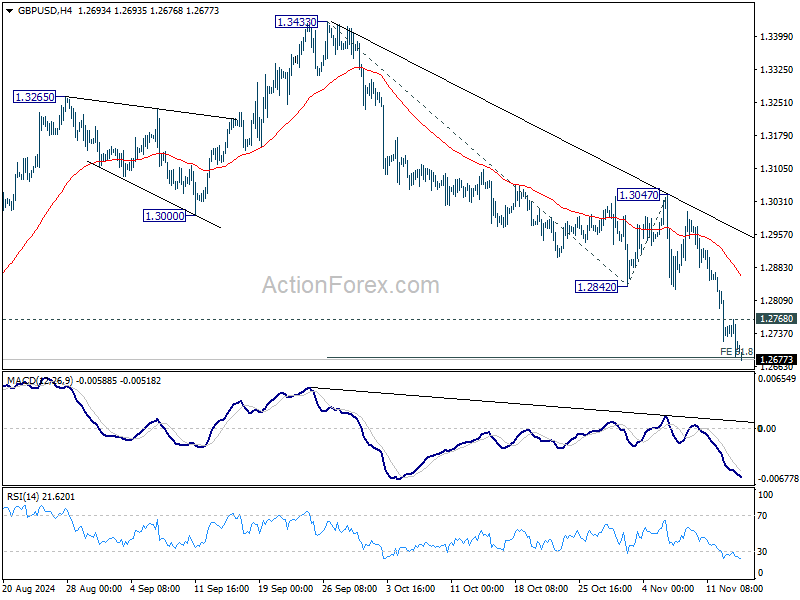
In the bigger picture, considering mildly bearish divergence condition in D MACD, a medium term top is likely in place at 1.3433 already. Price actions from there are seen as correction to whole up trend from 1.0351 (2022 low). Deeper decline would be seen to 38.2% retracement of 1.0351 to 1.3433 at 1.2256, which is close to 1.2298 structural support. Strong support should be seen there to bring rebound.
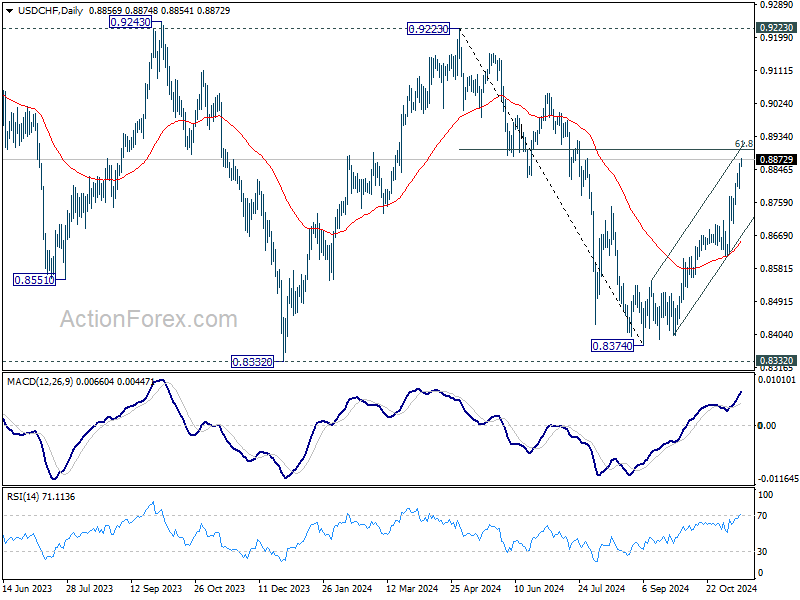
USD/CHF Daily Outlook
Daily Pivots: (S1) 0.8817; (P) 0.8841; (R1) 0.8883; More…
USD/CHF's rally resumed after brief retreat and intraday bias is back on the upside. Current rise from 0.8374 should target 61.8% retracement of 0.9223 to 0.8374 at 0.8899. Sustained trading above there will pave the way towards 0.9223 high. On the downside, below 0.8796 minor support will turn intraday bias neutral again.
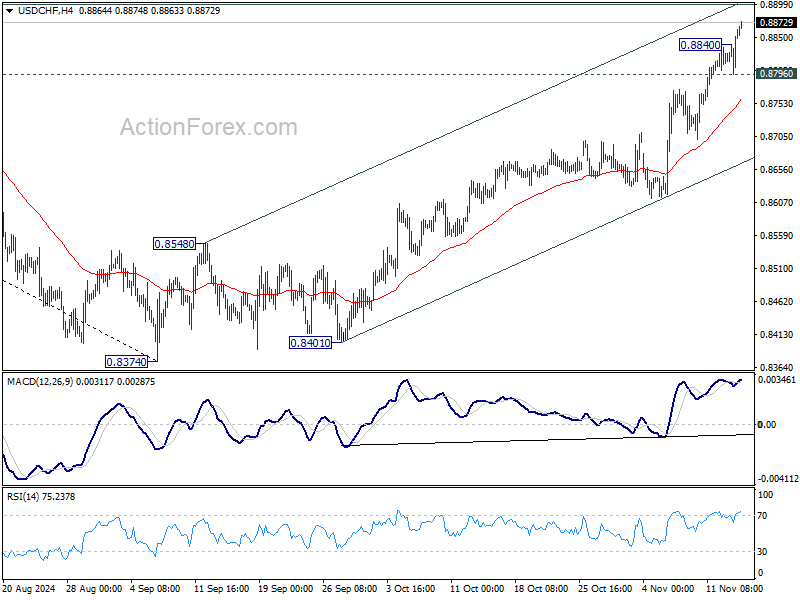
In the bigger picture, price actions from 0.8332 (2023 low) are currently seen as a medium term corrective pattern. Rise from 0.8374 is seen as the third leg. Overall outlook will continue to stay bearish as long as 0.9223 resistance holds. Break of 0.8332 low is in favor at a later stage when the consolidation completes.
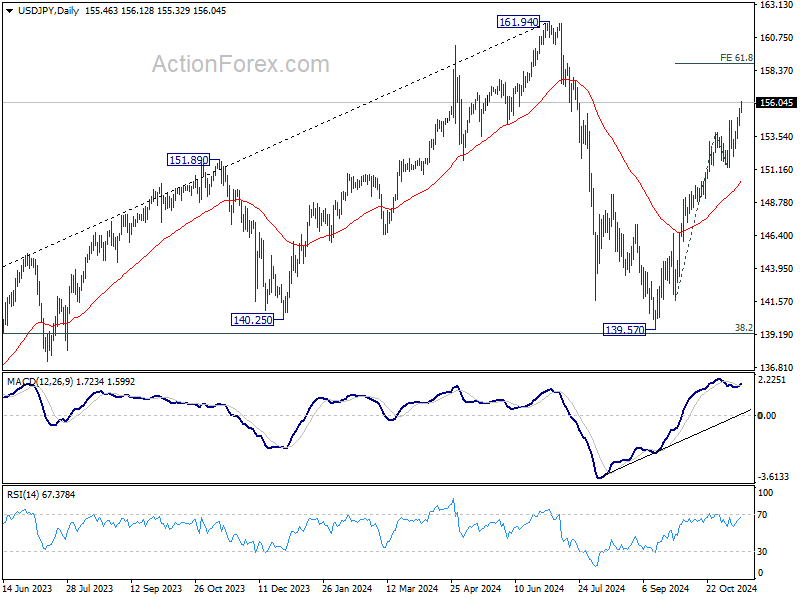
USD/JPY Daily Outlook
Daily Pivots: (S1) 154.67; (P) 155.15; (R1) 155.95; More...
USD/JPY's rally from 139.57 is still in progress and intraday bias stays on the upside. Next target is 61.8% projection of 141.63 to 153.87 from 151.27 at 158.8. On the downside, below 153.40 minor support will turn intraday bias neutral again first. But near term outlook will remain bullish as long as 151.27 support holds, in case of retreat.
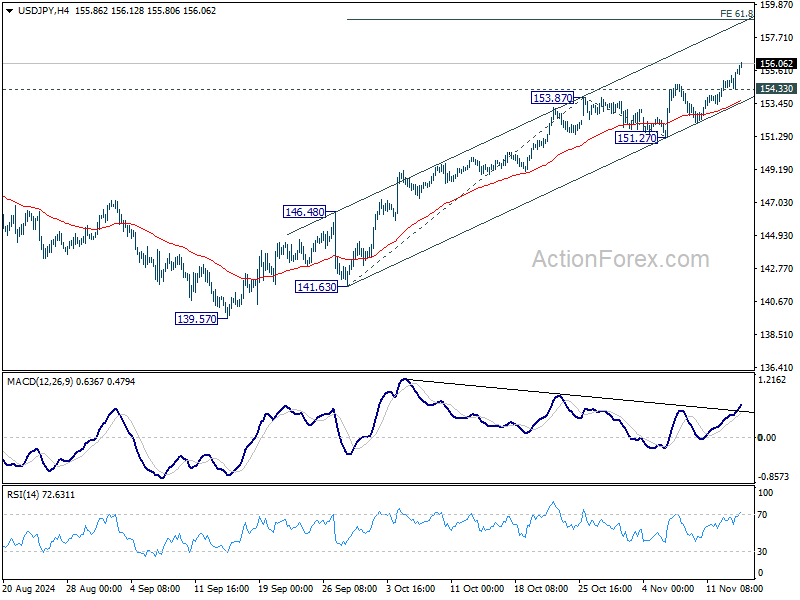
In the bigger picture, price actions from 161.94 are seen as a corrective pattern to rise from 102.58 (2021 low). The range of medium term consolidation should be set between 38.2% retracement of 102.58 to 161.94 at 139.26 and 161.94. Nevertheless, sustained break of 139.26 would open up deeper medium term decline to 61.8% retracement at 125.25.
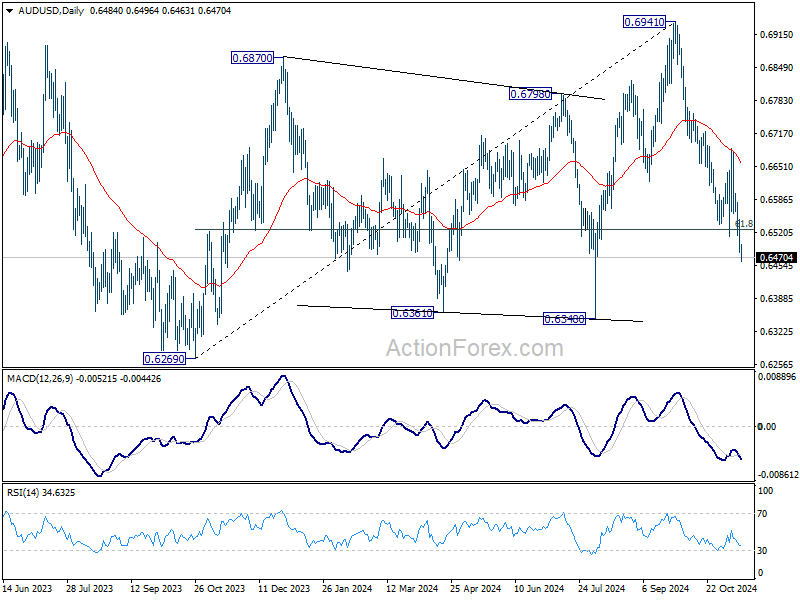
AUD/USD Daily Report
Daily Pivots: (S1) 0.6462; (P) 0.6504; (R1) 0.6528; More...
AUD/USD's fall from 0.6941 resumed by breaking through 0.6511 support and intraday bias is back on the downside. Further decline should now be seen to 0.6269/6348 support zone next. For now, near term outlook will stay bearish as long as 0.6687 resistance holds, in case of recovery.
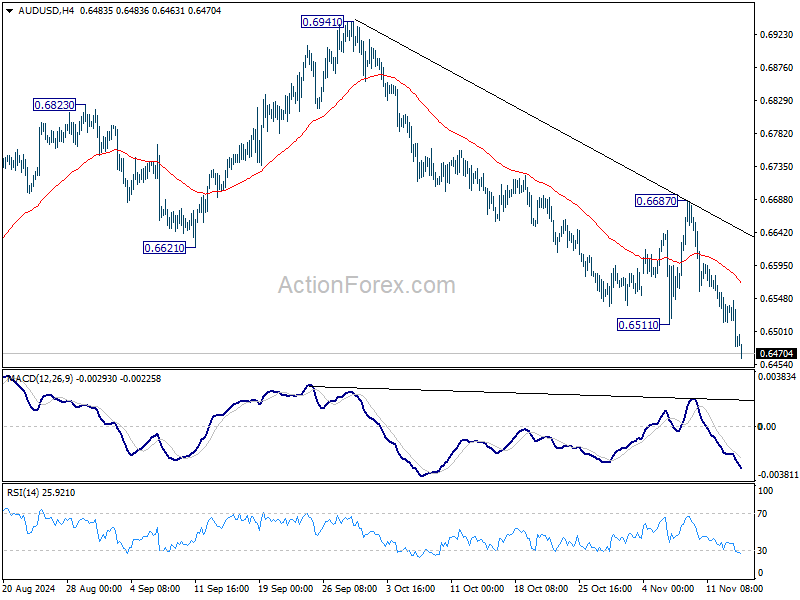
In the bigger picture, rise from 0.6269 (2023 low) should have completed with three waves up to 0.6941. Corrective pattern from 0.6169 (2022 low) is now extending with another falling leg. Deeper decline would be seen back to 0.6269 as sideway trading extends.
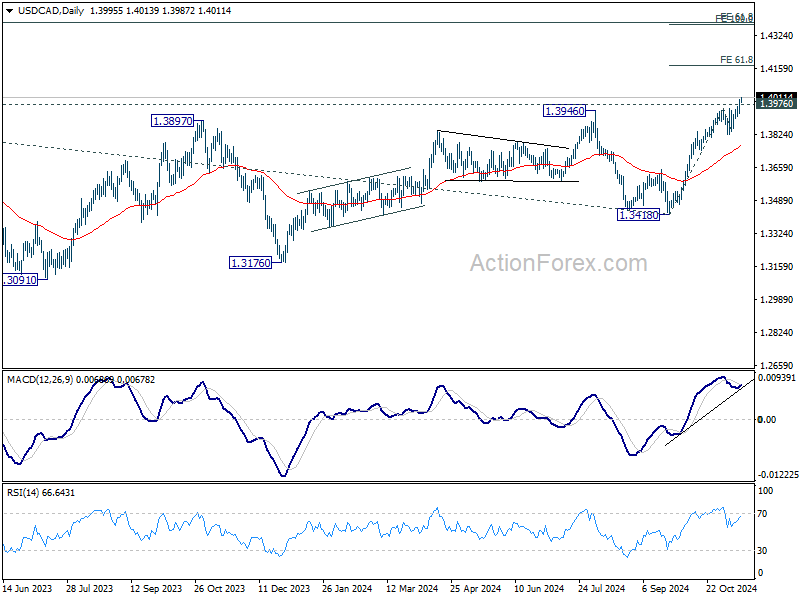
USD/CAD Daily Outlook
Daily Pivots: (S1) 1.3951; (P) 1.3977; (R1) 1.4025; More...
USD/CAD surges through 1.3976 key resistance as larger up trend resumes. Intraday bias is back on the upside. Next near term target is 61.8% projection of 1.3418 to 1.3958 from 1.3841 at 1.4175. For now, outlook will stay bullish as long as 1.3841 support holds, in case of retreat.
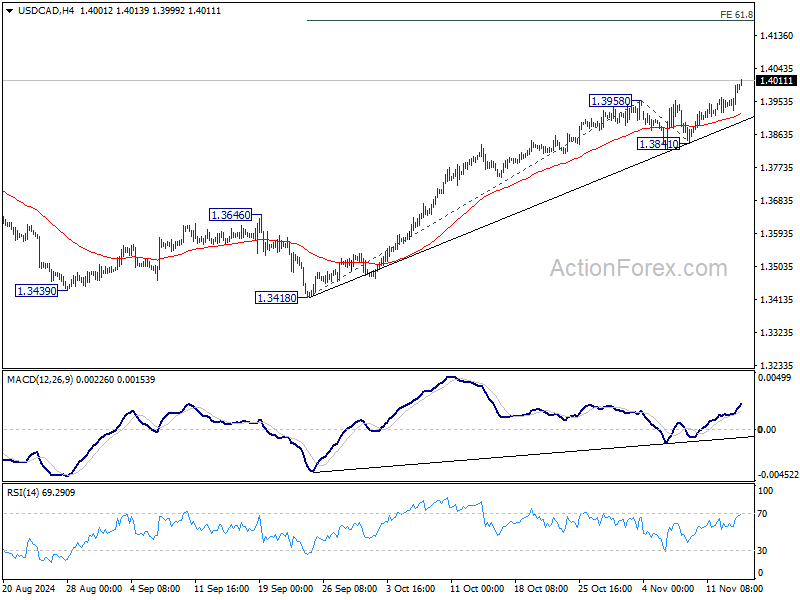
In the bigger picture, up trend from 1.2005 (2021) is resuming with break of 1.3976 key resistance (2022 high). Next target is 61.8% projection of 1.2401 to 1.3976 from 1.3418 at 1.4391. Now, medium term outlook will remain bullish as long as 1.3418 support holds, even in case of deep pullback.
Dollar Gains Momentum on Fed Outlook, Copper Decline Weighs on Aussie
Dollar strengthened broadly overnight, underpinned by the solid rebound in US Treasury yields, while stock markets closed mixed. Stalling disinflation progress, as indicated by the latest CPI data, reinforced the likelihood that Fed will only adopt a gradual approach to lowering interest rates in the future. The aggressive 50bps rate cut back in September is clearly a one-off action that's not going to be repeated.
Additionally, market participants are increasingly concerned about the inflationary impact of the incoming administration's fiscal and trade policies. Furthermore, structural changes in the US economy suggest that the terminal rate of the current easing cycle could be higher than previously anticipated. These factors may keep the Fed's easing hands tied in 2025, limiting the scope for significant policy easing.
In Asian session, selling focus has shifted to Yen, Aussie, and Kiwi, all of which are at the bottom of today's performance charts. Japanese authorities have remained unusually quiet after USD/JPY breached the 156 level, possibly indicating that the critical 155 threshold is now behind us. This silence could suggest that intervention may only be considered as USD/JPY approaches the next psychological level at 160.
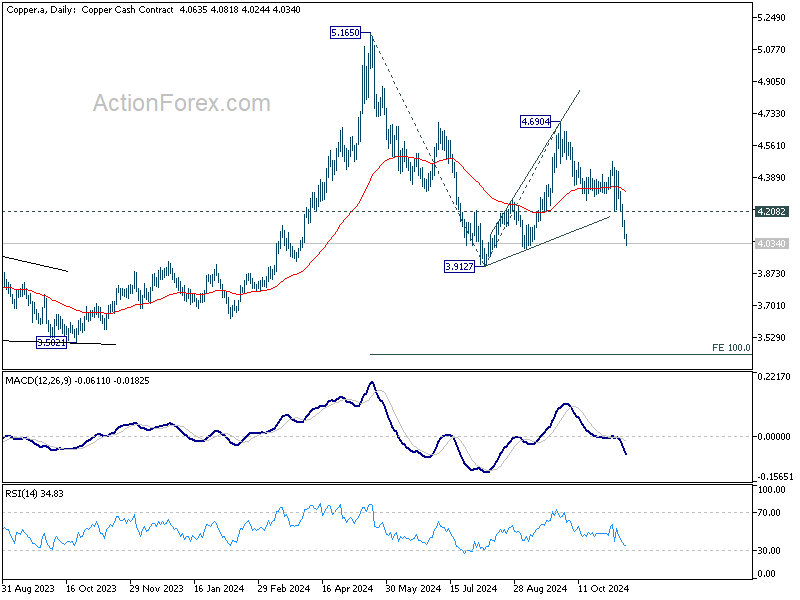
Simultaneously, Aussie and Kiwi are grappling with intensifying concerns over China’s economic outlook, as reflected in continued pressure on Hong Kong equities and Copper prices. US President-elect Donald Trump has nominated Marco Rubio—a prominent China hawk who is sanctioned by China—as Secretary of State. The only way for geopolitical and trade tension between the US and China is on the up, potentially jeopardizing China's anticipated manufacturing recovery. Moreover, recent stimulus efforts by the Chinese government are perceived as focusing primarily on refinancing local government debt, which may not significantly boost physical demand or stimulate broader economic activity.
Meanwhile, Loonie has shown relative strength, standing as the second best performer for the day, though it broke to a four-year low against the greenback. European currencies are mixed, with the Swiss Franc holding a slight advantage, while the euro and pound trade at more subdued levels.
Technically, Copper is now clearly in downside acceleration as seen in D MACD. Fall from 4.6904 is likely the third leg of the whole down trend from 5.165. Outlook will stay bearish as long as 4.2082 support turned resistance holds, for 3.9127 low first. Decisive break there will target 100% projection of 5.165 to 3.9127 from 4.6904 at 3.4381. Extended weakness in Copper could drag down AUD/USD in the medium term.
In Asia, at the time of writing, Nikkei is up 0.08%. Hong Kong HSI is down -0.75%. China Shanghai SSE is down -0.32%. Singapore Strait Times is up 0.03%. Japan 10-year JGB yield is up 0.0159 at 1.057. Overnight, DOW rose 0.11%. S&P 500 rose 0.02%. NASDAQ fell -0.26%. 10-year yield rose 0.0190 to 4.451.
RBA's Bullock: Policy to stay restrictive until demand cools to sustainable levels
RBA Governor Michele Bullock commented at a panel discussion today on Australia's economic and labor market conditions, noting that the economy is still operating at a level that risks fueling inflation.
According to Bullock, while labor market tightness has eased slightly, “it’s still not easy to get staff,” indicating persistent hiring challenges for businesses.
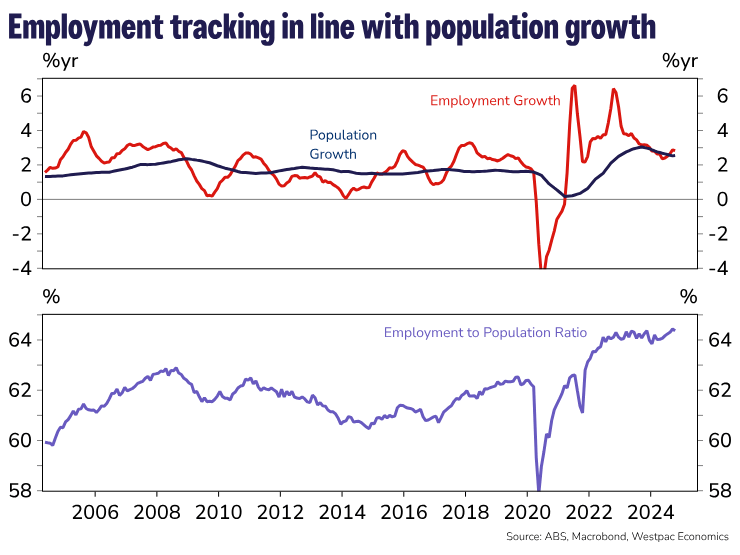
Bullock attributed the resilience in the job market to strong "demand" and "population growth". These factors, she noted, continue to support employment levels despite some easing in labor market constraints.
Comparing RBA’s policy stance with other central banks, Bullock remarked that while others have already moved to lower rates, RBA remains "not as restrictive."
Nevertheless, she emphasized that the bank considers its policy "restrictive enough" to address inflation risks and is committed to maintaining this stance until there’s clear evidence of a sustained "downward trajectory in demand."
Australia's employment growth 15.9k in Oct, slowest rate in recent months
Australia's employment grew modestly in October, rising by 15.9k or 0.1% mom, falling short of the anticipated 25k increase. This represents the slowest pace of employment growth in recent months, following a period of more robust gains averaging 0.3% per month over the last six months. Full-time positions rose by 9.7k, while part-time jobs increased by 6.2k, both contributing to the incremental rise.
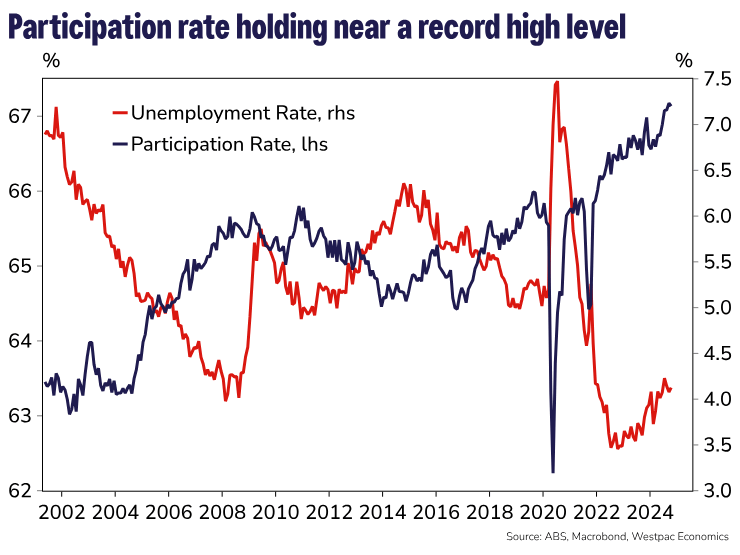
Unemployment rate remained steady at 4.1%, matching expectations, although the participation rate saw a slight dip from 67.2% to 67.1%. The number of unemployed rose by 1.3% mom, adding 8.3k to the job-seeking pool. In terms of labor utilization, monthly hours worked inched up by 0.1% mom, reflecting only minimal expansion in total labor demand.
This marks the third consecutive month with an unemployment rate of 4.1%, which stands 0.6% points higher than June 2023 low of 3.5%. Nonetheless, this rate remains 1.1% below the pre-pandemic level of 5.2% in March 2020.
The deceleration in employment growth could indicate a stabilizing labor market, aligning with recent RBA commentary on maintaining a restrictive policy stance until clear demand cooling is observed.
Fed's Musalem: To cut judiciously and patiently as inflation risks rising
St. Louis Fed President Alberto Musalem stated in a speech overnight that he expects inflation to converge toward the Fed's 2% target over the medium term. His baseline scenario anticipates a cooling labor market that remains within the range of full employment, alongside moderating compensation growth.
Musalem emphasized that this outlook depends on monetary policy staying "appropriately restrictive" while inflation exceeds 2%, a situation that would allow Fed to "judiciously and patiently" continue lowering interest rates.
However, Musalem expressed concerns that recent information indicates the risk of inflation failing to converge toward 2%, or even moving higher, "has risen."
Simultaneously, he noted that the risk of an unwelcome deterioration in the labor market "has remained unchanged or possibly fallen."
Although he is "attuned to the possibility of rising layoffs going forward," Musalem believes the overall strength of the economy "provides some confidence that a disorderly labor market deterioration is unlikely."
Fed’s Schmid: Rate cut depth unclear, productivity holds key
Kansas City Fed President Jeffrey Schmid highlighted overnight Fed’s confidence that inflation is on track to reach its 2% target, attributing this progress to "signs that both labor and product markets have come into better balance in recent months."
Schmid acknowledged that conditions are right to begin easing the Fed’s restrictive monetary policy but stressed that "it remains to be seen how much further interest rates will decline or where they might eventually settle."
He added that sustained gains in productivity could enable the economy to grow robustly without significant inflation. However, Schmid cautioned that economic growth could be dampened if the energy supply fails to meet the increasing demands, such as those driven by AI development.
“As an optimist, my hope is that productivity growth can outrun both demographics and debt," yet as a central banker, he remains committed to the Fed’s dual mandate, ensuring price stability and full employment, guided by data.
Looking ahead
ECB meeting accounts is the main focus in European session. Eurozone will publish GDP revision and industrial production. Later in the day, US will release PPI and jobless claims.
USD/CAD Daily Outlook
Daily Pivots: (S1) 1.3951; (P) 1.3977; (R1) 1.4025; More...
USD/CAD surges through 1.3976 key resistance as larger up trend resumes. Intraday bias is back on the upside. Next near term target is 61.8% projection of 1.3418 to 1.3958 from 1.3841 at 1.4175. For now, outlook will stay bullish as long as 1.3841 support holds, in case of retreat.
In the bigger picture, up trend from 1.2005 (2021) is resuming with break of 1.3976 key resistance (2022 high). Next target is 61.8% projection of 1.2401 to 1.3976 from 1.3418 at 1.4391. Now, medium term outlook will remain bullish as long as 1.3418 support holds, even in case of deep pullback.
Australia October Labour Force: Normalising from Recent Strength
Employment: +15.9k (from +61.3k). Unemployment Rate: 4.1% (from 4.1%). Participation Rate: 67.1% (from 67.2%).
In October, employment rose by +15.9k (0.1%), slightly below Westpac’s forecast of +20k and under the market consensus forecast of +25k. This marks the softest monthly increase in employment since May, when a modest decline was reported, and a departure from the above-trend strength from more recent months – an average of around +50k per month over the September quarter. On a three-month average basis, employment growth has eased slightly from 2.9%yr in September to 2.8%yr in October. That was enough to see the employment-to-population ratio ease marginally from 64.44% to 64.36%, although both figures still round to a record high 64.4%.
We interpret October’s employment print as a normalisation from above-trend momentum that emerged over the last few months. While one month certainly does not mark a trend, there does not seem to be any ‘suspicious’ causes behind the October step-down in employment growth that could point to an unwind next month. Population growth is slowing broadly as expected, and that will continue to see the monthly prints for employment ease accordingly – a result of the Labour Force Survey’s design of estimating sample ratios and ‘scaling’ the implied level changes to population growth.
One factor worth bearing in mind near-term is that employment growth was much stronger than expected during the October-November periods of 2022 to 2023. This reflected an anticipation of stronger demand in the lead-up to Black Friday Sales and the Christmas spending season, as households concentrated spending during discount periods to alleviate cost-of-living pressures. However, this time around it may be the case that with cost-of-living pressures easing, population growth slowing and a greater capacity for employers offer more hours rather than expand headcount, the Black Friday/Christmas impetus is not as materially positive as it was in previous years.
Most analysts – including Westpac – anticipated the participation rate to hold flat at its record high of 67.2% in October. In the event, the participation rate fell by just 0.04ppt, but it was enough for it to round down from 67.2% to 67.1% (from 67.18% to 67.14%). This is still a result certainly worth celebrating – a near record proportion of the population actively engaging in the labour market. The future path for labour force participation depends critically on the balance of cyclical forces and the clear structural uptrend supported by demographic factors. One month’s result is not entirely informative, and whether a gradual downtrend in labour force participation ensues – as we anticipate – remains to be seen.
The tick-down in participation saw the labour force expand by +24.2k, more than the increase in employment recorded in the month, therefore implying a slight increase in the level of unemployment (+8.3k). Overall, this was not enough to see the unemployment rate budge from its current level of 4.1%, as it has done for the past three consecutive months.
The RBA are also closely monitoring developments across other measures of labour force slack and the dynamics around average hours worked – if there were to be clearer signs of easing labour market conditions, it would likely be initially more apparent in these more sensitive measures of underutilisation.
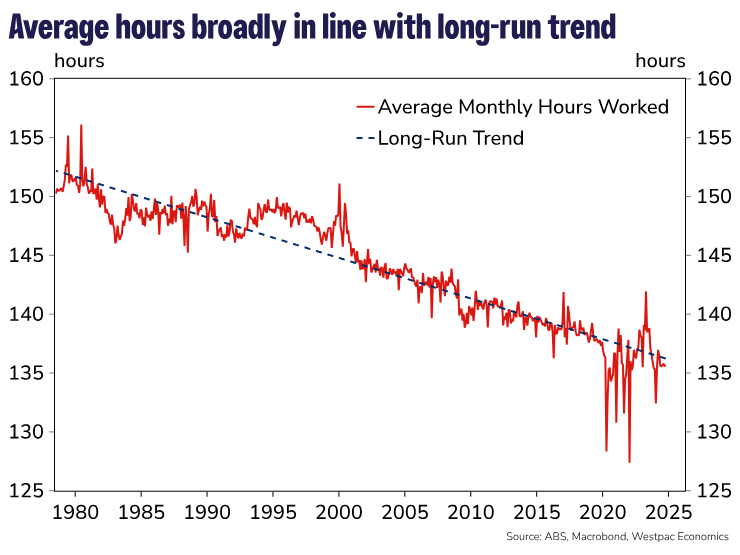
Growth in monthly hours worked rose 0.1%mth in October and 2.2%yr on a three-month average basis, matching the increase in employment and therefore implying no change to average hours worked. Employers have used average hours as a lever to adjust their labour demand quickly in response to rapidly evolving economic conditions over the past two years. With the large swings in average hours mostly behind us, there is no clear evidence of a renewed weakening in labour demand via average hours. As seen in the chart below, average hours are still tracking broadly in line with the historical downtrend that has been in place since the 1970s.
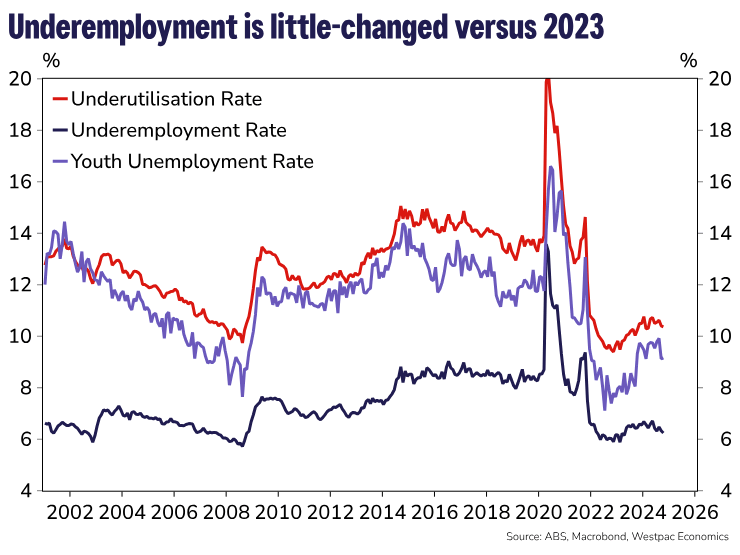
Other measures of underutilisation are also not ringing any alarm bells at this stage. The underemployment rate – which measures those that are willing and able to work more hours than they currently do – fell once again from 6.3% in September to 6.2% in October, the lowest result since April 2023. The underutilisation rate, which combines both unemployment and underemployment, held flat at 10.4%, the lowest since March 2024. Youth unemployment also remains well below the levels observed prior to the pandemic, currently at 9.2%.
Today’s data is a reminder that the Australian labour market remains in relatively solid health and is gradually becoming more balanced. With employment growth slowing broadly in line with population growth and average hours holding steady, there are few signs that labour demand is capitulating to an extent that warrants concern. While virtually all measures of underutilisation are signalling that labour market conditions remain somewhat tight, yesterday’s wages data suggests this is not translating to stronger wage inflation pressures. On balance, today’s update will see the RBA continue to remain focused on the dynamics around underlying inflation.