Sample Category Title
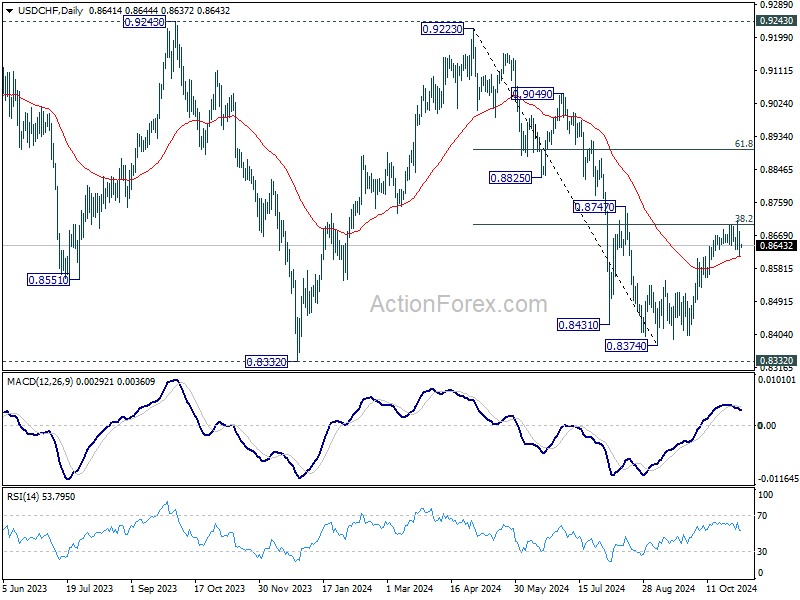
USD/CHF Daily Outlook
Daily Pivots: (S1) 0.8610; (P) 0.8646; (R1) 0.8676; More…
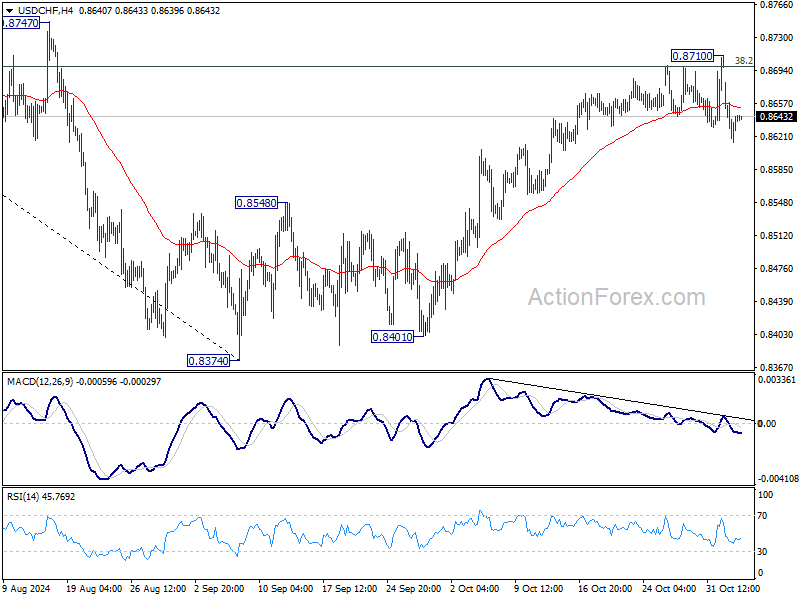
Intraday bias in USD/CHF remains mildly on the downside for the moment. Fall from 0.8710 short term top would target 55 D EMA (now at 0.8614). Sustained break there will argue that the rebound form 0.8374 has completed, and bring deeper fall back to this low. On the upside, firm break of 0.8710 will resume the rebound from 0.8374 instead.
In the bigger picture, price actions from 0.8332 (2023 low) are currently seen as a medium term corrective pattern, with fall from 0.9223 as the second leg. Strong support could be seen from 0.8332 to bring rebound. Yet, overall outlook will continue to stay bearish as long as 0.9243 resistance holds. Firm break of 0.8332, however, will resume larger down trend from 1.0146 (2022 high).
USD/CAD Daily Outlook
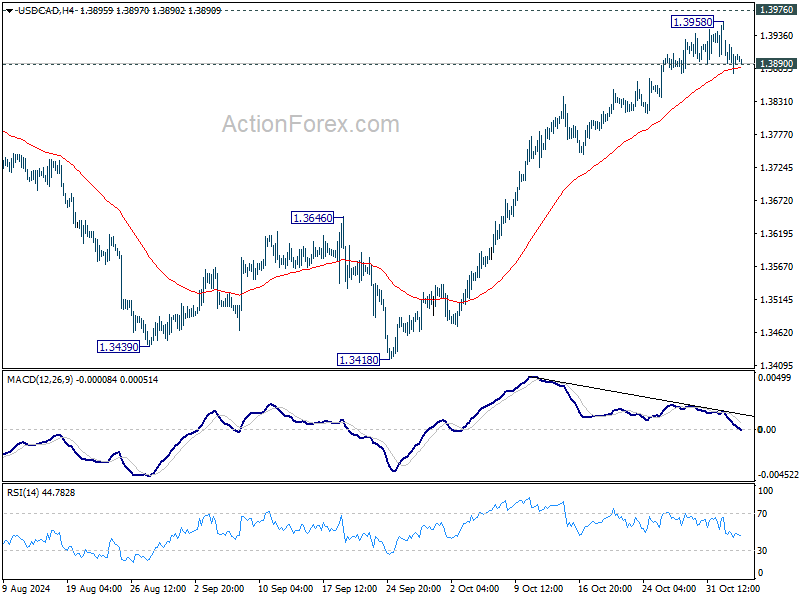
Daily Pivots: (S1) 1.3876; (P) 1.3902; (R1) 1.3929; More...
Intraday bias in USD/CAD stays neutral for the moment. Considering bearish divergence condition in 4H MACD, firm break of 1.3890 minor support will indicate short term topping, and turn bias back to the downside for 55 D EMA (now at 1.3725). On the upside, decisive break of 1.3976 will resume larger up trend.
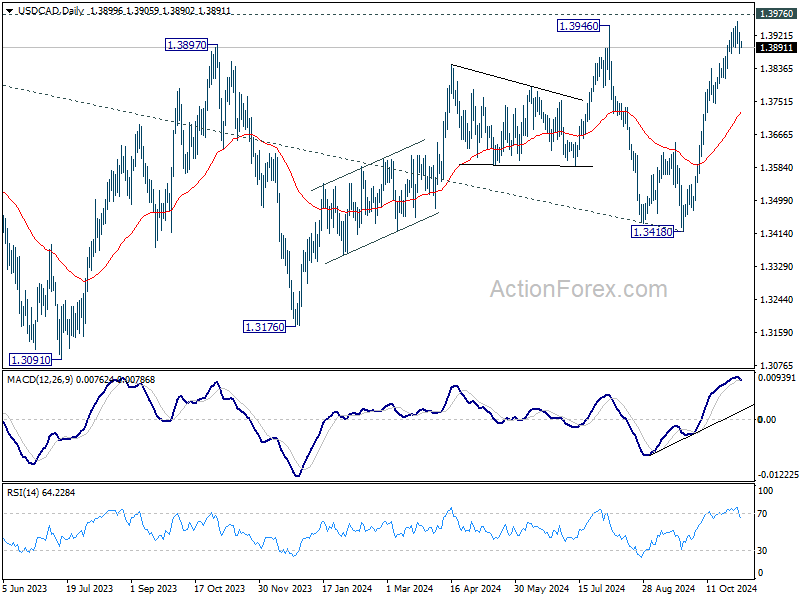
In the bigger picture, sideway consolidation pattern from 1.3976 (2022 high) might still extend further. While another decline cannot be ruled out, strong support should emerge above 1.2947 resistance turned support to bring rebound. Rise from 1.2005 (2021 low) is still in favor to resume at a later stage. Decisive break of 1.3976 will target 61.8% projection of 1.2401 to 1.3976 from 1.3418 at 1.4391.
US Election Day
In focus this week
Today, the US election takes place and is the major highlight of the week. Over the weekend, Harris' odds in prediction markets have risen sharply, but swing state polls continue to signal a very close race. Michigan, Wisconsin and Pennsylvania are the most likely tipping points of the election.
Tomorrow morning, when we - hopefully - know the results of the US election, we will be hosting two conference calls where we present our instant views on the results and implications for markets and the economy: Conference call on the implications of the US election for Global and Scandi markets at 8:40 - 9:10 CET and US elections morning call - Macro need-to-knows at 9:15 - 9:30 CET.
Economic and market news
What happened overnight
In Australia, the Reserve Bank of Australia opted to maintain steady interest rates at 4.35% (cons: 4.35%, prior: 4.35%), aligning with both analyst consensus and market expectations. This decision comes as underlying inflation continues to be too high.
What happened yesterday
In the US, investors reined in bets on a win for Donald Trump causing EUR/USD to rise by 0.4%. This comes as a poll by J Ann Selzer released this weekend showed support for Kamala Harris in Iowa.
In the euro area, the Sentix investor confidence indicator came in below market expectations at -12.8 (cons: -12.5), providing a negative first assessment of sentiment in November. On the upside, manufacturing PMI data for October surprised slightly to the upside at 46.0 (cons: 45.9, prior: 45.9). Overall manufacturing continues to stagnate, despite diminishing headwinds from falling interest rates.
In Oil markets, prices continued to gain following OPEC+ announcing Sunday a delay in December output increases until January next year. Brent futures increased by 2.90% to USD 75.22 per barrel and WTI crude climbed 3.02% to USD 71.48.
Equities: Global equities were flat yesterday. Only minor movements across sectors and styles, which is understandable given the US presidential election today. Bond markets will play a crucial role for equities after the election, but we can end up in a situation where the removal of uncertainty will have the biggest impact. The VIX index closed at 22 yesterday. Without the election, we argue it should have been closer to 15, considering the current phase of the business cycle and the recent macroeconomic and earnings data. In the US yesterday, Dow -0.6%, S&P 500 -0.3%, Nasdaq -0.3%, and Russell 2000 +0.4%. Chinese markets are boosting Asia this morning, following a strong Caixin service PMI and further announcements from the central government about potential fiscal support. US futures are marginally higher this morning, while European futures are marginally lower.
FI: The rising probability of a Harris presidential win sent US yields 10bp lower in the longer end of the curve on reduced probability of a republican sweep, and thus less fiscal easing. Like much of the move on late Friday, this move was largely a UST move and markets did not record a beta to EUR rates. In fact, euro rates traded mostly sideways with no appetite among investors to add risk to existing positions.
FX: The FX market is in consolidation mode ahead of today's US election. After a slight pull-back to the Trump trades at the onset of the week, broad USD is modestly stronger overnight. EUR/USD is at the high end of the 1.08-1.09 range, USD/JPY back above 152 and cable just shy of 1.30. RBA left its policy rate unchanged at 4.35% this morning, which was as expected. The AUD barely budged. At 11.66, EUR/SEK has one eye on the US election and one on the Riksbank rate decision, with two-sided risks depending on the outcomes. As for EUR/NOK, just below 12.00, the topside is vulnerable to a Trump win.
AUD/USD Daily Report
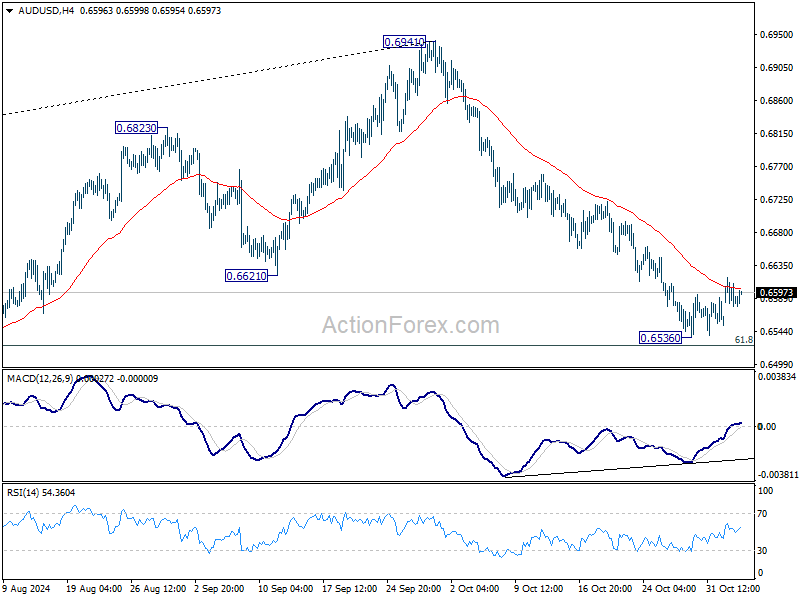
Daily Pivots: (S1) 0.6571; (P) 0.6595; (R1) 0.6611; More...
AUD/USD is staying in consolidation above 0.6536 and intraday bias remains neutral. Stronger recovery might be seen, but outlook stays bearish as long as 55 D EMA (now at 0.6688) holds. On the downside, sustained break of 0.61.8% retracement of 0.6269 to 0.6941 at 0.6526 will target 0.6348 support next.
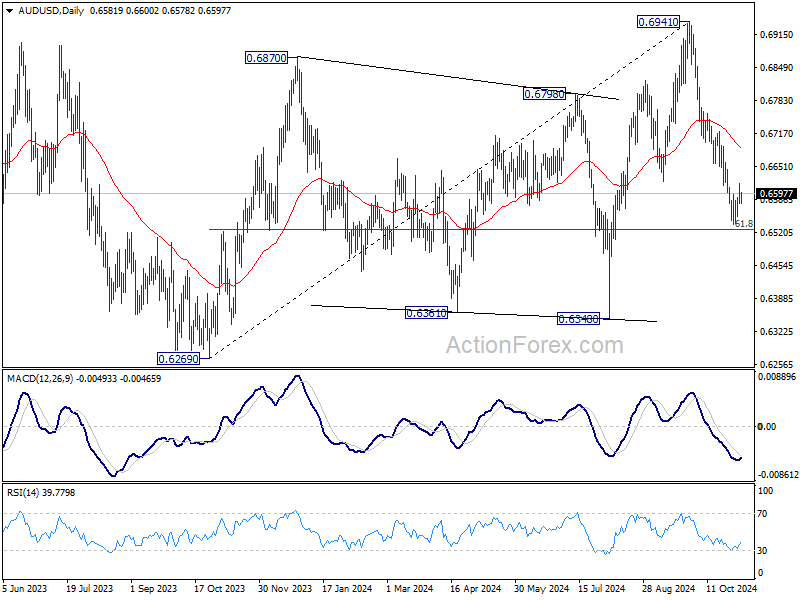
In the bigger picture, rise from 0.6269 (2023 low) should have completed with three waves up to 0.6941. Corrective pattern from 0.6169 (2022 low) is now extending with another falling leg. Deeper decline would be seen back to 0.6269 as sideway trading extends.
No Dovish Shift from RBA, Aussie Holds Ground with Rate Cut Delays Possible
Australian Dollar remained stable after RBA decided to keep the cash rate unchanged at 4.35% as widely expected. In the post-meeting press conference, Governor Michelle Bullock acknowledged that there has been "good progress" in reducing inflation. However, the central bank did not adopt a more dovish stance, which came as a surprise to some market participants anticipating signals of policy easing in the near term. RBA maintained its position of "not ruling anything in or out," indicating flexibility but no immediate plans for rate cuts.
The slight downgrade in inflation forecasts was not sufficient to warrant a rate cut son. Consequently, some analysts are now suggesting that, without significant changes in RBA's statement, the timing of the first rate cut may be pushed beyond February. Unless there is a substantial decline in underlying inflation in the fourth-quarter CPI report, RBA might wait for first-quarter data before taking action. This scenario would make May a more realistic timeframe for initiating a policy easing cycle.
Elsewhere in the currency markets, overall activity remains low as traders await the results of the US presidential election. Dollar continues to sit at the bottom of the performance chart for the week so far, followed by Sterling and Yen. Swiss Franc is leading as the strongest currency, followed by Aussie and then Loonie. Kiwi and Euro are positioned in the middle. Despite these movements, all major currency pairs and crosses are sitting within last week's ranges, reflecting market indecision.
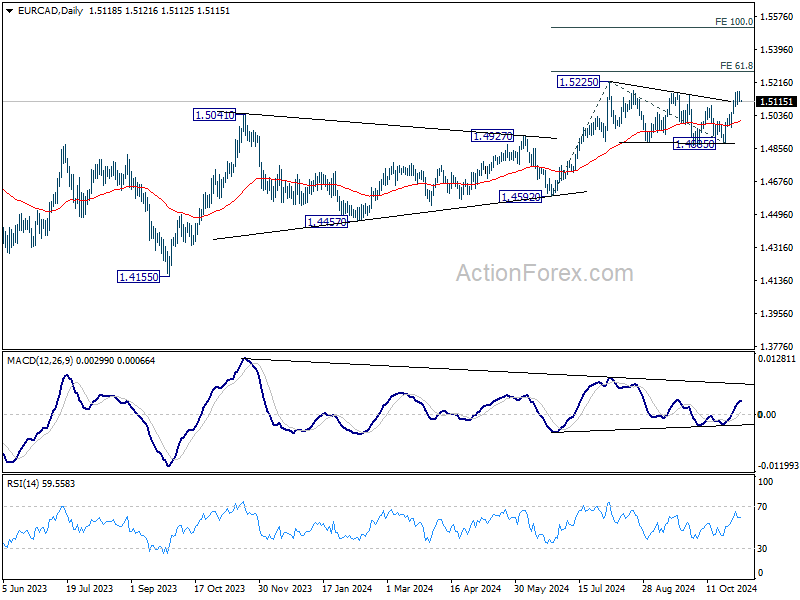
From a technical standpoint, while focus is primarily on Dollar pairs, EUR/CAD is also worth some attention after last week's strong bounce. Consolidation pattern from 1.5225 might have completed at 1.4885 already. Firm break of 1.5225 will confirm larger up trend resumption for 61.8% projection of 1.4592 to 1.5225 from 1.4885 at 1.5276, and then 100% projection at 1.5518.
In Asia, Nikkei rose 1.45%. Hong Kong HSI is up 1.28%. China Shanghai SSE is up 1.72%. Singapore Strait Times is up 0.11%. Japan 10-year yield is down -0.0097 at 0.936. Overnight, DOW fell -0.61%. S&P 500 fell -0.28%. NASDAQ fell -0.33%. 10-year yield fell -0.052 to 4.309.
RBA stands pat, still not ruling anything in or out
RBA maintained its cash rate at 4.35% today, as expected, while underscoring that inflation risks remain a concern. In its statement, RBA noted that although headline inflation has declined and is projected to stay lower in the short term, it considers underlying inflation as "more indicative" of inflation trends, and this measure remains "too high."
In line with this cautious approach, the emphasized the need to remain “vigilant to upside risks to inflation,” signaling flexibility by reiterating that it is "not ruling anything in or out." The ’s latest economic projections offer a more tempered outlook, with slight downward adjustments to growth and inflation forecasts, pointing to persistent caution amid moderated expectations.
Key revisions in the RBA’s projections include:
- Year-average GDP growth: 2024 unchanged at 1.2%, but lowered for 2025 from 2.5% to 2.2% and for 2026 from 2.4% to 2.3%.
- Year-ended CPI: Forecast for December 2024 is revised down from 3.0% to 2.6%, with December 2025 held steady at 3.7%, and December 2026 slightly reduced from 2.6% to 2.5%.
- Trimmed mean inflation: Forecast for December 2024 lowered from 3.5% to 3.4%, with additional downgrade for December 2025 from 2.9% to 2.8%, and December 2026 from 2.6% to 2.5%.
These adjustments reflect an outlook of moderated economic growth and slightly eased inflation pressures. However, RBA’s flexible stance indicates it is prepared to act if inflation risks become more pronounced, balancing economic stability with its inflation objectives.
China's Caixin PMI composite rises to 51.9, policy impact begins to show
China's Caixin Services PMI rose to 52.0 in October, surpassing expectations of 50.5 and marking the highest rate of growth in three months. The services sector continues its expansionary streak that began in January 2023. PMI Composite also increased from 50.3 to 51.9, its highest level in four months, maintaining expansion for the 12th consecutive month, driven largely by service-sector resilience.
Wang Zhe, Senior Economist at Caixin Insight Group noted that challenges noted that a range of supportive policies has since been introduced by the Politburo since September. The recent Caixin PMI readings for both manufacturing and services suggest that “market demand stabilized and optimism improved,” signaling early effects of the new policies.
Looking ahead
Swiss unemployment rate, France industrial poroduction and UK PI services final will be released in the European session. Later in the day, Canada will release trade balance. US will release trade balance and ISM services.
AUD/USD Daily Report
Daily Pivots: (S1) 0.6571; (P) 0.6595; (R1) 0.6611; More...
AUD/USD is staying in consolidation above 0.6536 and intraday bias remains neutral. Stronger recovery might be seen, but outlook stays bearish as long as 55 D EMA (now at 0.6688) holds. On the downside, sustained break of 0.61.8% retracement of 0.6269 to 0.6941 at 0.6526 will target 0.6348 support next.
In the bigger picture, rise from 0.6269 (2023 low) should have completed with three waves up to 0.6941. Corrective pattern from 0.6169 (2022 low) is now extending with another falling leg. Deeper decline would be seen back to 0.6269 as sideway trading extends.
Elliott Wave View Looking for Dollar Index (DXY) to Rollover to the Downside
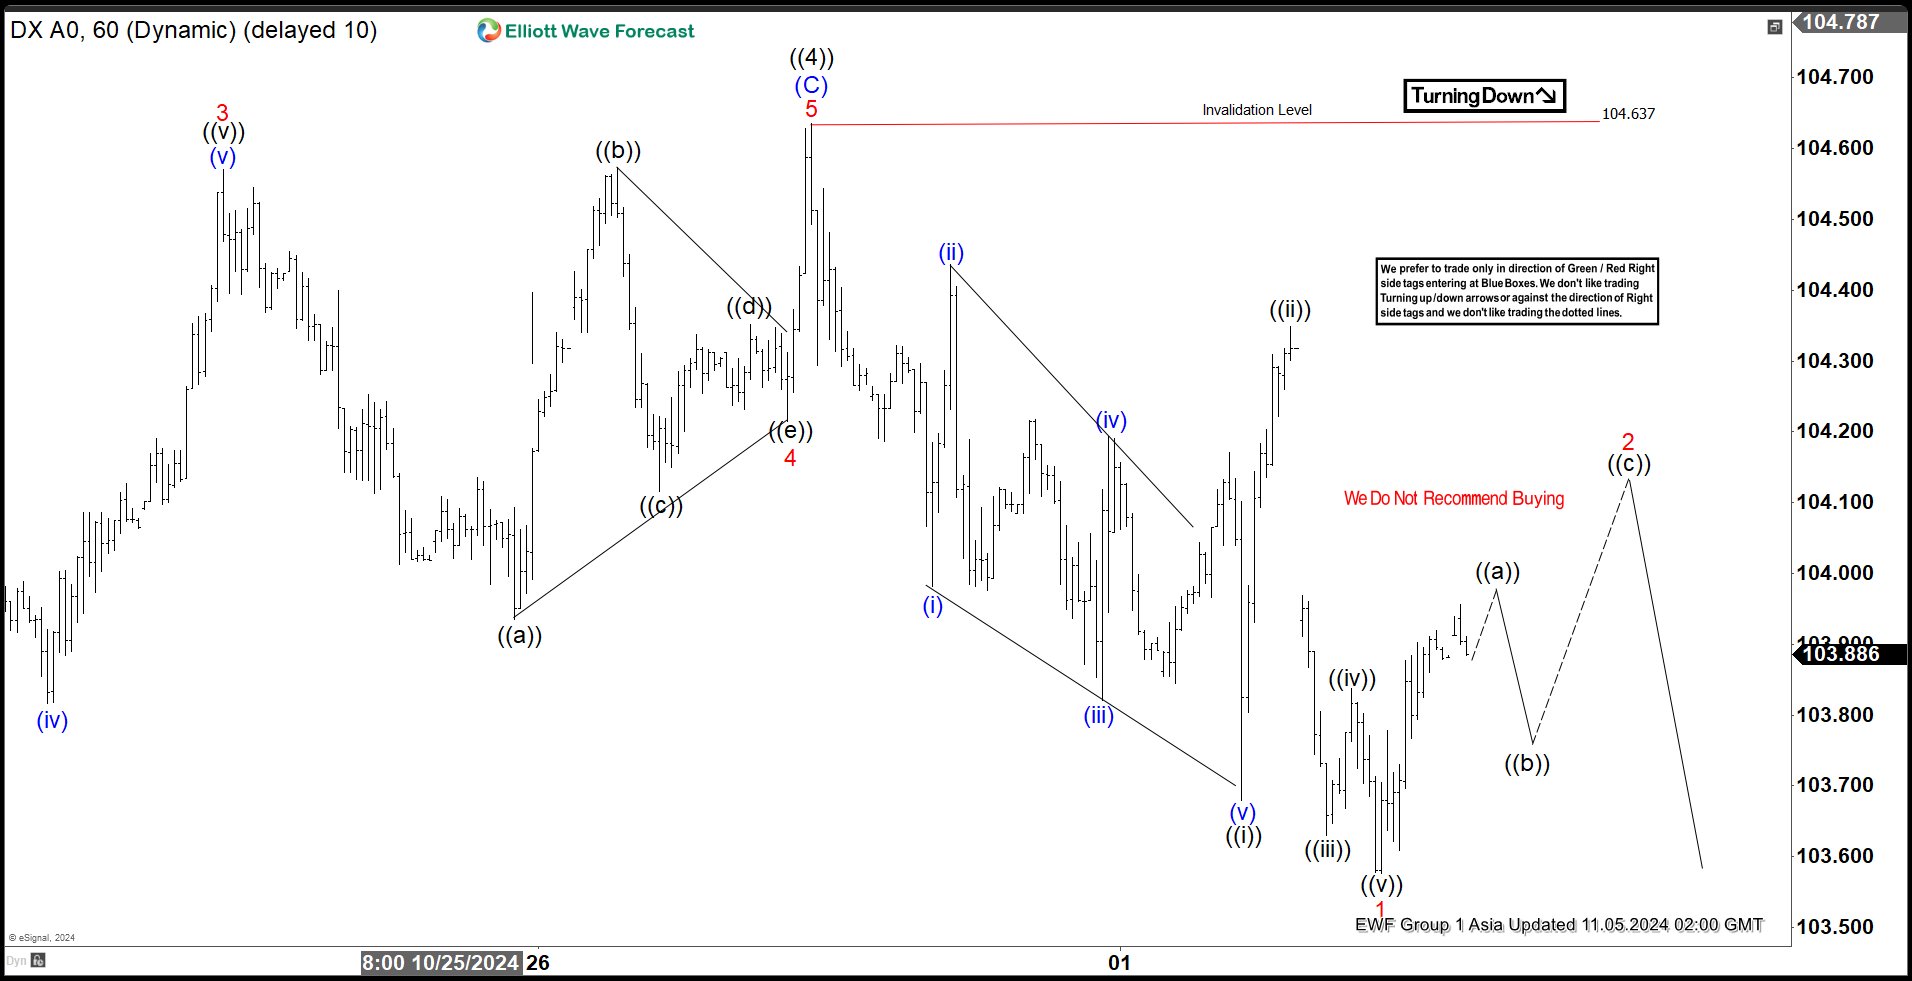
Short Term Elliott Wave View on Dollar Index (DXY) suggests that rally to 104.63 ended wave ((4)). This completed cycle from 9.27.2024 low and the Index should either resume lower in wave ((5)) or pullback in 3 waves at least. The Index has started to turn lower and we are calling the move lower from wave ((4)) high as a diagonal 5 waves. Down from wave ((4)), wave (i) ended at 103.98 and wave (ii) ended at 104.43. Wave (iii) lower ended at 103.82, wave (iv) ended at 104.19, and wave (v) lower ended at 103.68. This completed wave ((i)) in higher degree. Rally in wave ((ii)) ended at 104.35.
Index resumed lower in wave ((iii)) towards 103.63 and wave ((iv)) ended at 103.83. Final leg wave ((v)) ended at 103.57 which completed wave 1 in higher degree. Wave 2 rally is in progress with internal subdivision as a zigzag Elliott Wave structure. Up from wave 1, wave ((a)) is expected to end soon, then it should pullback in wave ((b)), before the Index rallies higher again in wave ((c)). This will complete wave 2 in higher degree before the Index resumes lower. As far as pivot at 104.63 high stays intact, expect rally to fail in 3, 7, or 11 swing for further downside.
Dollar Index (DXY) 60 Minutes Elliott Wave Chart
DXY Elliott Wave Video
https://www.youtube.com/watch?v=W8QDucEPLKs
RBA stands pat, still not ruling anything in or out
RBA maintained its cash rate at 4.35% today, as expected, while underscoring that inflation risks remain a concern. In its statement, RBA noted that although headline inflation has declined and is projected to stay lower in the short term, it considers underlying inflation as "more indicative" of inflation trends, and this measure remains "too high."
In line with this cautious approach, the emphasized the need to remain “vigilant to upside risks to inflation,” signaling flexibility by reiterating that it is "not ruling anything in or out." The ’s latest economic projections offer a more tempered outlook, with slight downward adjustments to growth and inflation forecasts, pointing to persistent caution amid moderated expectations.
Key revisions in the RBA’s projections include:
- Year-average GDP growth: 2024 unchanged at 1.2%, but lowered for 2025 from 2.5% to 2.2% and for 2026 from 2.4% to 2.3%.
- Year-ended CPI: Forecast for December 2024 is revised down from 3.0% to 2.6%, with December 2025 held steady at 3.7%, and December 2026 slightly reduced from 2.6% to 2.5%.
- Trimmed mean inflation: Forecast for December 2024 lowered from 3.5% to 3.4%, with additional downgrade for December 2025 from 2.9% to 2.8%, and December 2026 from 2.6% to 2.5%.
These adjustments reflect an outlook of moderated economic growth and slightly eased inflation pressures. However, RBA’s flexible stance indicates it is prepared to act if inflation risks become more pronounced, balancing economic stability with its inflation objectives.
(RBA) Statement by the Reserve Bank Board: Monetary Policy Decisions
At its meeting today, the Board decided to leave the cash rate target unchanged at 4.35 per cent and the interest rate paid on Exchange Settlement balances unchanged at 4.25 per cent.
Underlying inflation remains too high.
Inflation has fallen substantially since the peak in 2022, as higher interest rates have been working to bring aggregate demand and supply closer towards balance. Headline inflation was 2.8 per cent over the year to the September quarter, down from 3.8 per cent over the year to the June quarter. This was as expected due to declines in fuel and electricity prices in the September quarter. But part of this decline reflects temporary cost of living relief. Abstracting from these effects, underlying inflation (as represented by the trimmed mean) was 3.5 per cent over the year to the September quarter. This was as forecast but is still some way from the 2.5 per cent midpoint of the inflation target. The forecasts published in today’s Statement on Monetary Policy (SMP) do not see inflation returning sustainably to the midpoint of the target until 2026.
The outlook remains highly uncertain.
The forecasts published today are very similar to those published in August. The forecast path for underlying inflation reflects a judgement that aggregate demand remains above the economy’s supply capacity, evidenced by the persistence of underlying inflation, surveys of business conditions and ongoing strength in the labour market.
Growth in output has been weak. Past declines in real disposable incomes and the ongoing effect of restrictive financial conditions continue to weigh on household consumption, particularly discretionary consumption. However, growth in aggregate consumer demand, which includes spending by temporary residents such as students and tourists, has remained more resilient.
A range of indicators suggest that labour market conditions remain tight, and while conditions have been easing gradually, some indicators have recently stabilised. Employment grew strongly over the three months to September, by an average of 0.4 per cent per month. The unemployment rate was 4.1 per cent in September, up from the trough of 3.5 per cent in late 2022. But the participation rate remains at record highs, vacancies are still elevated and average hours worked have stabilised. At the same time, some cyclical measures of the labour market including youth unemployment and underemployment have recently declined.
Wage pressures have eased somewhat but labour productivity is still only at 2016 levels, despite the pick-up over the past year.
Taking account of recent data and the updated forecasts, the Board’s assessment is that policy is currently restrictive and working broadly as anticipated. But there are uncertainties. The central projection is for growth in household consumption to increase from the second half of this year as income growth picks up – and there is tentative evidence of an increase in spending in the September quarter. But there is a risk that any pick-up is slower than expected, resulting in continued subdued output growth and a sharper deterioration in the labour market. More broadly, there are uncertainties regarding the lags in the effect of monetary policy and how firms’ pricing decisions and wages will respond to the slow growth in the economy and weak productivity outcomes at a time of excess demand, and while conditions in the labour market remain tight.
There remains a high level of uncertainty about the outlook abroad. Most central banks have eased monetary policy as they become more confident that inflation is moving sustainably back towards their respective targets. They note, however, that they are removing only some restrictiveness and remain alert to risks on both sides, namely weaker labour markets and stronger inflation. Public authorities in China have responded to the weak outlook for economic activity by implementing more expansionary policies, although the impact (and in some cases the specific details) of these measures remains to be seen. Geopolitical uncertainties remain pronounced.
Sustainably returning inflation to target is the priority.
Sustainably returning inflation to target within a reasonable timeframe remains the Board’s highest priority. This is consistent with the RBA’s mandate for price stability and full employment. To date, longer term inflation expectations have been consistent with the inflation target and it is important that this remains the case.
While headline inflation has declined substantially and will remain lower for a time, underlying inflation is more indicative of inflation momentum, and it remains too high. The November SMP forecasts suggest that it will be some time yet before inflation is sustainably in the target range and approaching the midpoint. This reinforces the need to remain vigilant to upside risks to inflation and the Board is not ruling anything in or out. Policy will need to be sufficiently restrictive until the Board is confident that inflation is moving sustainably towards the target range.
The Board will continue to rely upon the data and the evolving assessment of risks to guide its decisions. In doing so, it will pay close attention to developments in the global economy and financial markets, trends in domestic demand, and the outlook for inflation and the labour market. The Board remains resolute in its determination to return inflation to target and will do what is necessary to achieve that outcome.
WTI Crude Oil Starts Recovery Effort: Can It Sustain The Climb?
Key Highlights
- WTI Crude Oil price started a recovery wave from the $67.00 zone.
- It broke a key bearish trend line with resistance at $70.60 on the 4-hour chart.
- EUR/USD could struggle to recover above the 1.0920 resistance.
- GBP/USD faces hurdles near the 1.3020 resistance.
WTI Crude Oil Price Technical Analysis
WTI Crude Oil price extended losses below $70.00 before the bulls appeared. It tested $67.00 and recently started a recovery wave.
Looking at the 4-hour chart of XTI/USD, the price recovered above the $69.20 and $70.00 resistance levels. There was a move above the 61.8% Fib retracement level of the downward move from the $72.9 swing high to the $67.08 low.
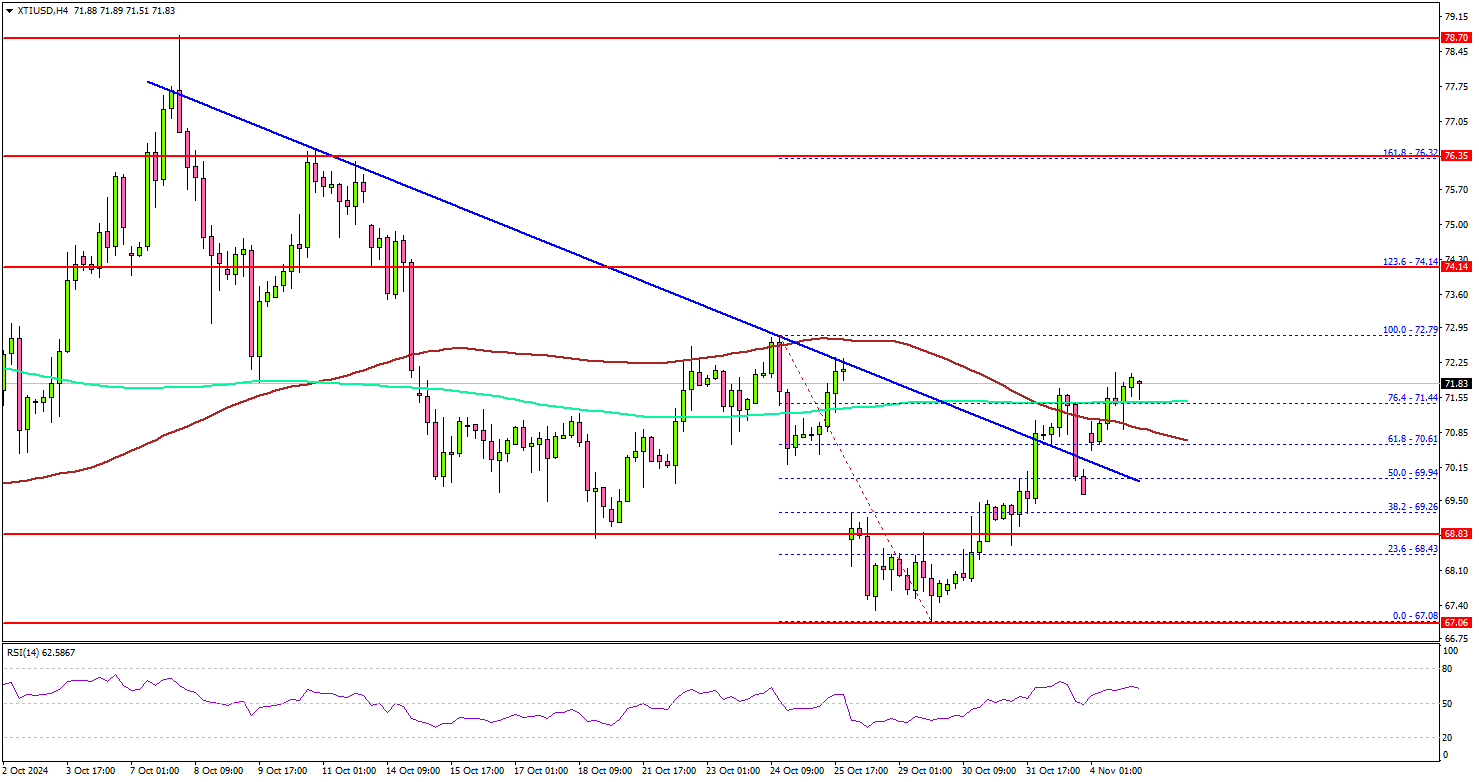
Besides, it broke a key bearish trend line with resistance at $70.60 on the same chart. The price even attempted a close above the 100 simple moving average (red, 4-hour) and the 200 simple moving average (green, 4-hour).
On the upside, it faces resistance near the $72.80 level. The next major resistance is near the $74.15 zone. It is close to the 1.236 Fib extension level of the downward move from the $72.9 swing high to the $67.08 low, above which the price may perhaps accelerate higher.
In the stated case, it could even visit the $76.20 resistance. Any more gains might call for a test of the $78.50 resistance zone in the near term.
On the downside, the first major support sits near the $70.00 zone. A daily close below $70.00 could open the doors for a larger decline. The next major support is $68.50. Any more losses might send oil prices toward $67.00 in the coming days.
Looking at EUR/USD, the pair is consolidating losses above the 1.0800 zone and faces many hurdles near the 1.0920 zone.
Economic Releases to Watch Today
- US S&P Global Services PMI for Oct 2024 – Forecast 55.3, versus 55.3 previous.
- US ISM Manufacturing Index for Feb 2024 – Forecast 53.8, versus 54.9 previous.
China’s Caixin PMI composite rises to 51.9, policy impact begins to show
China's Caixin Services PMI rose to 52.0 in October, surpassing expectations of 50.5 and marking the highest rate of growth in three months. The services sector continues its expansionary streak that began in January 2023. PMI Composite also increased from 50.3 to 51.9, its highest level in four months, maintaining expansion for the 12th consecutive month, driven largely by service-sector resilience.
Wang Zhe, Senior Economist at Caixin Insight Group noted that challenges noted that a range of supportive policies has since been introduced by the Politburo since September. The recent Caixin PMI readings for both manufacturing and services suggest that “market demand stabilized and optimism improved,” signaling early effects of the new policies.