Sample Category Title
Australian Dollar Jumps on Hawkish RBA
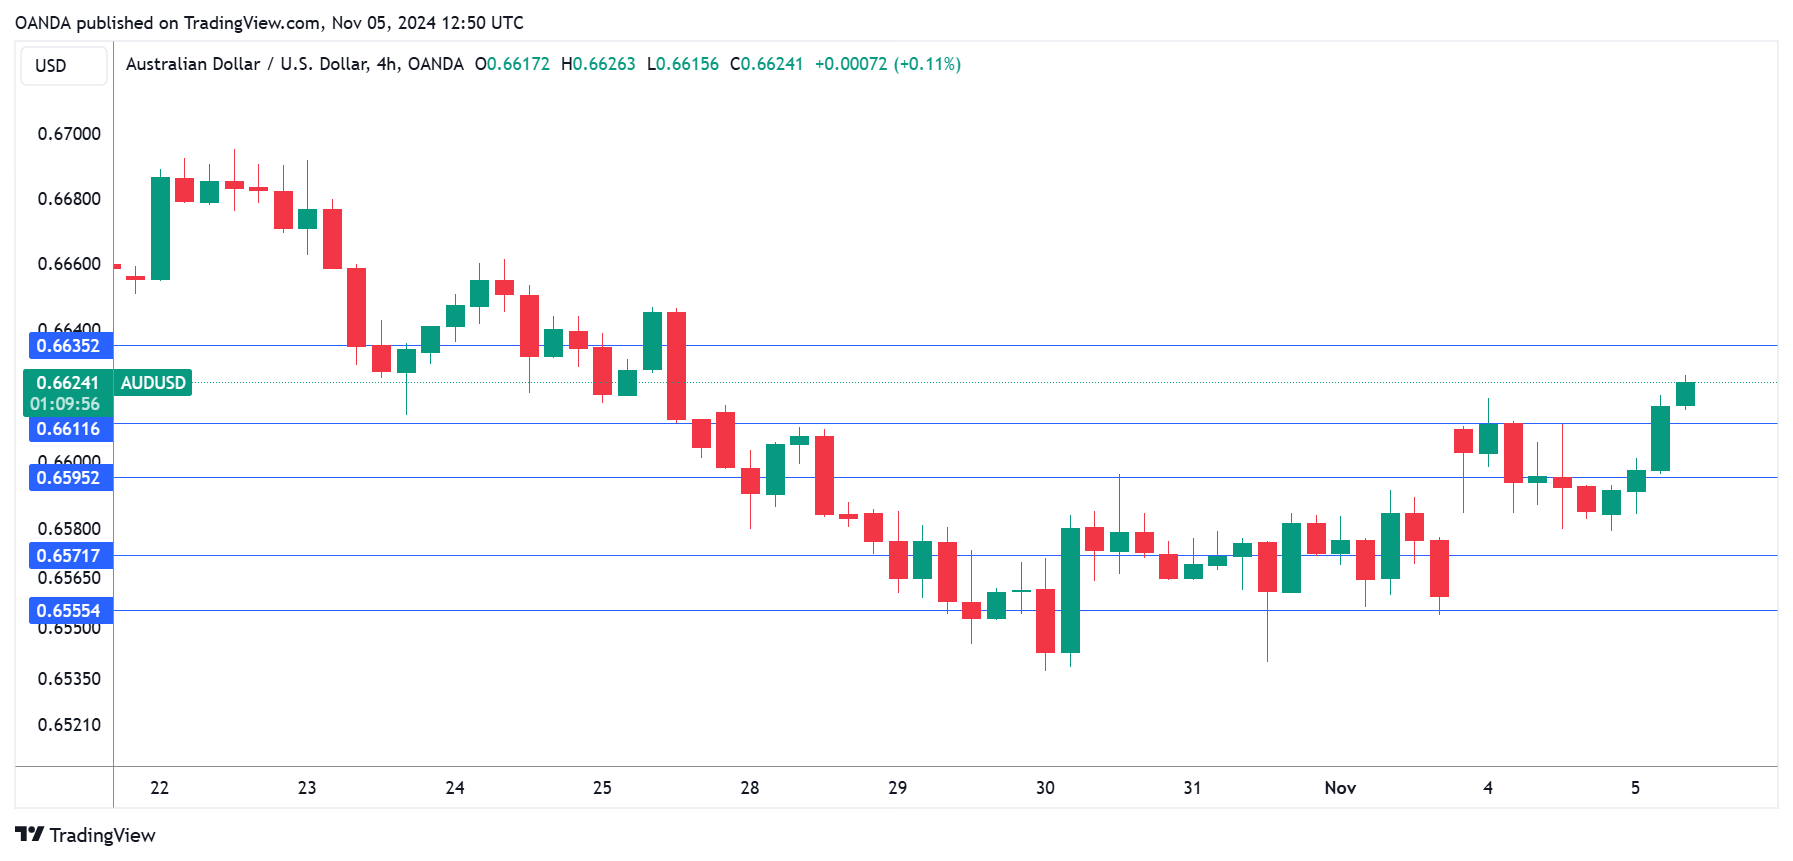
The Australian dollar has posted strong gains on Tuesday. In the European session, AUD/USD is trading at 0.6624, up 0.59% on the day.
RBA holds rates, stays hawkish
Nobody should have been surprised that the Reserve Bank of Australia maintained interest rates on Tuesday. The hold was widely priced in by the markets and marked the eighth straight meeting that the central bank has maintained rates. The RBA has turned into an outlier among major central banks, most of which have responded to lower inflation by trimming rates.
Australia’s inflation rates has also been on a downswing and headline CPI fell to 2.8% y/y in Q3 2024, within the RBA’s target of 2%-3%. Still, core CPI remains higher and services inflation has been sticky and is running at 4.6%.
The RBA had a hawkish message for the markets at today’s meeting. The rate statement said that the Bank was “not ruling anything in or out”. Governor Bullock added at her press conference that there were “still some risks on the upside” and singled out services inflation as evidence that there was “still a significant amount of inflation in the system”.
What can we expect from the RBA? The December meeting will probably see the central bank remain on the sidelines and an initial rate cut is not likely before February 2025. The rate path will depend greatly on inflation – if it continues to weaken, that would bolster the case for a rate cut. Another key factor will be the labor market, which has remained relatively strong despite a sluggish economy. If cracks appears in the labor market in the coming months, expectations for a rate cut will increase.
AUD/USD Technical
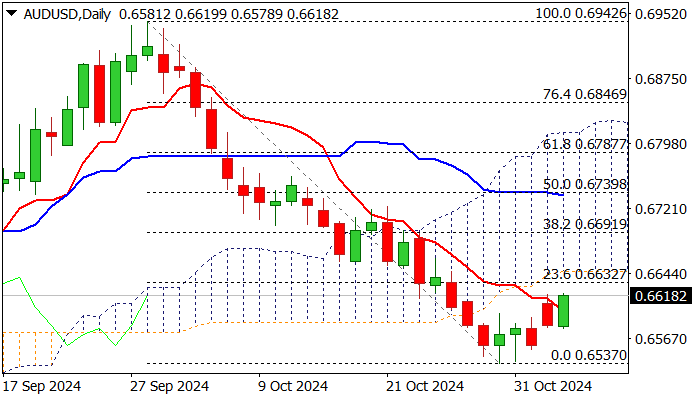
- AUD/USD has pushed above resistance at 0.6595 and is testing resistance at 0.6611. Above, there is resistance at 0.6635
- There is support at 0.6571 and 0.6555
SPX 500: Downside Tail-Risk Protection Activities Prevail on the Eve of US Presidential Election
- The VIX (the implied volatility of the S&P 500) has inched higher above the 20 level in the pastour sessions.
- The VVIX/VIX ratio has moved lower since 16 September, and past data suggests a potential short to medium-term corrective decline in the S&P 500.
- Watch the key intermediate support of 5,675 on the S&P 500.
Since our last publication, the S&P 500 has continued to languish as it failed to recapture its gapped down formed last Thursday, 31 October, and its 20-day moving average, both acting as an intermediate resistance at 5,810.
The movement of the S&P 500 is now being bombarded with macro factors (the upcoming FOMC meeting on 7 November), firm-based risks (ongoing US Q3 earnings session), and political events (the outcome of the US presidential election and the balance of power status in Congress).
Hence, market participants are cautiously hedging on potential negative tail-risk scenarios that could occur in the US stock market, triggered by these factors; either individually or by a concoction of it.
These downside tail-risk protection strategies can be structured via options and or futures markets on stock market implied volatility instruments such as the VIX or the VVIX (implied volatility on the VIX aka VIX of the VIX).
Also, such hedging activities are likely to create a potential reflexive feedback loop into the US stock market which in turn may impact the price actions of the major US stock indices negatively.
VIX has remained above 20 and the VIX/MOVE ratio is still above support
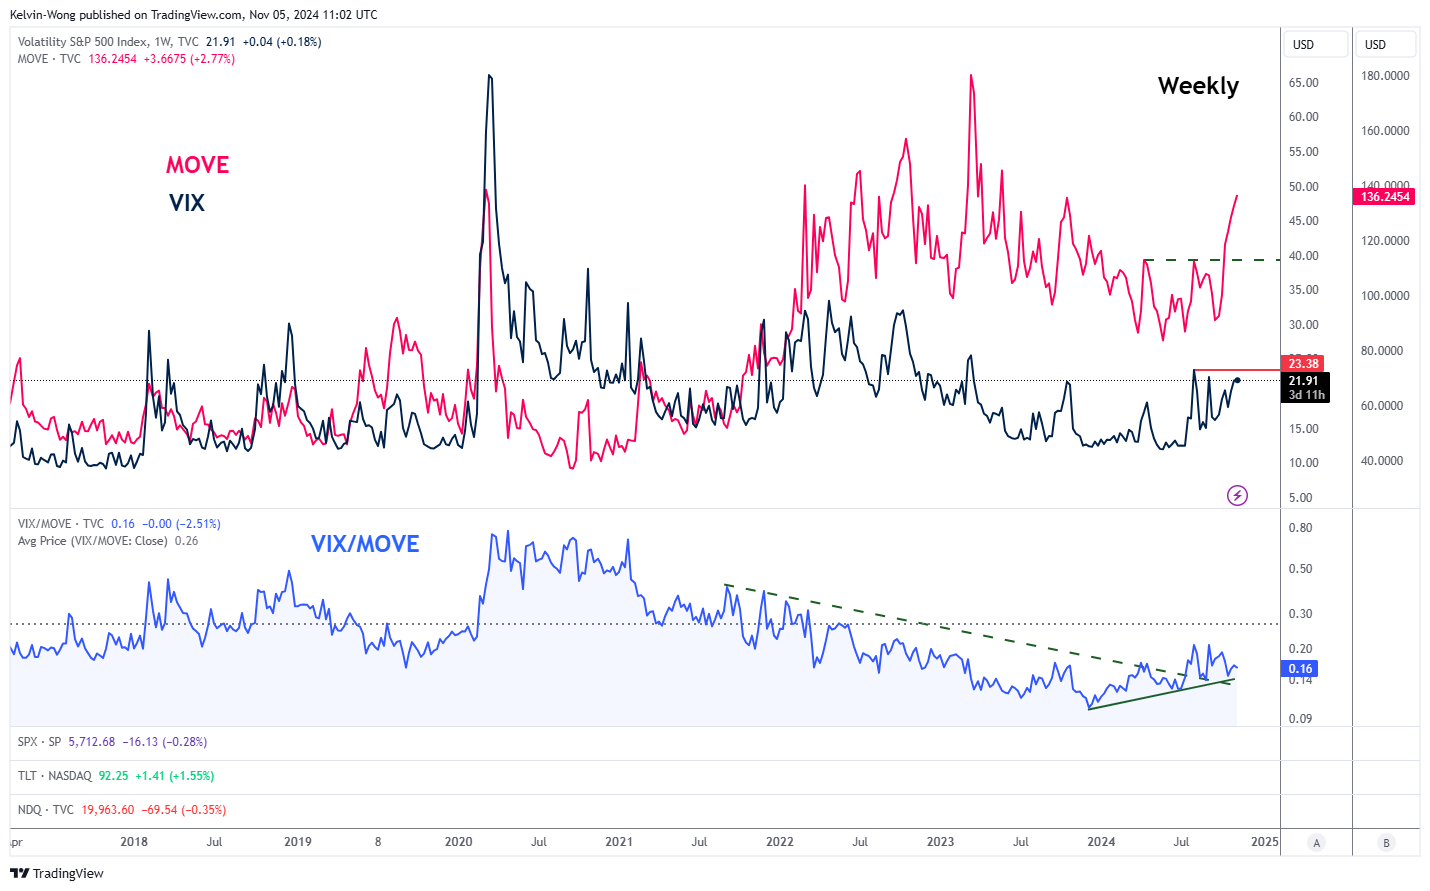
Fig 1: Major trends of MOVE Index, VIX & VIX/MOVE ratio as of 5 Nov 2024 (Source: TradingView, click to enlarge chart)
Since the week of 16 September 2024, the leading Merrill Lynch Option Volatility Estimate (MOVE) Index that reflects the level of volatility in U.S. Treasury futures has surged upwards significantly and cleared above a key medium-term resistance of 112.80.
The VIX (the implied volatility of the S&P 500) has lagged but still tagged along the movement of the MOVE Index and in the past four sessions inched higher above 20 where it recorded a closing level of 21.95 as of Monday, 4 November (see Fig 1).
In addition, the VIX/MOVE ratio has continued to print a series of “higher lows” and remained supported by an ascending trendline since July 2024 which suggests a potential looming outperformance of the lagging VIX over the MOVE Index.
Hence, a breakout above VIX key intermediate resistance of 23.38 may trigger a negative feedback loop into the S&P 500 at least on a short to medium-term time horizon.
The current VVIX value suggests a potential higher VIX
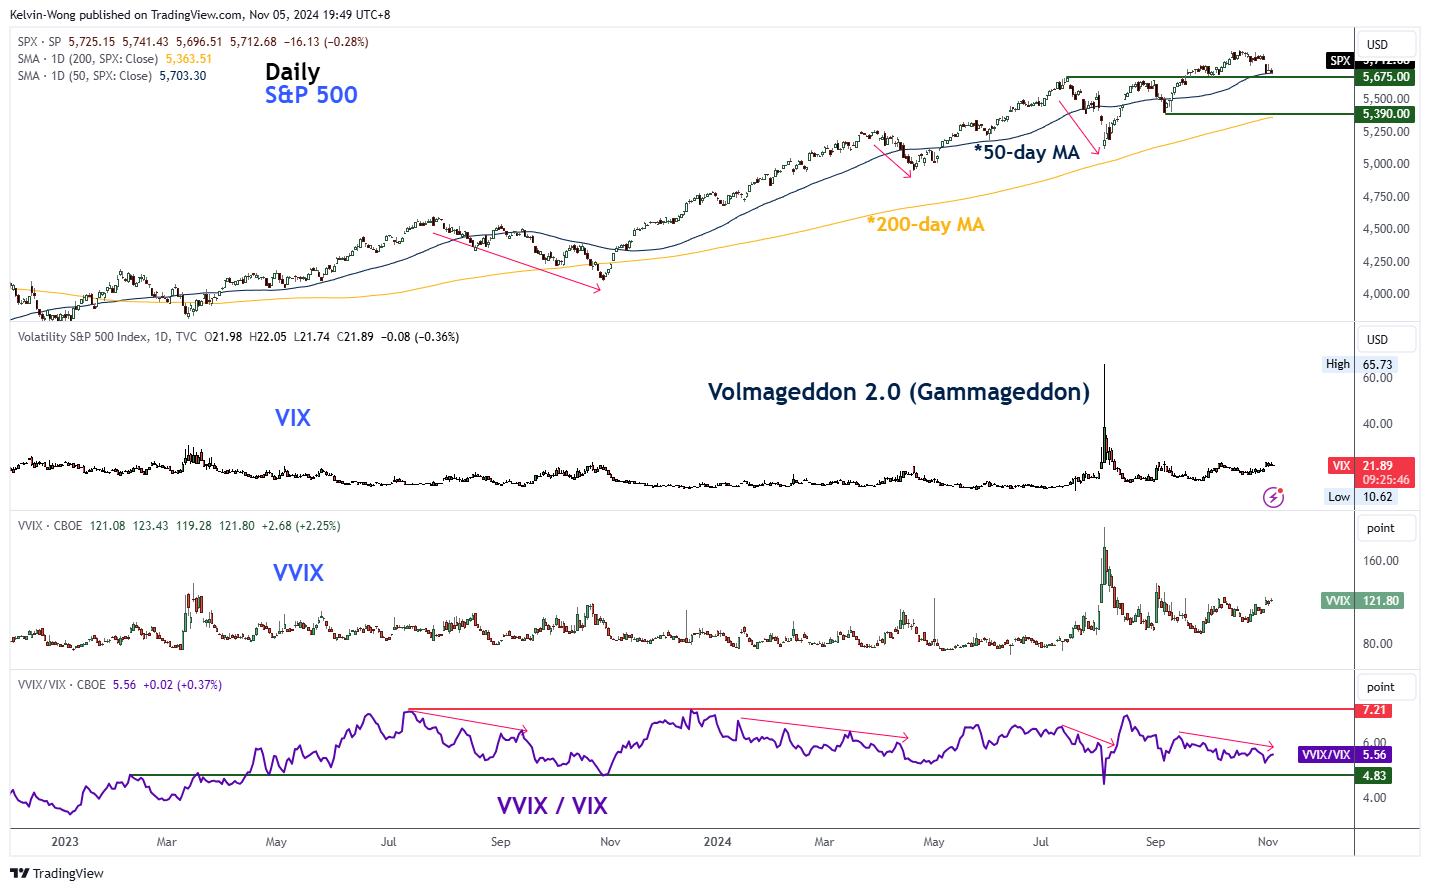
Fig 2: Medium-term trends of S&P 500 & VVIX/VIX ratio as of 5 Nov 2024 (Source: TradingView, click to enlarge chart)
The VIX is calculated from S&P 500 options, and the VVIX is calculated from VIX options. Therefore, a higher movement of VVIX suggests the VIX might be more volatile in the future, which in turn can indicate a market belief that the S&P 500 might also be more volatile.
If we take the relative movement of the VVIX against the VIX by plotting the ratio of VVIX/VIX along the movement of the S&P 500, we can see there are several past occasions since July 2023 that when the ratio of VVIX/VIX inched downwards (VVIX has a relatively higher value than the VIX), the S&P 500 staged a corrective decline of at least 6% thereafter during the periods of 27 July 2023 to 27 October 2023, 1 April 2024 to 19 April 2024, and 16 July 2024 to 5 August 2024.
Also, after these prior three periods of corrective decline sequences occurred on the S&P 500, it managed to stage bullish reversals when the VVIX/VIX ratio declined further to hit a level of 4.83 (see Fig 2).
In recent weeks, the VVIX/VIX ratio has steadily inched downwards since 16 September 2024 and as of 4 November, it has a value of 5.56 (still has room before hitting 4.83) which suggests the S&P 500 may stage a corrective decline towards the medium-term support of 5,390 (also the 200-day moving average) if the key intermediate support of 5,675 (also the 50-day moving average) is broken down.
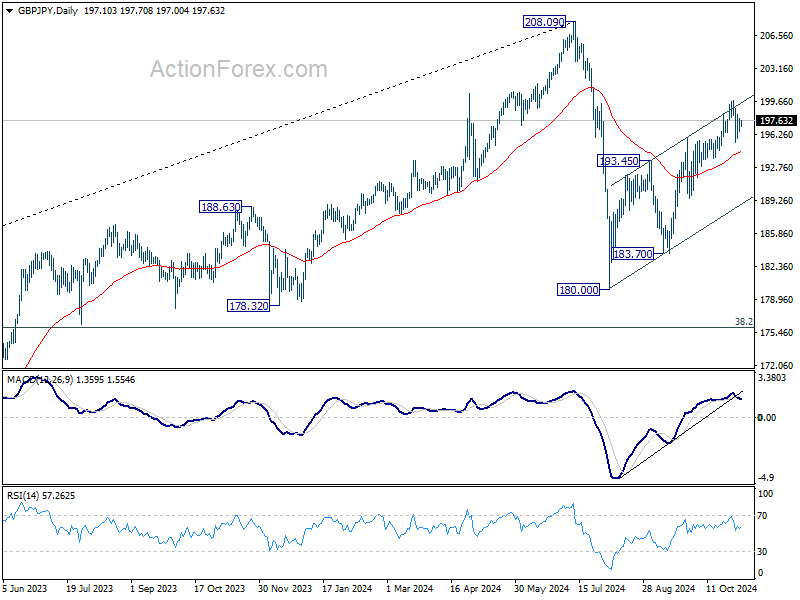
GBP/JPY Daily Outlook
Daily Pivots: (S1) 196.45; (P) 197.17; (R1) 197.85; More...
Intraday bias in GBP/JPY stays neutral as consolidating from 199.79 is extending. Further rally is expected as long as 55 D EMA (now at 194.48) holds. Above 199.79 will resume the rebound from 180.00 to retest 208.09 high. However, sustained break of 55 D EMA will argue that the corrective rise has completed already, and turn near term outlook bearish for 180.00/183.70 support zone.
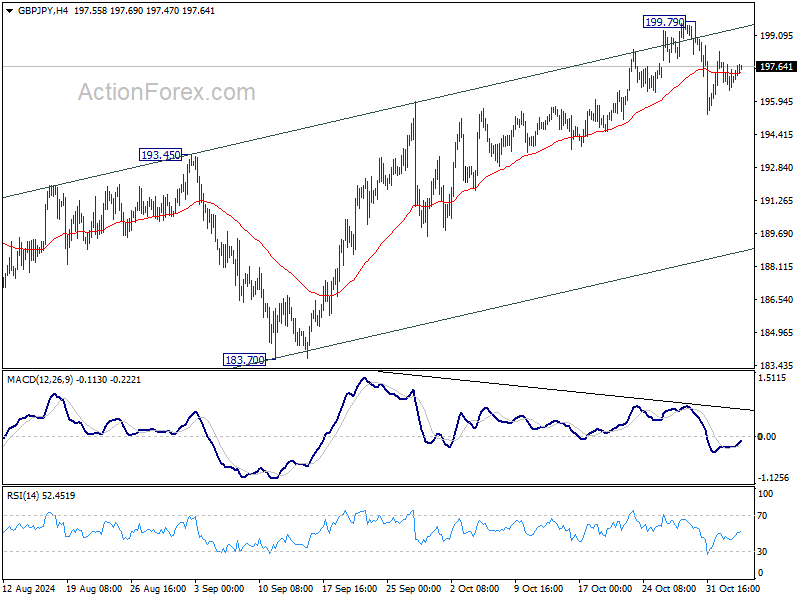
In the bigger picture, price actions from 208.09 are seen as a correction to whole rally from 123.94 (2020 low). The range of consolidation should be set between 38.2% retracement of 123.94 to 208.09 at 175.94 and 208.09. However, decisive break of 175.94 will argue that deeper correction is underway.
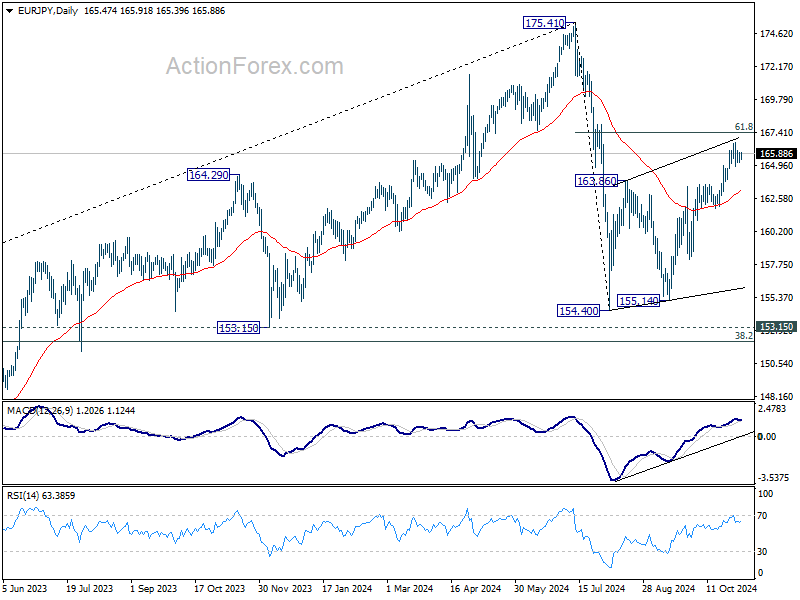
EUR/JPY Daily Outlook
Daily Pivots: (S1) 165.14; (P) 165.55; (R1) 165.89; More....
EUR/JPY is staying in consolidations below 166.67 and intraday bias remains neutral. Further rally is expected as long as 164.25 minor support holds. Sustained break of 61.8% retracement of 175.41 to 154.40 at 167.38 will pave the way to retest 175.41 high. However, considering bearish divergence condition in 4H MACD, firm break of 164.25 will indicate short term topping, and turn bias to the downside for 55 D EMA (now at 163.15).
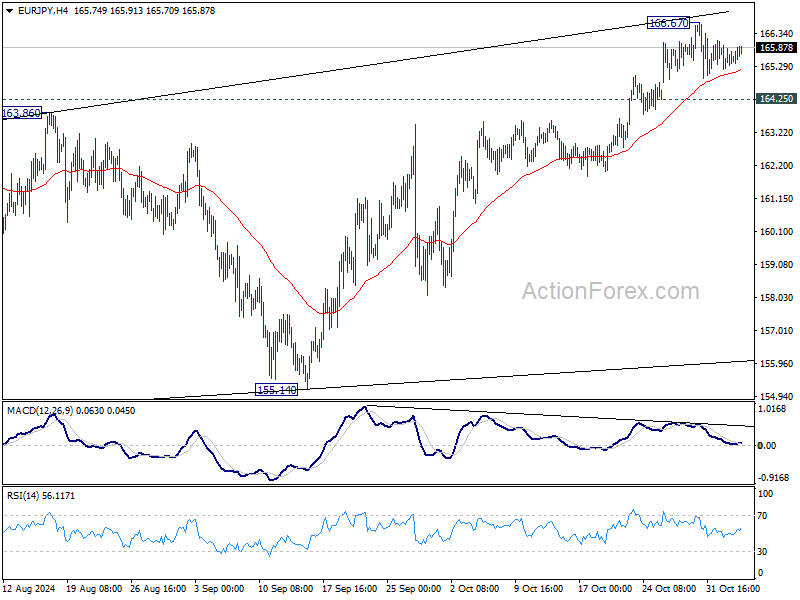
In the bigger picture, price actions from 175.41 are seen as correction to rally from 114.42 (2020 low). The range of consolidation should have been set between 38.2% retracement of 114.42 to 175.41 at 152.11 and 175.41 high. However, decisive break of 152.11 would argue that deeper correction is underway.
EUR/GBP Daily Outlook
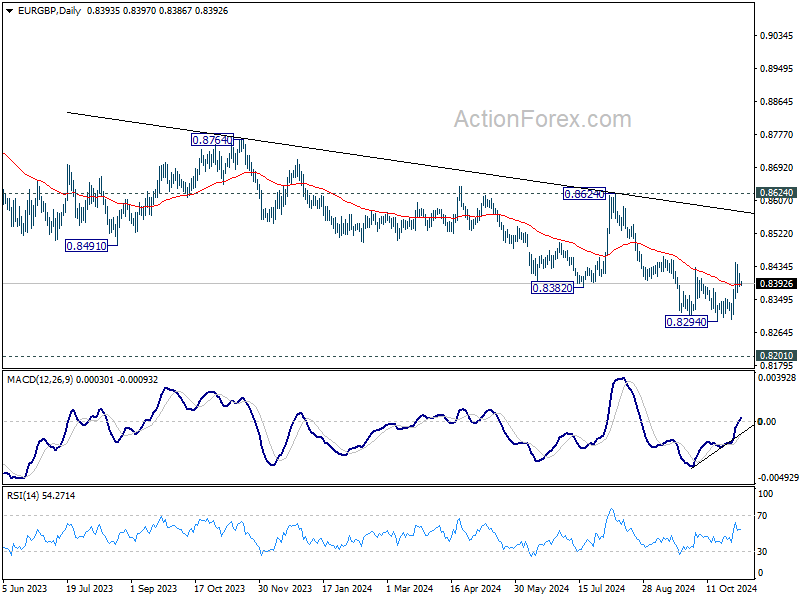
Daily Pivots: (S1) 0.8378; (P) 0.8399; (R1) 0.8415; More...
Intraday bias in EUR/GBP stays neutral first and consolidations from 0.8294 could extend further. On the downside, break of 0.8294 low will resume larger down trend to 0.8201 key support next. On the upside, break of 0.8446 will resume the rebound from 0.8294 short term bottom towards 0.8624 resistance instead.
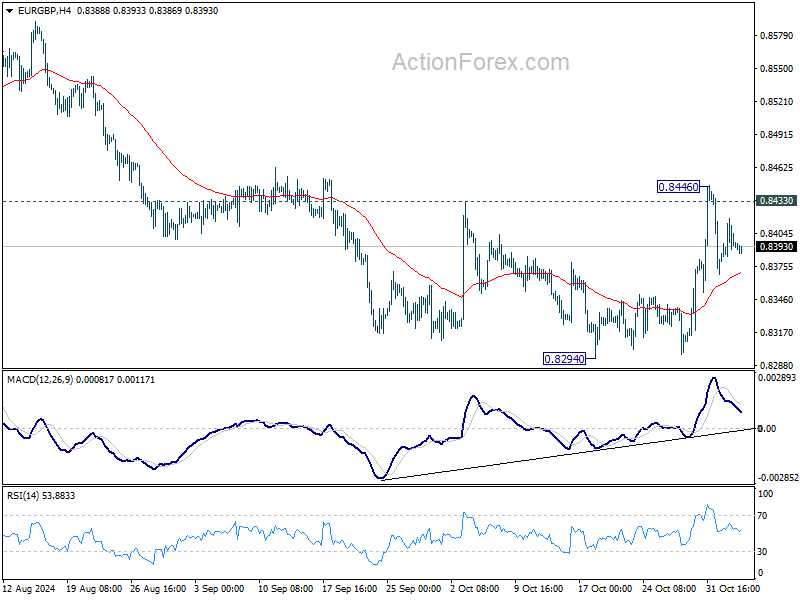
In the bigger picture, down trend from 0.9267 (2022 high) is in progress. Next target is 0.8201 (2022 low), but strong support should be seen there to bring rebound. However, outlook will remain bearish as long as 0.8624 resistance holds even in case of strong rebound. Decisive break of 0.8201 will indicate long term bearish reversal.
EUR/AUD Daily Outlook
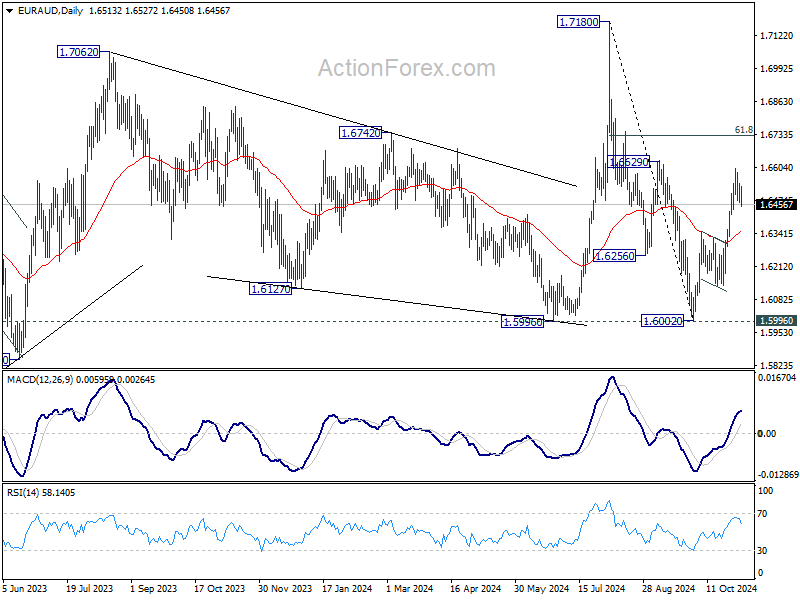
Daily Pivots: (S1) 1.6462; (P) 1.6503; (R1) 1.6559; More...
EUR/AUD is staying in consolidations below 1.6598 and intraday bias stays neutral for now. Further rally is expected as long as 1.6351 resistance turned support holds. On the upside, above 1.6598 will resume the rise from 1.6002 short term bottom to 61.8% retracement of 1.7180 to 1.6002 at 1.6730 next. Sustained trading above there will pave the way to retest 1.7180 high.
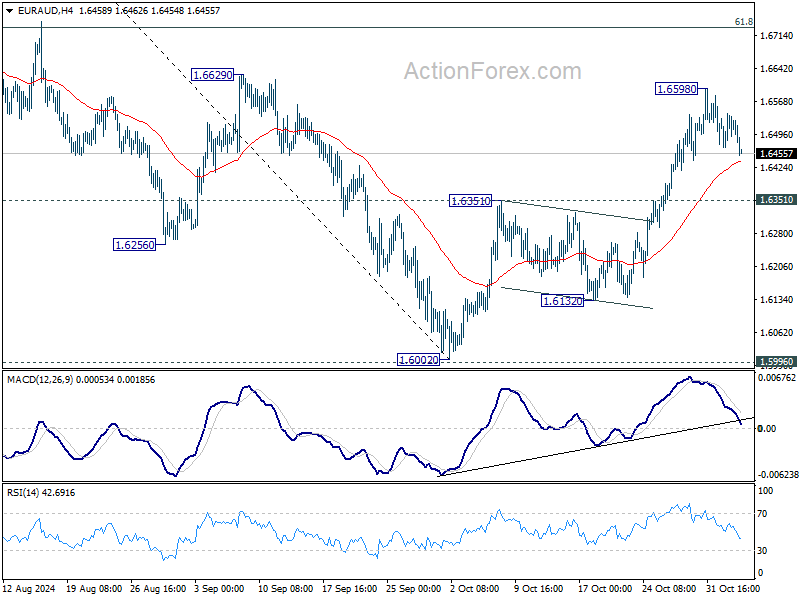
In the bigger picture, as long as 1.5996 cluster support holds (38.2% retracement of 1.4281 to 1.7062 (2023 high) at 1.6000), up trend from 1.4281 (2022 low) is still expected to resume at a later stage. However, decisive break of 1.5996 will argue that the medium term trend has reversed and turn outlook bearish.
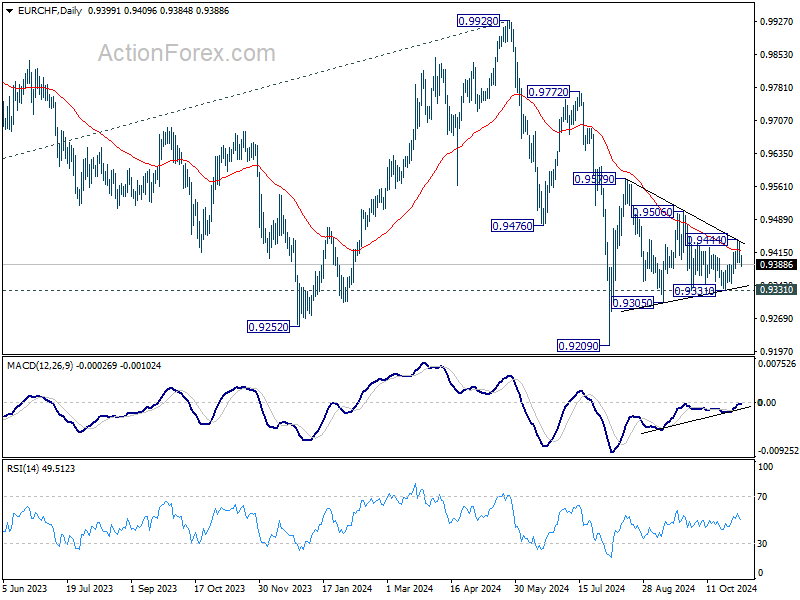
EUR/CHF Daily Outlook
Daily Pivots: (S1) 0.9382; (P) 0.9412; (R1) 0.9428; More....
No change in EUR/CHF's outlook as range trading continues. Intraday bias stays neutral for the moment. On the downside, break of 0.9331 will resume the fall from 0.9579 towards 0.9209 low. On the upside, break of 0.9444 will turn intraday bias to the upside for 0.9506 resistance and above.
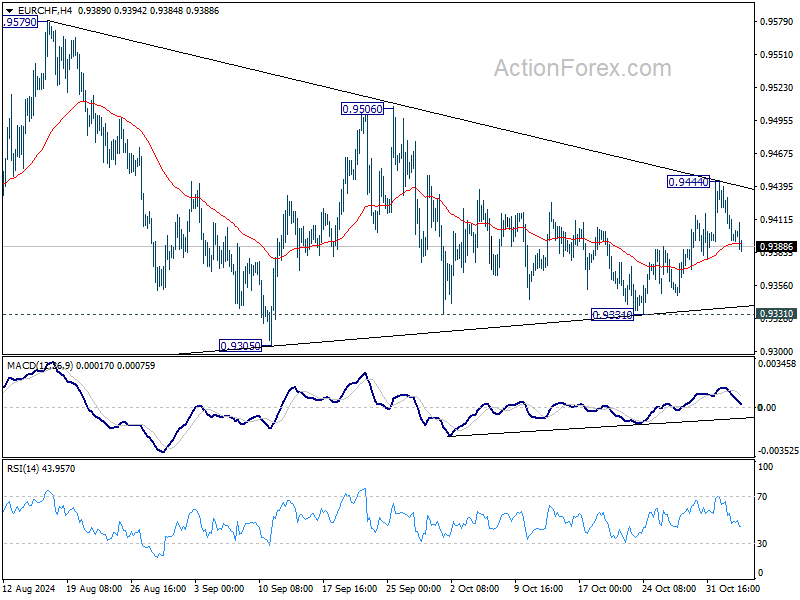
In the bigger picture, fall from 0.9928 is seen as part of the long term down trend. Repeated rejection by 55 D EMA (now at 0.9421) keeps outlook bearish for breaking through 0.9209 low at a later stage. Nevertheless, sustained trading above 55 D EMA will confirm medium term bottoming at 0.9209 and bring stronger rebound back towards 0.9928 key resistance.
EURUSD Stabilises as US Presidential Election Unfolds
EURUSD remains poised around 1.0878 as markets brace for the outcome of the highly anticipated US presidential election. With the world watching, the direction of the major currency pair will hinge significantly on the election results, where a victory for Donald Trump is likely to bolster the USD, potentially leading to a notable increase. Conversely, a win for Kamala Harris could see the USD decline by an average of 1-2%.
The impending volatility is not solely due to the election but amplified by the upcoming Federal Reserve meeting scheduled for Wednesday. The Fed is anticipated to cut interest rates slightly by 25 basis points. Market participants are keenly awaiting any forward guidance from the Fed, particularly with expectations leaning towards another rate reduction in December.
While significant economic data releases are also expected, these pivotal events may overshadow their impact.
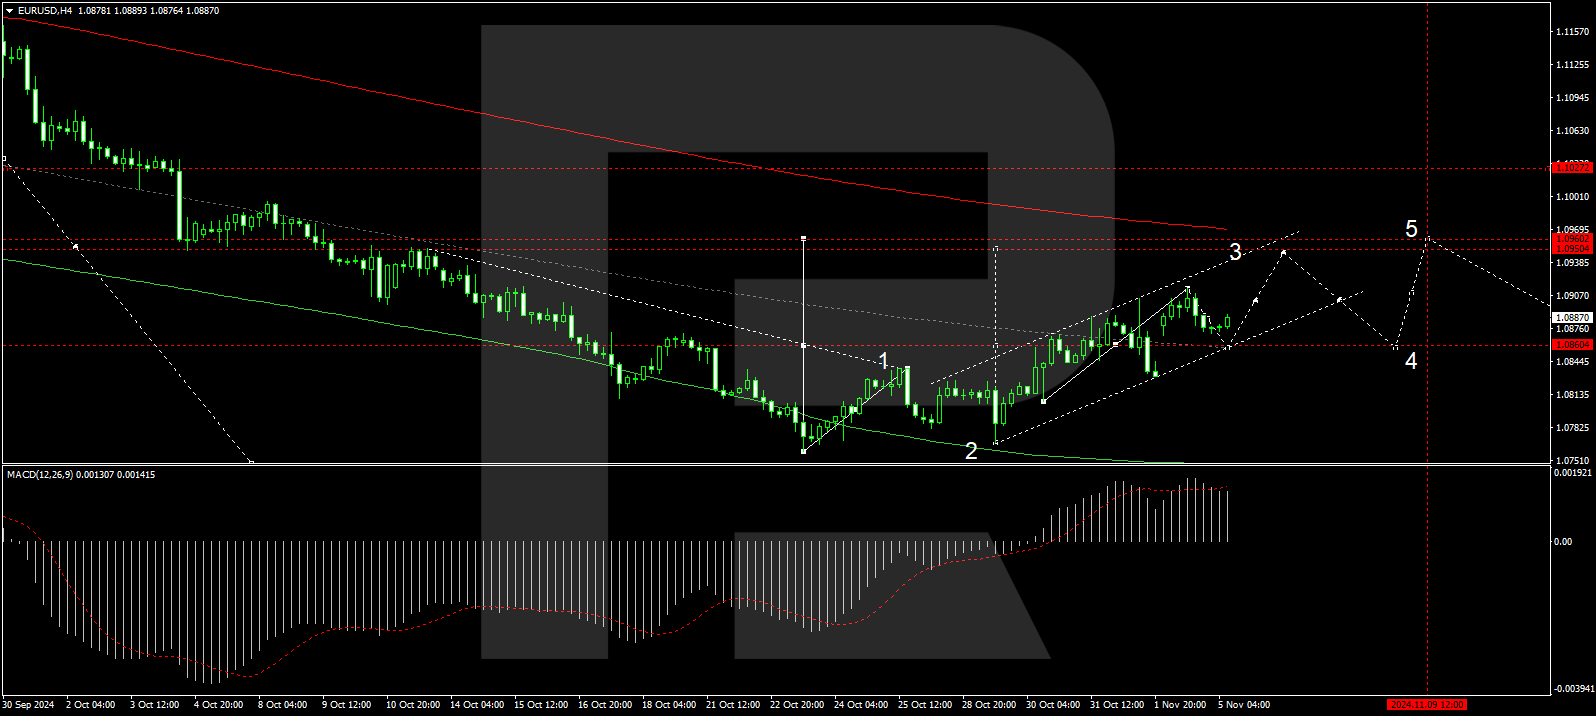
Technical analysis of EURUSD
The EURUSD market has completed a growth structure reaching 1.0913, considered part of a third growth wave targeting 1.0950. After this target is achieved, a retraction to 1.0860 is anticipated, potentially forming a broad consolidation range around this level. Technical indicators, such as the MACD, suggest an upward trajectory, reinforcing the possibility of reaching 1.0960 before a corrective pullback to 1.0860.
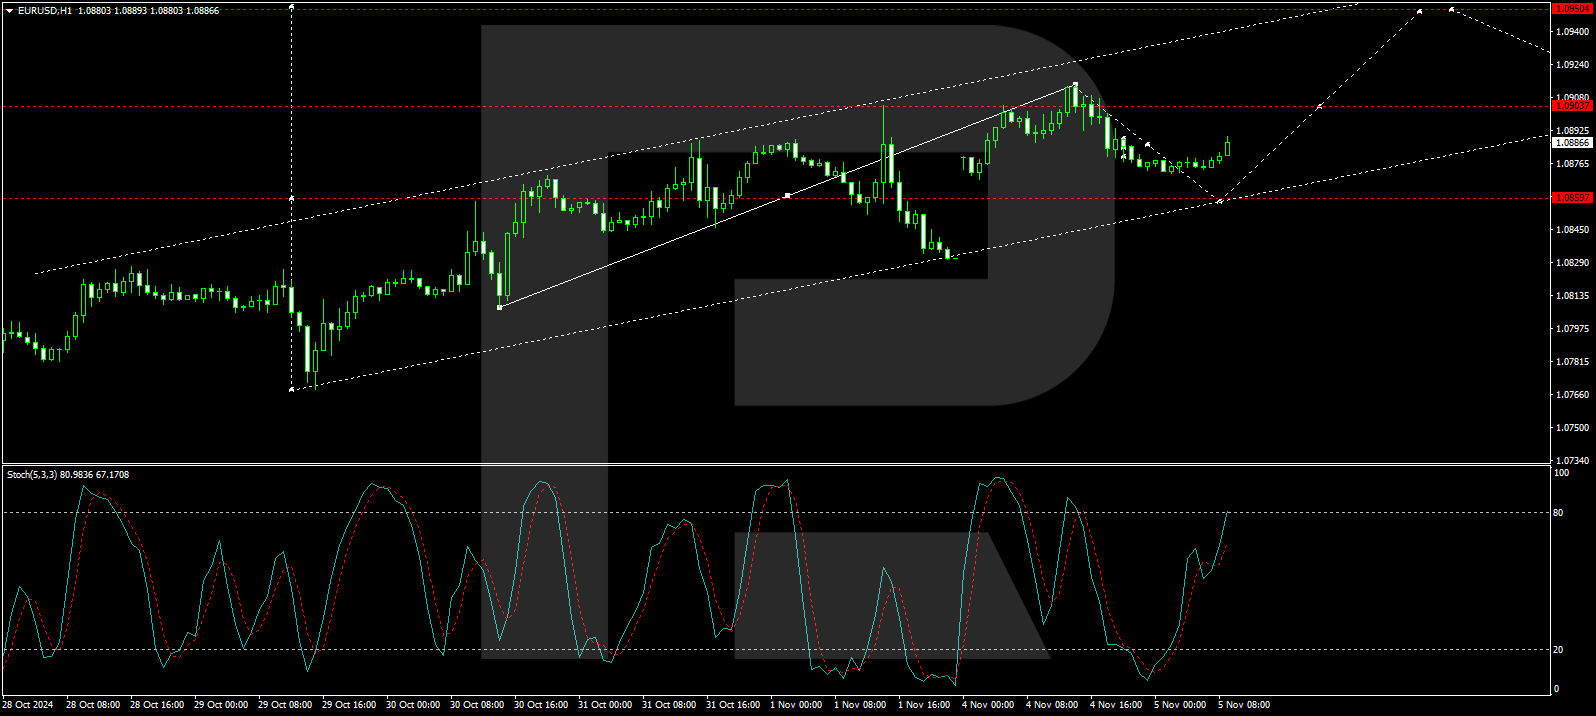
Support at 1.0872 has spurred the development of a growth impulse towards 1.0900, which is expected to be tested soon. Breaching this level could extend the growth wave towards 1.0950. The Stochastic oscillator supports this short-term forecast, indicating upward momentum with its signal line targeting the upper echelons around 80.
How U.S. Presidential Election May Impact S&P 500 Index
Today, 5 November, the U.S. presidential election is underway, and it may serve as a significant driver of volatility for global stock markets.
According to EuroNews, heightened market fluctuations are expected throughout the voting period on 5 November, potentially mirroring reactions observed during the Brexit referendum and the 2016 U.S. election. Newsweek notes that historically, U.S. stock markets tend to rise regardless of the election winner. In 2020, for example, American stocks rose immediately after election day and continued upward even as Trump contested the results.
Investor’s Business Daily highlights Tony Roth, CIO of Wilmington Trust, who argues that U.S. stock markets could climb regardless of whether Harris or Trump wins, as both candidates provide viable economic paths that could support market sentiment.
On 14 October, analysing the S&P 500 chart (US SPX 500 mini on FXOpen), we plotted three narrow upward channels (shown in blue), noting:
→ each channel has a similar slope and width;
→ connecting the maximum of Channel 1, the peak and trough of Channel 2, and the low of Channel 3 outlines a larger channel (in orange).
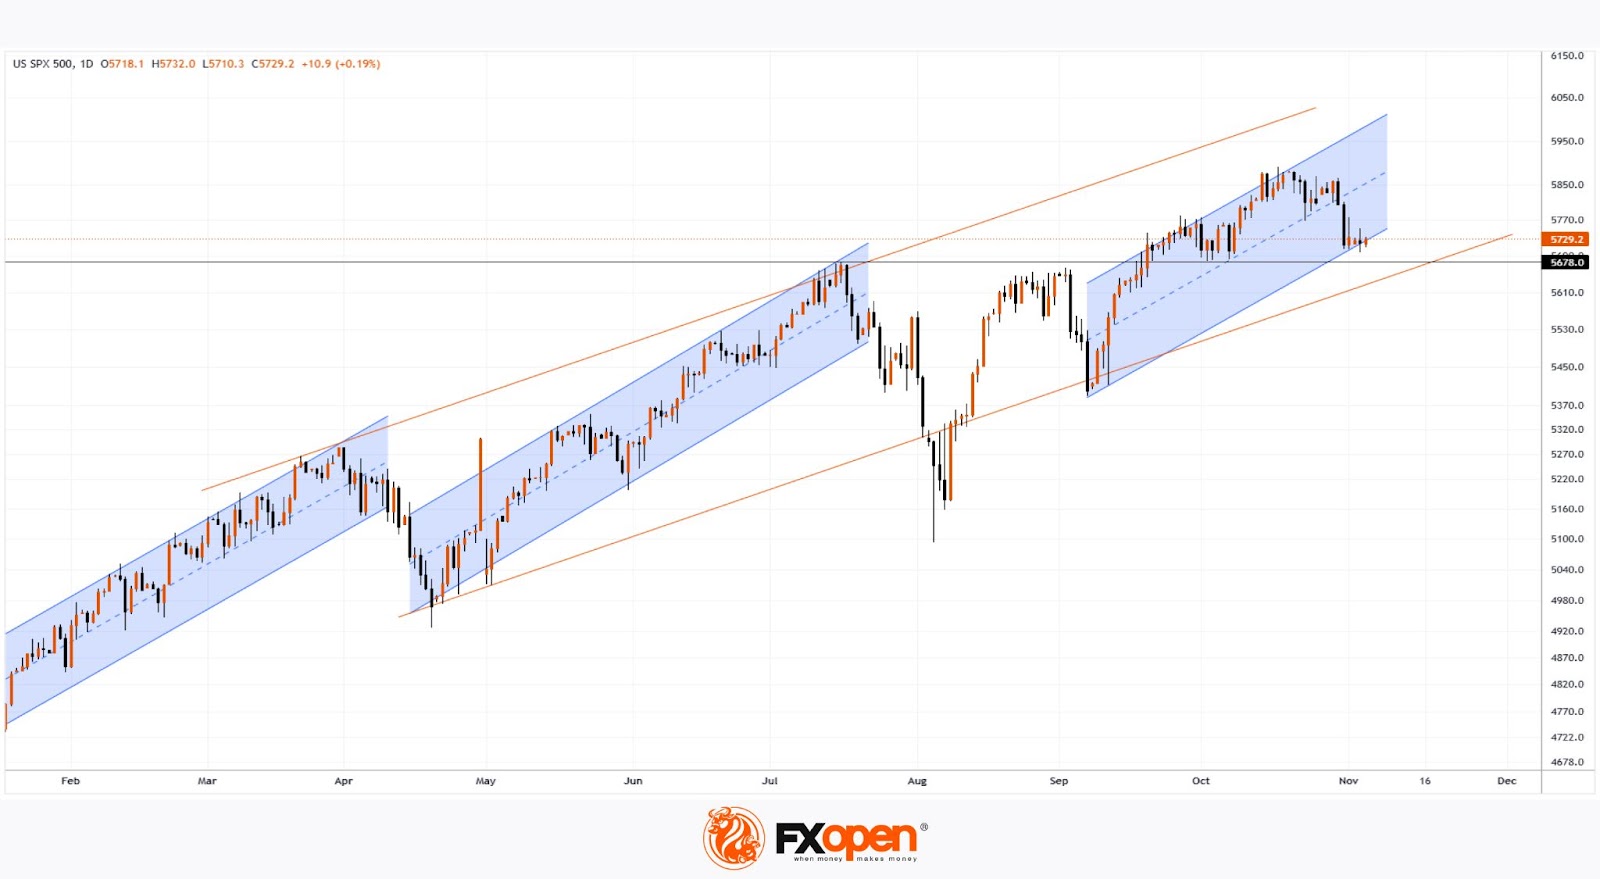
Today’s technical analysis of the S&P 500 (US SPX 500 mini on FXOpen) shows the current index level near the lower edge of the third blue channel, with additional support around:
→ former resistance at $5678;
→ the lower orange boundary.
Election results may trigger a volatility spike, potentially testing or reinforcing these support levels, which could shape future market momentum.
Trade global index CFDs with zero commission and tight spreads. Open your FXOpen account now or learn more about trading index CFDs with FXOpen.
This article represents the opinion of the Companies operating under the FXOpen brand only. It is not to be construed as an offer, solicitation, or recommendation with respect to products and services provided by the Companies operating under the FXOpen brand, nor is it to be considered financial advice.
AUD/USD Outlook: Hawkish RBA Lifts Aussie Dollar Towards Key Resistance Zone
AUDUSD rose to one week high on Tuesday morning, after the RBA kept interest rates steady at 12-year high and kept hawkish stance on persisting upside inflation risk, although remains ready to act if economy weakens more.
Near-term action is holding within a recovery leg from 0.6587 (Oct 30 low) and was boosted by Monday’s gap-higher opening.
Slight improvement of technical picture on daily chart (the price rose above 10DMA and potential formation of daily bullish engulfing) generates initial bullish signal, although daily studies are still predominantly bearish (14-d momentum is still in negative territory, the action weighed by thick daily Ichimoku cloud) and more work at the upside required to spark stronger recovery.
Recovery faces very strong barriers at 0.6627/45 (200DMA / Fibo 23.6% of 0.6942/0.6537 downtrend / base of thick daily Ichimoku cloud) violation of which to likely spark stronger recovery, while recovery may stall if fails to clear these barriers.
Markets will be looking for the situation surrounding today’s US election, as well as coming FOMC policy meeting
Res: 0.6627; 0.6645; 0.6691; 0.6723.
Sup: 0.6599; 0.6578; 0.6553; 0.6537.