Sample Category Title
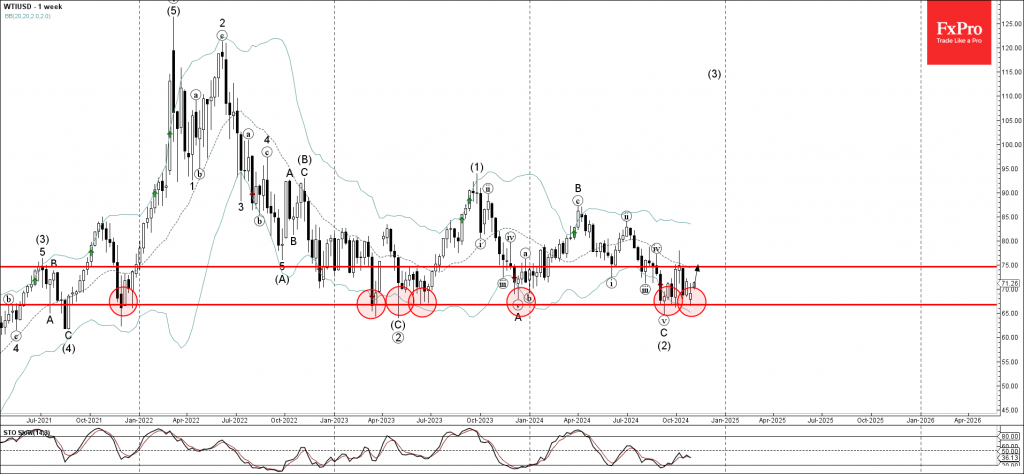
WTI Wave Analysis
- WTI reversed from long-term support level 66.75
- Likely to rise to resistance level 75.00
WTI crude oil recently reversed up from the long-term support level 66.75 (which has been reversing the price from the end of 2021), standing near the lower weekly Bollinger Band.
The upward reversal from the support level 66.75 continues the weekly upward impulse wave (3), which also started from the same support level in September.
Given the strength of the support level 66.75, WTI crude oil can be expected to rise to the next resistance level 75.00 (former strong resistance from October).
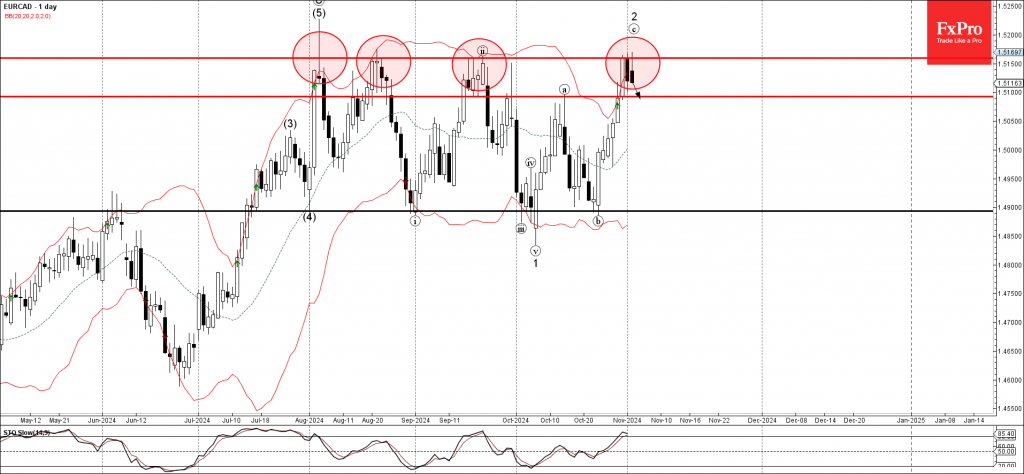
EURCAD Wave Analysis
- EURCAD reversed key resistance level 1.5160
- Likely to fall to support level 1.5100
EURCAD currency pair recently reversed down from the key resistance level 1.5160 (which has been steadily reversing the price from the start of August as can be seen below), strengthened by the upper daily Bollinger Band.
The downward reversal from the resistance level created the daily Japanese candlesticks reversal pattern Dark Cloud Cover – which marked the end of the previous ACB correction 2.
Given the strength of the resistance level 1.5160 and the overbought daily Stochastic, EURCAD currency pair can be expected to fall to the next support level 1.5100, the former resistance from October.
Sunset Market Commentary
Markets
US presidential election polls remain talk of town in an otherwise uninspiring trading session. Trump’s momentum was already dented last week following some swing-state polls. They took away his narrow lead in prediction models, putting both candidates at exactly 50%. Focus today switched to an Iowa survey which put Harris ahead in the hawkeye state won by Trump on the previous two occasions. The result is an outlier when compared to other Iowa election polls. Anyway, the resulting market volatility is the one we simply have to deal with on the eve of the potentially closest US presidential elections since 2000. In a so far one-off reset at the start of Asian trading (thinned by the way by Japan’s public holiday), US yields succumb 7 bps (2-yr) to 11 bps (10-yr). German yields changes range between +3 bps (2-yr) and -3 bps (30-yr) as EMU money markets continue paring 50 bps rate cut bets for December following last week’s Q3 GDP and October CPI data. The dollar faced a setback with the trade-weighted greenback currently changing hands around 103.75 compared with Friday’s close at 104.35. EUR/USD spends time around the 1.09 big figure and even USD/JPY gets some more breathing space (152). Sterling trades volatile around 0.84 awaiting the Bank of England’s interpretation of last week’s 2025 Budget. Upward growth and CPI forecasts are expected to tie the BoE’s hands for somewhat longer in the policy normalization cycle. Any indications to endorse BoE governor Bailey’s proposed activism could tip the balance again in sterling’s and UK Gilt’s disadvantage.
Belgian OLO’s slightly outperform against French OAT’s today. The move feels counterintuitive at first given that NVA De Wever handed in his resignation with the King as “formateur” in deadlocked federal government coalition talks (almost 5 months since ballot). Flemish centre-left socialists of Vooruit are getting cold feet about entering a centre-right government (ARIZONA: Christian democrats (CD&V and Les Engagés), French speaking Liberals MR, Flemish rightwing NVA) aiming to tighten fiscal policy. The King didn’t accept the resignation (yet), giving De Wever an additional week to find common ground or an alternative. Replacing Vooruit by Flemish Liberals of OpenVLD is a route suggested by other party leaders. OpenVLD got slaughtered in elections, opting for a time in opposition. Joining (or backing) the ARIZONA-government would give the smallest of majorities (76/150) and be extremely fragile but in any case reform-minded. Flemish parties should then be willing to give away their relative majority with the government. There’s little appetite for a fresh ballot, especially on the French-speaking side as election winning MR and Les Engagés failed to hold momentum into October local elections. They don’t want to risk bringing back the socialists of PS into the equation.
News & Views
The Turkish disinflation process proceeds at a slower than expected pace. Headline inflation in October ‘eased’ to 2.88% M/M and 48.6% Y/Y compared to 2.97% M/M and 49.4% in September. In a month-on-month perspective, price rises were mainly driven by a higher prices for clothing and footwear (+14.32 %) and food and non-alcoholic beverages (4.33%). Transportation costs declined 0.54% M/M. In a Y/Y comparison, a 93.66% rise in prices for education and 89.39% rise in housing costs are catching the eye. Core inflation (excluding food, energy and gold) printed at 2.79% M/M and 47.75% Y/Y, close to expectations. At the September policy meeting, the CBRT kept its policy rate unchanged at 50%, but turned more cautious on the room for policy easing after higher than expected September inflation. Later this week governor Karahan presents a new CBRT quarterly inflation report, which will be key for markets to assess the timing of a first rate cut. Higher than expected September and October inflation has reduced chances for a start of the easing cycle in December (or even January).
German companies turned more cautious on their personnel planning, according to the IFO employment barometer which declined from 94 in September to 93.7 in October, the weakest level since July 2020. In a comment on the IFO website, the head of IFO surveys analyses that “the situation in the labour market has been on a negative trend for months, not sharply, continuously”. Rather than filling vacancies he assumes that companies are more likely to lay off employees. The index for manufacturing dropped again as fewer employees are needed due to the difficult order situation. A similar narrative holds for trade, but the indicator rose slightly. Regarding service providers, positive and negative responses are reported almost in balance. The same applies to construction. The IFO survey still sees demand for new employees in tourism and the IT sector.
Preparing for a US Election Marathon
- The world is preparing for the November 5 US presidential election
- Voting times vary across states but the focus will be on seven key states
- Candidates need to win most of these swing states to secure victory
- “Safe” states will be called quickly but the final result might be delayed for days
The countdown to the US presidential election is almost finished, with the polls opening on Tuesday. Market participants have been speculating about the economic agendas of both candidates for a while, trying to discount the likely market impact on the key asset classes. Putting the market analysis aside, the focus of this report is on the procedural aspect of November 5.
What is at stake on November 5?
Apart from the US presidency, with the new President officially taking over on January 20, 2025 when Inauguration Day occurs, 435 members of the House of Representative and 33 Senators will be elected. It is critical for the new president to have the support of the Congress in order to be able to implement his/her government plan. Otherwise, deadlock will ensue, tensions will remain high, with the usual political shenanigans taking place at every major issue, for example, during the debt ceiling discussion.
How is the US president elected?
Voters at each state elect electors. On December 17, the Electoral College will convene and vote for the new President. There are 538 electors with both Harris and Trump aiming to secure the support of at least 270 electors. It is worth nothing that these electors are expected to vote in favour of the candidate that earned the highest number of votes on November 5 at the state they represent.
When does voting stop?
In the majority of US states, polls will close at around 9pm ET (2am GMT). Alaska is the last to close its polls at 1am ET (6am GMT) while California has a deadline of 11pm ET (4am GMT).
Which are the safe states, where an upset could signal a surprise election result?
There are some traditional states that tend to consistently vote for Democrats or Republicans since the 1970s. For example, Alabama, Alaska, Arkansas, Idaho, Kansas, Kentucky, Mississippi, Missouri, Montana, North Dakota, Oklahoma, South Dakota, Tennessee, Texas, Utah, West Virginia and Wyoming are called red states for usually voting in favour of the Republican candidate.
On the flip side, California, Connecticut, DC, Delaware, Hawaii, Illinois, Massachusetts, Maryland, New Jersey, New York, Oregon, Rhode Island, Vermont and Washington tend to support the Democratic candidate.
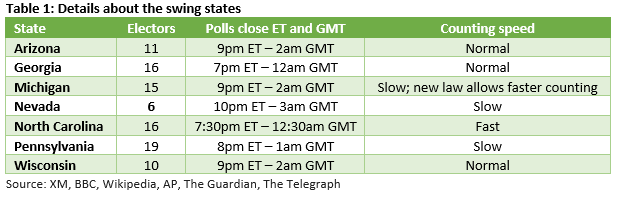
Which are the key battleground states?
Arizona, Georgia, Michigan, Nevada, North Carolina, Pennsylvania and Wisconsin will determine the election outcome. They have a total of 93 electors. In 2020, President Biden won Arizona, Georgia, Michigan, Nevada, Pennsylvania and Wisconsin, losing only North Carolina to Trump.
In 2016, Trump won Arizona, Georgia, Michigan, Pennsylvania, North Carolina and Wisconsin, but lost Nevada to Clinton.
Why TV channels “call” the states?
The Associated Press and the big US channels tend to “call” the US states for one of the two main candidates fairly quickly. This is based on actual votes, exit polls and their own analysis of the remaining votes to be counted. This is not the official result, but it is considered a very secure estimate.
Does it take a long time to count the votes?
Most states allow absentee voting and voting by mail, and they have the right to count these votes during the time that polls are still open, sometimes ever before November 5. This means that once polls are closed, they can quickly announce the results of these votes. Word of caution though as these early figures might not be representative of the final result.
Colorado, Florida and South Carolina are among the states that tend to quickly count their votes. Others like Pennsylvania, Nevada and Minnesota are usually slow in counting the cast ballots.
Who declares the results?
There is no single federal agency that tallies the results and declares the winners. This means that states will declare, officially announce the winner, wherever counting has completed. For most states this declaration will take place in the 12-24 hour window after polls close, but it can take much longer in certain cases.
When will we know the final result?
If one of the two main candidates does not have a clear lead in the swing states, it could take a few days for the final result to be declared. For example, in 2020, Biden was officially declared the winner when the Pennsylvania result was confirmed, four days after the election day.
Additionally, most of these key states automatically recount all the votes if the margin is less than 0.5% or 1%, potentially postponing the final result even further.
OPEC+ Continues to Actively Support Oil Prices
Market Picture
Crude oil gained around 2.5% on Monday after OPEC+ reported that it intends to delay the cartel’s production quota increase by one month from December. The November 2023 agreement calls for eight major producers, including Saudi Arabia and Russia, to voluntarily cut output by 2.2 million bpd.
This is another attempt by the cartel to reverse the downward price trend that has been in place since April. The decline is being driven by macroeconomic factors such as a slowdown in China and sluggish European demand. On the supply side, production increases outside the cartel stand out, including the US, which has produced a record 13.5 million bpd over the past three weeks.
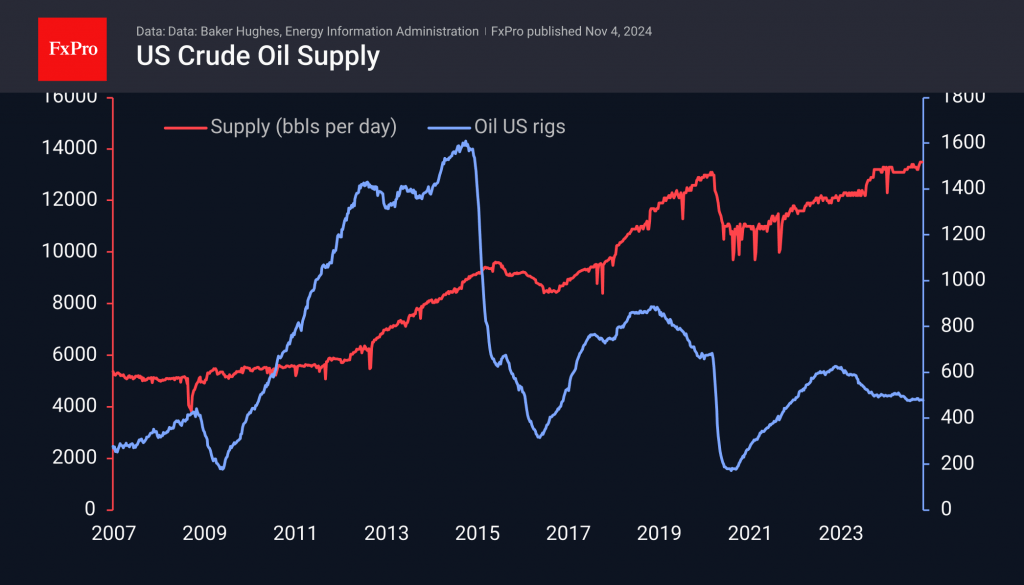
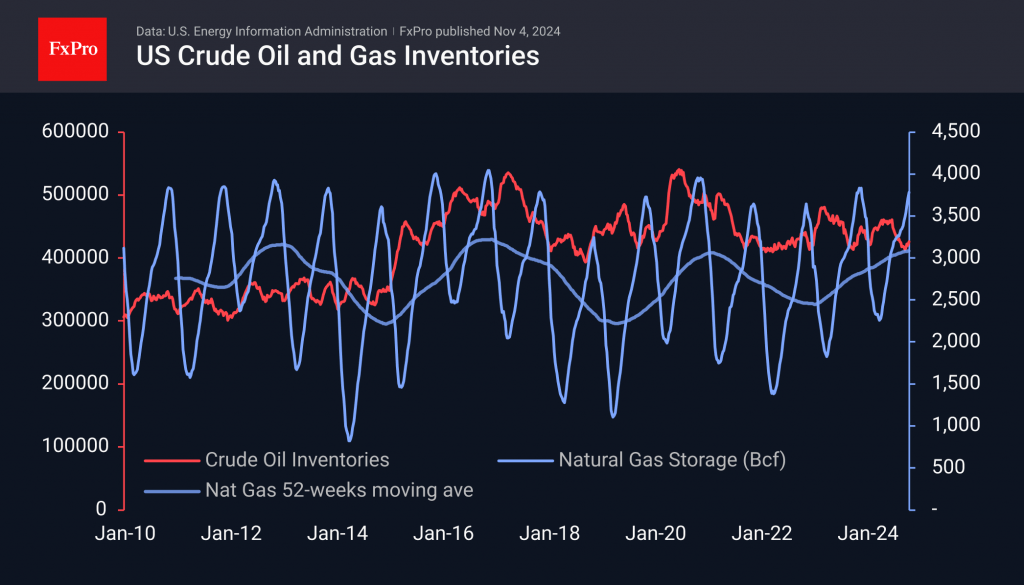
Natural gas inventories, the closest substitute for oil, are at a near four-year high. The moving average, which smooths out intra-year fluctuations, has reached the 2016 and 2020 highs, indicating a glut of hydrocarbons in the world’s largest economy.
The struggle between deteriorating macroeconomic sentiment and the cartel’s desire to reduce supply has been an important feature for much of this year and remains so at present. In addition to this, there is a strong growth in alternative energy sources, which is somewhat unusual at a time of relatively low oil and gas prices.
Technical Analysis
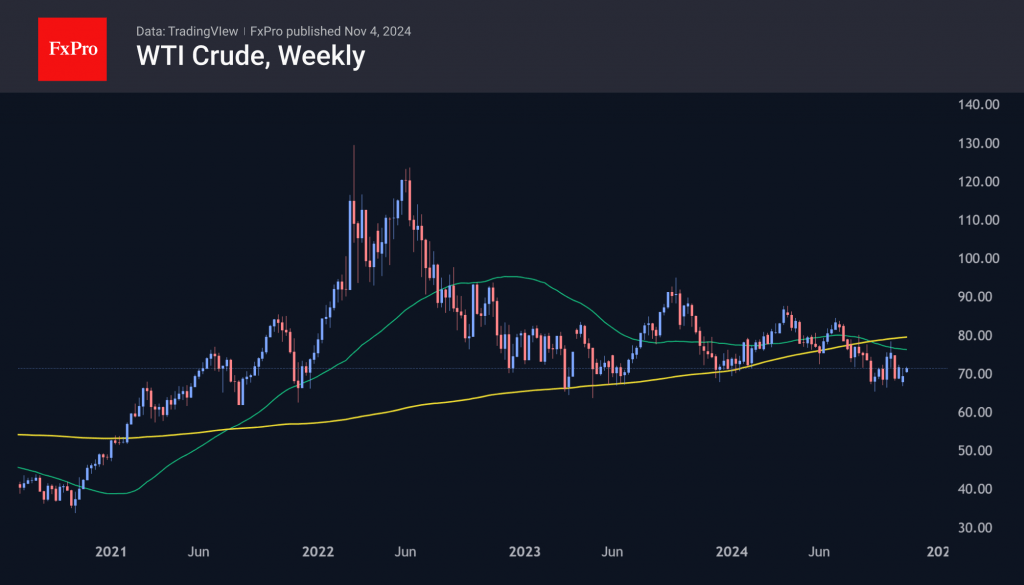
The rally at the start of the new week closed the negative gap we saw a fortnight ago following the Israeli strike on Iran. Some traders see the gap closing as a reason to sell again, especially as oil remains below the 50- and 200-week moving averages on a weekly basis, an important signal of a long-term bearish trend.
While economics usually trumps OPEC geopolitics in the medium term, the cartel’s continued efforts point to a ‘support’ price that the cartel is trying to hold. If it succeeds, key levels for the bulls will be $75 for WTI (the area of the October highs and the 50-week average) and $80 (a key round level also targeted by the 200-week average).
USD/JPY Mid-Day Outlook
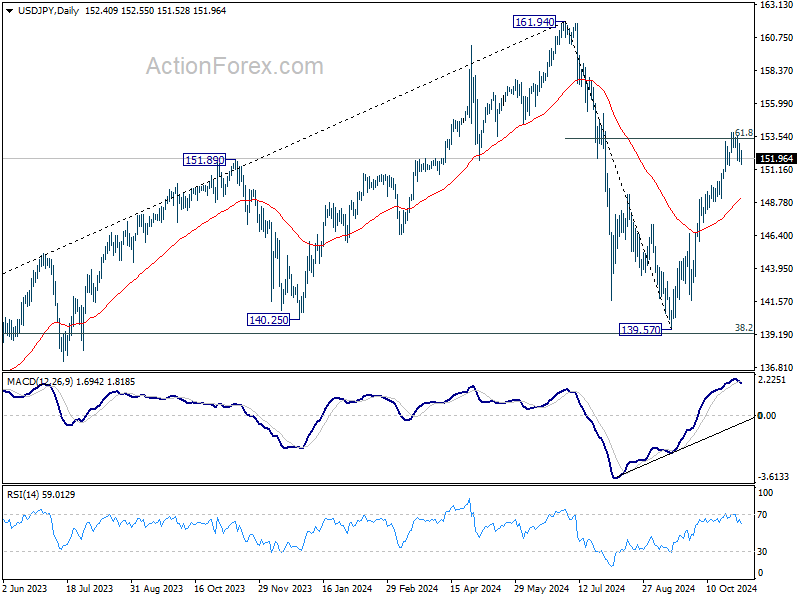
Daily Pivots: (S1) 152.12; (P) 152.61; (R1) 153.42; More...
Range trading continues in USD/JPYO and intraday bias stays neutral. Another rise is expected with 151.44 support intact. Sustained trading above of 61.8% retracement of 161.94 to 139.57 at 153.39 will pave the way to retest 161.94 high. However, considering bearish divergence condition in 4H MACD, firm break of 151.44 will indicate short term topping, and turn bias back to the downside for 55 D EMA (now at 149.07).
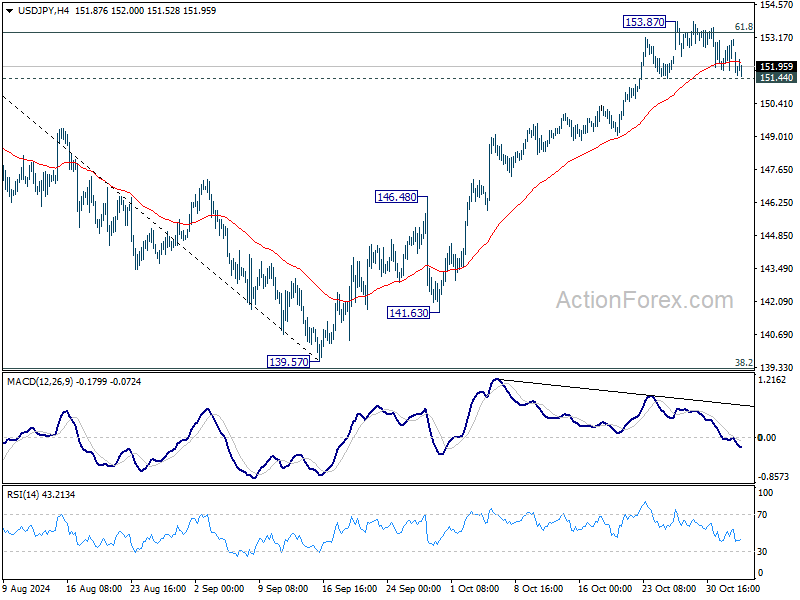
In the bigger picture, price actions from 161.94 are seen as a corrective pattern to rise from 102.58 (2021 low). The range of medium term consolidation should be set between 38.2% retracement of 102.58 to 161.94 at 139.26 and 161.94. Nevertheless, sustained break of 139.26 would open up deeper medium term decline to 61.8% retracement at 125.25.
USD/CHF Mid-Day Outlook
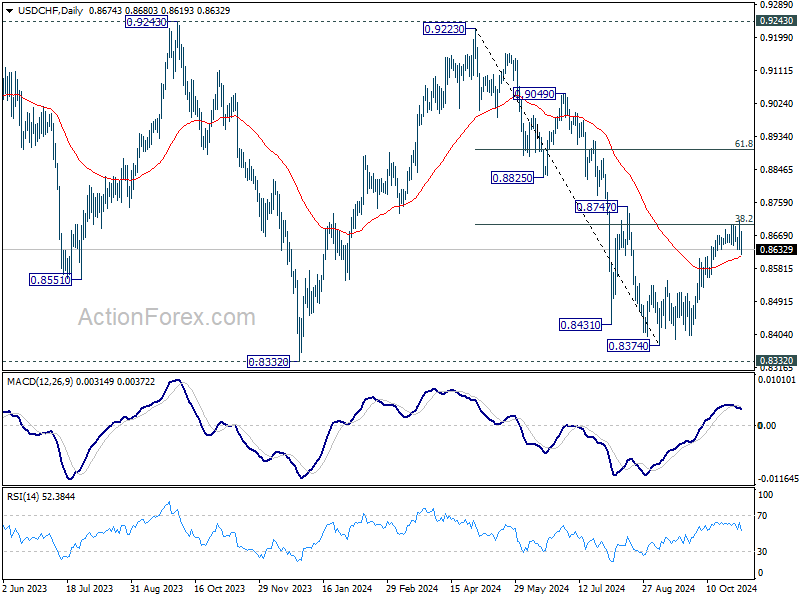
Daily Pivots: (S1) 0.8648; (P) 0.8679; (R1) 0.8730; More…
Break of 0.8631 support suggests short term topping at 0.8710, on bearish divergence condition in 4H MACD, after hitting 38.2% retracement of 0.9223 to 0.8374 at 0.8698. Intraday bias is back on the downside for 55 D EMA (now at 0.8613). On the upside, firm break of 0.8710 will resume the rebound from 0.8374.
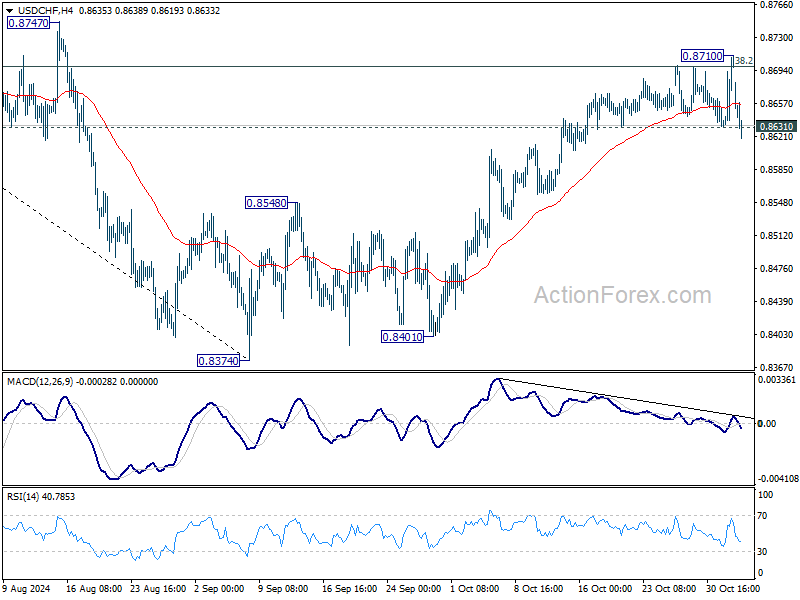
In the bigger picture, price actions from 0.8332 (2023 low) are currently seen as a medium term corrective pattern, with fall from 0.9223 as the second leg. Strong support could be seen from 0.8332 to bring rebound. Yet, overall outlook will continue to stay bearish as long as 0.9243 resistance holds. Firm break of 0.8332, however, will resume larger down trend from 1.0146 (2022 high).
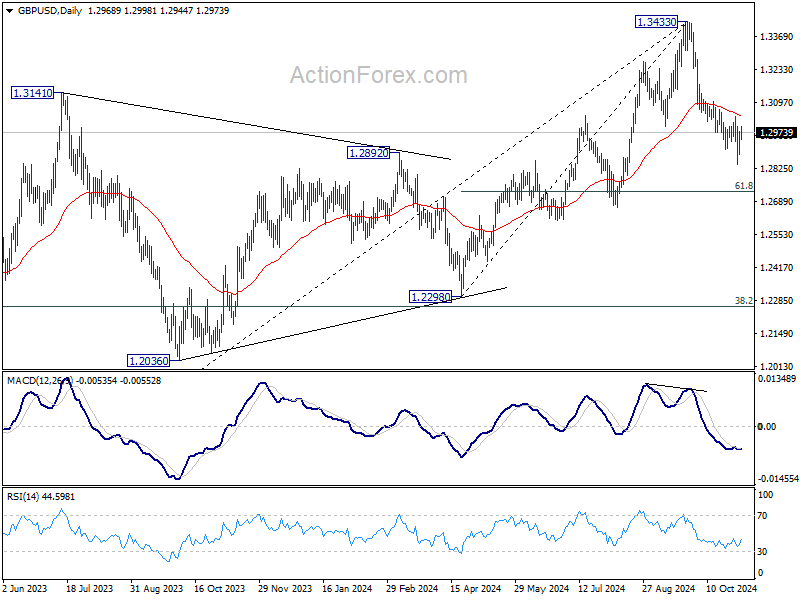
GBP/USD Mid-Day Outlook
Daily Pivots: (S1) 1.2875; (P) 1.2927; (R1) 1.2970; More...
Range trading continues in GBP/USD and intraday bias stays neutral. Further decline is expected as long as 1.3042 resistance holds. Below 1.2842 will resume the fall from 1.3433 to 61.8% retracement of 1.2298 to 1.3433 at 1.2732. However, considering bullish convergence condition in 4H MACD, firm break of 1.3042 will indicate short term bottoming, and turn bias back to the upside.
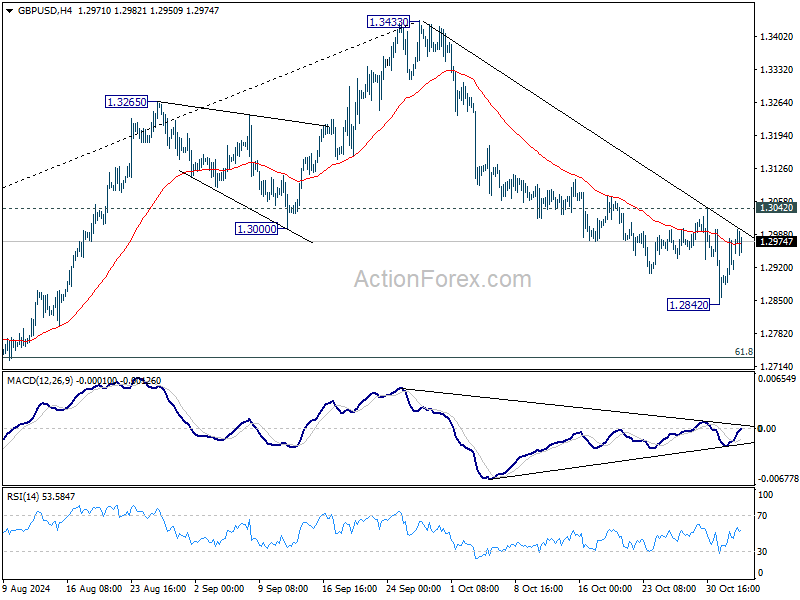
In the bigger picture, considering mildly bearish divergence condition in D MACD, a medium term top is likely in place at 1.3433 already. Price actions from there are seen as correction to whole up trend from 1.0351 (2022 low). Deeper decline would be seen to 38.2% retracement of 1.0351 to 1.3433 at 1.2256, which is close to 1.2298 structural support. Strong support should be seen there to bring rebound.
EUR/USD Mid-Day Outlook
Daily Pivots: (S1) 1.0809; (P) 1.0857; (R1) 1.0883; More...
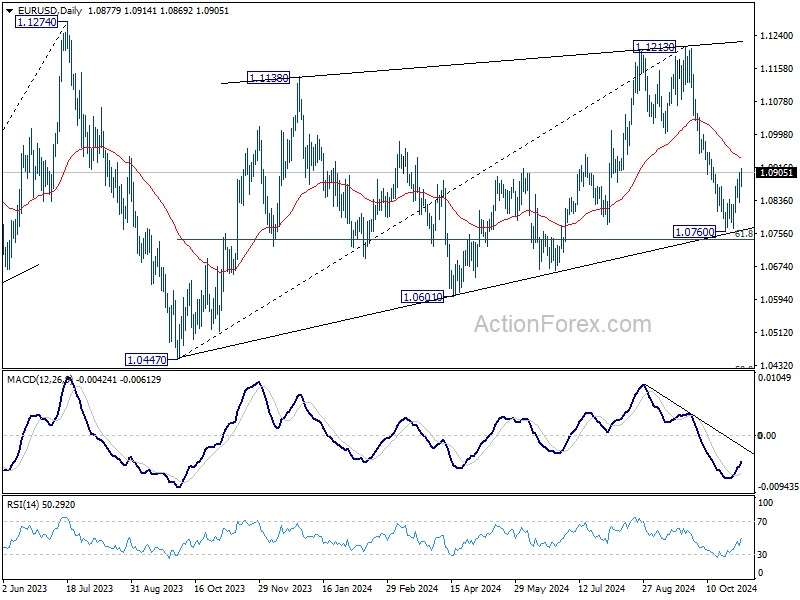
Intraday bias in EUR/USD is back on the upside as rebound from 1.0760 short term bottom resumed. Further rise would be seen to 55 D EMA (now at 1.0940). Strong resistance should be seen there to limit upside. On the downside, below 1.0831 minor support will bring retest of 1.0760 first, and then 61.8% retracement of 1.0447 to 1.1213 at 1.0740.
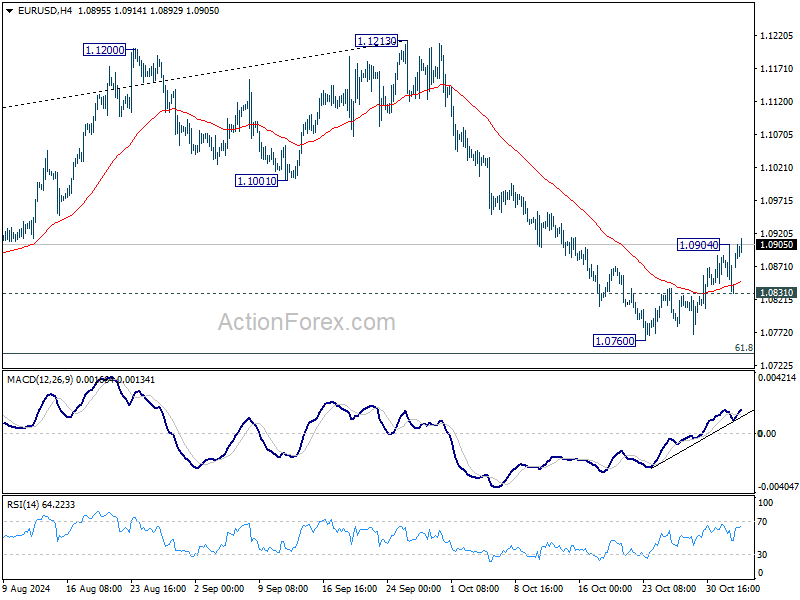
In the bigger picture, price actions from 1.1274 (2023 high) are seen as a consolidation pattern to up trend from 0.9534 (2022 low), with fall from 1.1213 as the third leg. Downside should be contained by 50% retracement of 0.9534 (2022 low) to 1.1274 at 1.0404, to bring up trend resumption at a later stage.