Sample Category Title
EUR/USD Bears Eye Control: Is the Downtrend Set to Continue?
Key Highlights
- EUR/USD struggled to recover above the 1.0900 resistance zone.
- A connecting trend line is forming with resistance at 1.0900 on the 4-hour chart.
- GBP/USD is signaling a bearish bias below the 1.3050 resistance.
- Gold corrected gains and traded below $2,750.
EUR/USD Technical Analysis
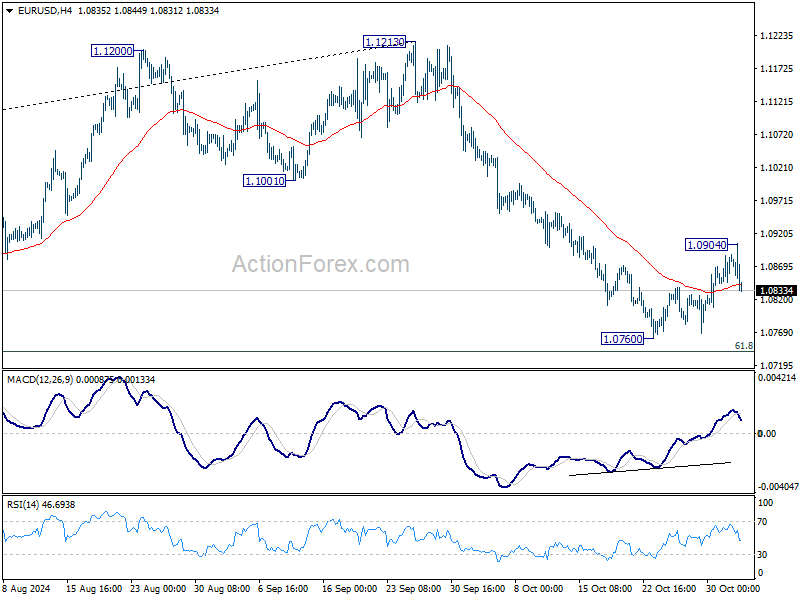
The Euro started an upside correction above the 1.0820 level against the US Dollar. EUR/USD even climbed above 1.0880 but failed near 1.0900.
Looking at the 4-hour chart, the pair traded above the 23.6% Fib retracement level of the downward move from the 1.1208 swing high to the 1.0761 low. However, the bears were active near 1.0900 and the pair remained well below the 100 simple moving average (red, 4-hour) and the 200 simple moving average (green, 4-hour).
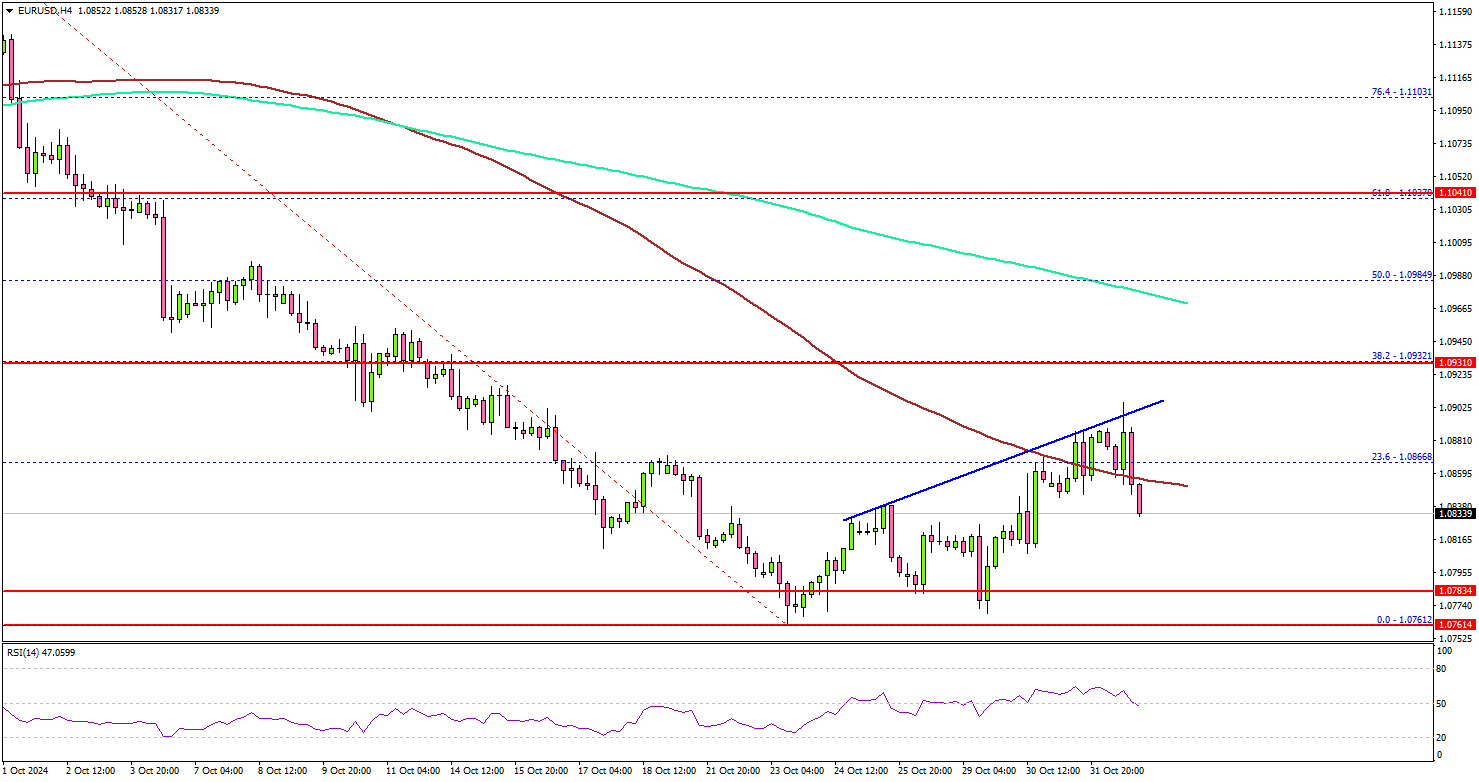
The pair is again declining and trading below 1.0880. On the downside, immediate support sits near the 1.0780 level. The next key support sits near the 1.0760 level.
Any more losses could send the pair toward the 1.0720 level. On the upside, the pair could face resistance near the 1.0900 level. The first key resistance is near the 1.0920 level. A close above the 1.0920 level could set the tone for another increase.
The next major resistance could be 1.0950, above which the price could accelerate higher toward the 1.0980 resistance.
Looking at Gold, the price started a downside correction after trading to a new all-time high and traded below $2,740.
Upcoming Economic Events:
- Euro Zone Manufacturing PMI for Oct 2024 – Forecast 45.9, versus 45.9 previous.
- German Manufacturing PMI for Oct 2024 – Forecast 42.6, versus 42.6 previous.
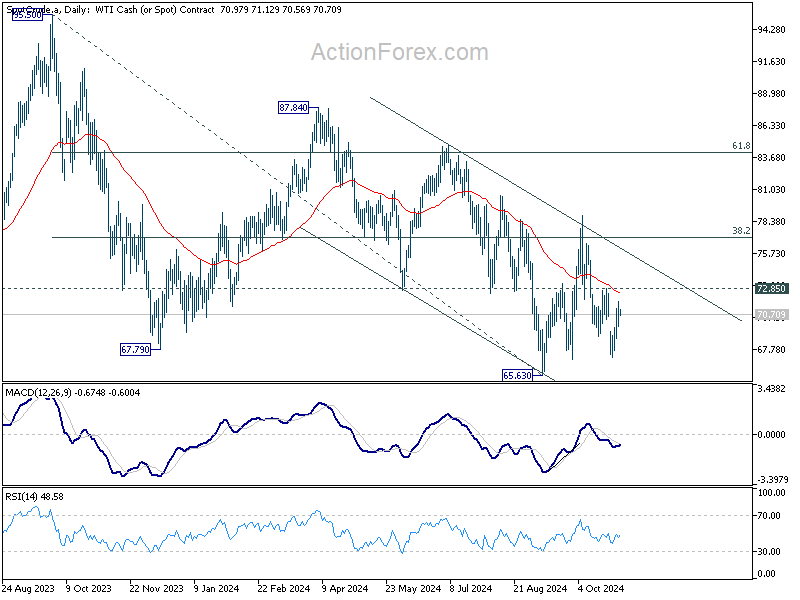
Oil prices edge up as OPEC+ delays output increase
Oil prices saw a modest uptick during the Asian session following OPEC+’s announcement to delay a planned increase in oil production of 2.2 million barrels per day by one month. On Sunday, the group also reiterated the members' "collective commitment to achieve full conformity" with the established output targets.
This adjustment comes as part of OPEC+’s broader strategy, which agreed in June, to gradually restore output in controlled monthly increments after significant cuts over the past two years. Before Sunday’s decision, the plan was to start unwinding the 2.2 million bpd cut beginning December 2024, with further increases scheduled into the next year.
Technically, for the near term, considering bullish convergence condition in 4H MACD, WTI could have formed a short term bottom at 67.14. Break of 72.85 resistance will support this case and bring stronger rally back towards 78.87 resistance, as part of the sideway pattern from 65.63 low.
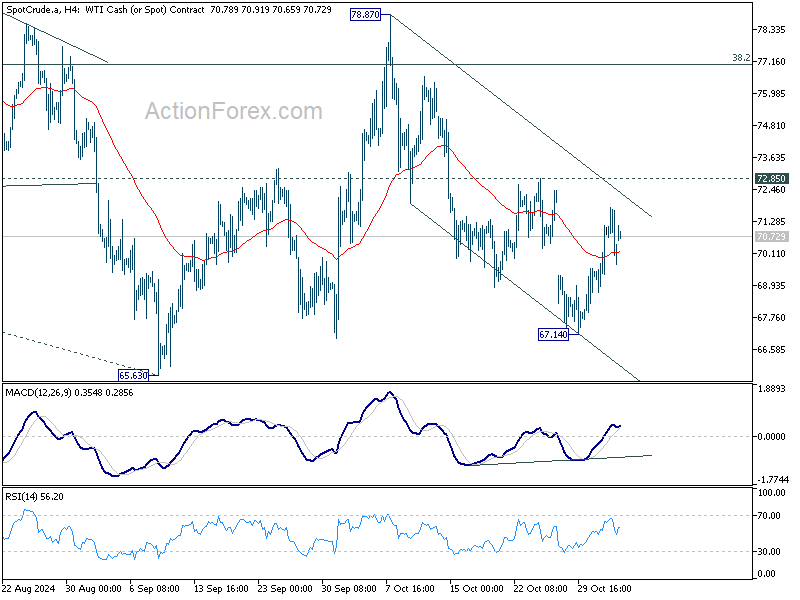
Nevertheless, there is no clear sign that the down trend from 87.84 has completed. As long as 78.87 resistance holds, another fall through 65.63 is still in favor after the consolidation pattern from there completes.
RBNZ flags geopolitical risks as key threat to New Zealand’s financial stability
RBNZ highlighted significant geopolitical risks as a major concern for New Zealand’s financial stability in a pre-release of findings from its upcoming Financial Stability Report. Key threats stem from global tensions involving Russia, China, and the Middle East, which RBNZ may incorporate into next year’s solvency stress test.
RBNZ noted that in some scenarios, “global supply chains were disrupted,” triggering renewed inflationary pressures and elevated interest rates. The report mentions a “more extreme scenario” involving a conflict in the Asia-Pacific region with one or more of New Zealand’s key trading partners. This may allude to risks of a major disruption if China attempts to assert territorial claims in the South China Sea or to use force in the Taiwan Strait.
Kerry Watt, RBNZ’s Director of Financial Stability Assessment & Strategy, commented on the increased “concern about geopolitical tension,” emphasizing that “as a small open economy, dependent on international trade and investment, geopolitical risks are clearly relevant to our financial system. Their potential impacts cannot be underestimated."
Dollar Dominance Temporarily Halts Pre-Election, Upside Potential Remains
Dollar, which has dominated currency markets in recent weeks, finally eased back last week. But this retreat does not necessarily indicate a reversal of its upward momentum. Instead, the greenback appears to be taking a breather ahead of the impending US presidential election. Closing as the second strongest performer among major currencies, Dollar still has potential for further gains, if Treasury yields extends their rally and if post-election developments stir risk aversion.
Euro edged out the greenback to become the strongest currency last week, buoyed by robust economic data from the Eurozone that killed the case for aggressive monetary easing by ECB. However, Euro's late-week softness against both Dollar and Sterling, raises questions about the sustainability of its rally. New Zealand Dollar also performed well, ending the week as the third strongest currency.
At the weaker end, Australian Dollar struggled at the bottom as disinflation progress finally cracked open the door for RBA rate cuts next year. Japanese Yen was the second weakest, continuing its divergence from Japanese stock markets. Canadian dollar ranked third among the weakest currencies.
Sterling endured a volatile week, swinging between losses and gains, and ultimately settled in the middle. Meanwhile, Swiss Franc managed to hold its ground in the middle too, despite sell off on weaker inflation data, with some market support likely stemming from its status as a safe-haven currency amid ongoing global tensions.
Yields Stay Strong, Stocks Gap Down, Dollar Resilient
The highly anticipated October non-farm payroll report had only a fleeting impact on U.S. financial markets. On the one hand, traders largely overlooked the disappointing headline job growth, recognizing that the figures were heavily distorted by hurricanes and strikes. On the other hand, With the US presidential election and FOMC rate decision imminent, stocks investors and currency traders were cautious about taking substantial positions.
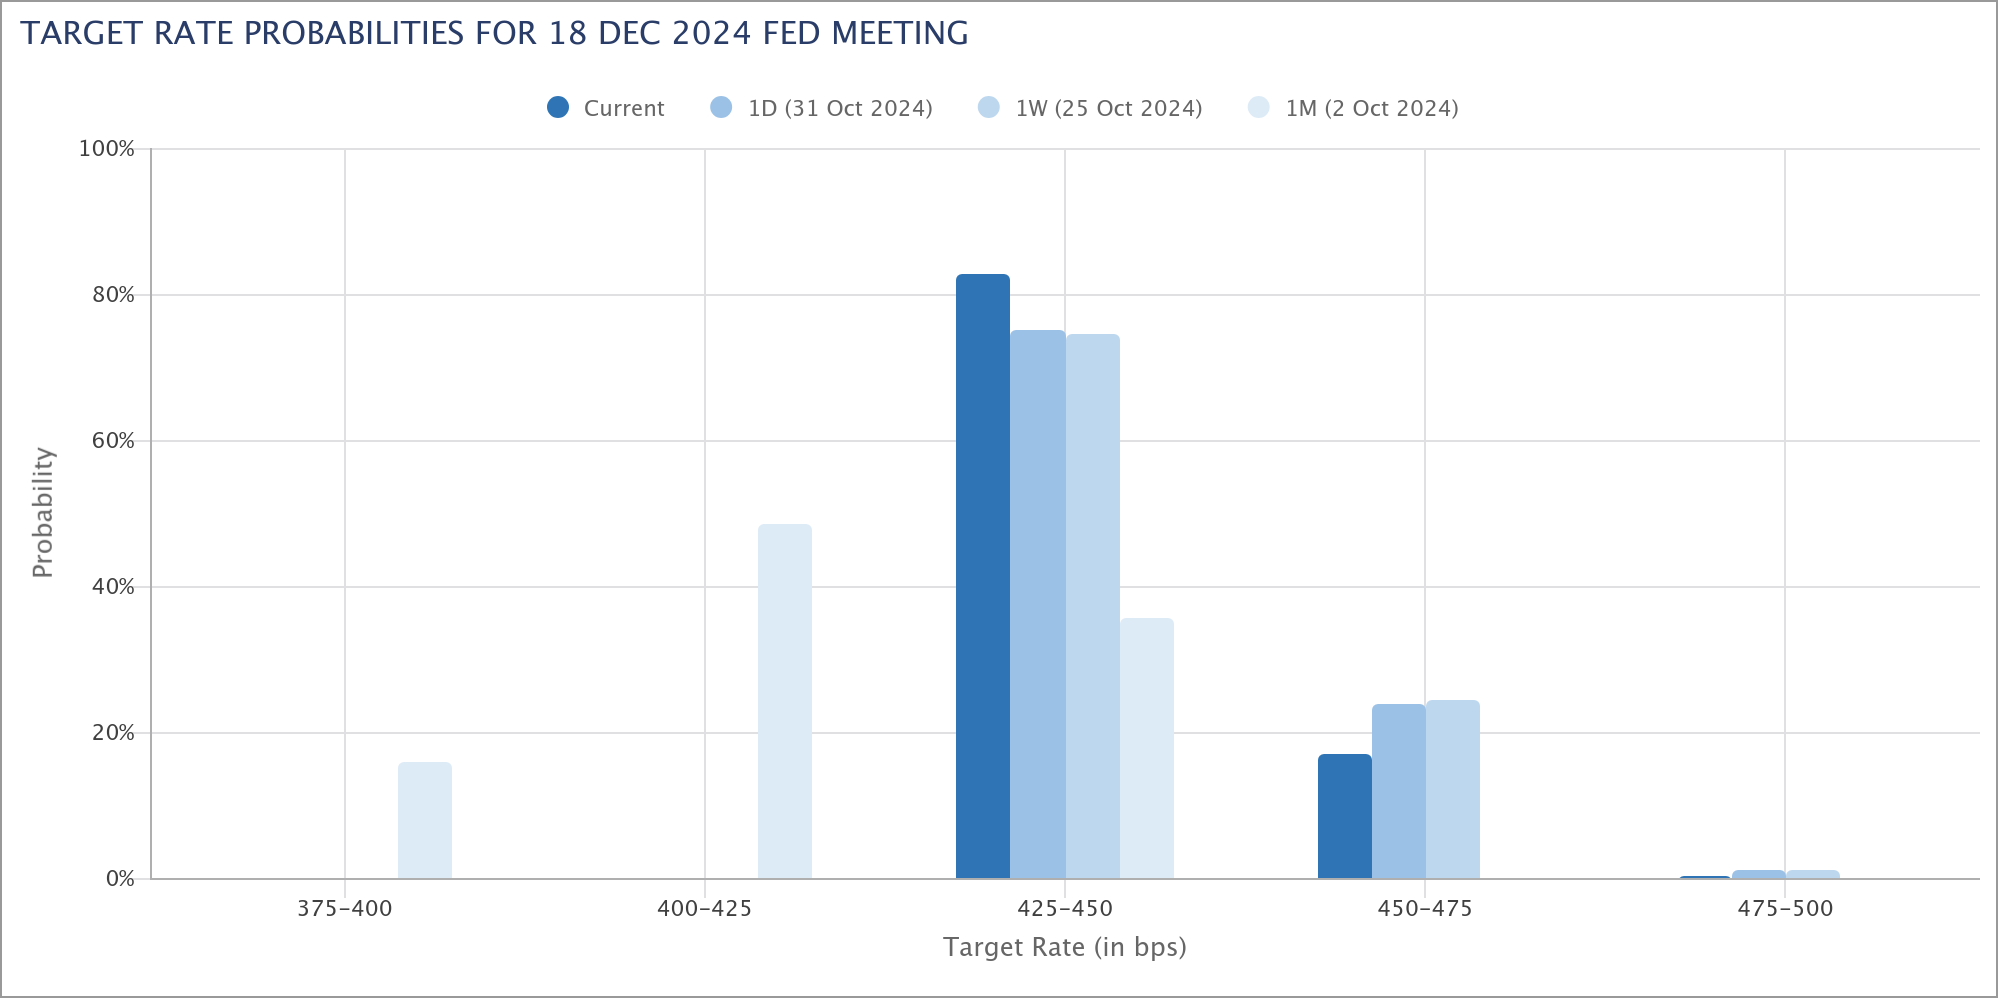
Market expectations for Fed's policy easing remained largely unchanged after the slew of data last week. Fed funds futures indicate a 98.9% probability of a 25 bps rate cut to 4.50-4.75% at the November 7 meeting. The chance of an additional 25 bps cut to 4.25-4.50% stands at 82.7%, slightly higher than the 74.6% probability a week ago.
Two key developments warrant close attention, though. First, the persistent strength in Treasury yields continues unabated. Despite an initial dip following the non-farm payroll data, 10-year yield rebounded swiftly, closing the week on a strong note. Bond traders seem confident that expansive fiscal policies, regardless of the presidential election outcome, will drive yields higher.
Second, the mid-week selloff in US equities presents a technically concerning picture. The declines in major indices like the S&P 500 and NASDAQ raise questions about whether this is merely pre-election jitters or the beginning of a more sustained reversal.
Technically, near term outlook in 10-year yield will stay bullish as long as 4.178 support holds. Rise from 3.603 is in progress to 61.8% retracement of 4.997 to 3.603 at 4.464. Decisive break there will solidify the case that fall from 4.997 has completed as a corrective three-wave move to 3.603. Further rally should then be seen to 4.737 next.
While it's still premature to draw a conclusion, firm break of 4.737 resistance would raise the chance that 10-year yield is indeed resuming the whole up trend from 0.398 (2020 low). Next medium term target would then be 38.2% projection of 0.398 to 4.997 from 3.603 at 5.359.
After the gap down on Thursday and subsequent selloff, immediate focus in S&P 500 is now on 5669.67 resistance turned support. Considering bearish divergence condition in D MACD, firm break of 5669.67 and sustained trading below 55 D EMA (now at 5695.63) will confirm medium term topping. Deeper fall would then be seen to channel support at around 5465, even as a correction rather then reversal.
The same gap down on Thursday in NASDAQ was seen as the first sign of rejection by 18671.06 high. Firm break of 17767.79 will argue that rise from 15708.53 has completed as the second leg of the corrective pattern from 18671.06. The third leg would have then commenced back toward 15708.53 support.
It looked like Dollar was ready for a sizeable pullback last week after the huge job growth miss. Yet, the greenback managed to rebound from initial post-NFP dip, taken up by strong bounce in 10-year yield, and closed the week as the second best performer of the week.
With 23.6% retracement of 100.15 to 104.63 at 103.57 in Dollar Index intact, consolidations from 104.63 should be relatively brief. Break of 104.63 will resume the rally from 100.15 to 106.13 resistance.
It's still early to tell if Dollar Index is reversing the whole fall from 114.77 (2022 high). But break of 106.13.107.34 resistance is possible if 10-year yield extends its march towards 5% while stocks are in extended corrective decline.
Euro Rises, Swiss Franc Slips, Sterling Takes a Wild Ride
In Europe, Euro showed much resilience with bolstered by economic data that support measured rate cut by ECB. Swiss Franc was pressured as declining inflation opens the door for further monetary easing by SNB. In the UK, fiscal policy concerns caused huge volatility in Sterling.
For the Eurozone, Q3 GDP exceeded expectations, and Germany narrowly sidestepped a technical recession. Additionally, October CPI came in higher than anticipated, with headline inflation rebounding and core and services inflation holding firm. This data supports a measured stance from the ECB on policy easing, with no immediate pressure to increase the pace with a 50 basis point rate cut in December. The hawkish members of ECB are likely to maintain their influence, keeping dovish policymakers in the minority.
In Switzerland, however, CPI fell more than forecast in October, slipping to 0.6%—its lowest level since July 2021 and below the midpoint of SNB target range of 0-2% for the second consecutive month. Discussions are now centered on whether SNB will opt for a larger 50 bps reduction in December or adopt a more gradual approach with two 25 bps cuts in December and March. There is also growing speculation that SNB could eventually reintroduce negative interest rates if safe-haven flows into Swiss Franc intensify on escalating global geopolitical tensions and conflicts.
In the UK, Pound has experienced high volatility after the Labour government’s budget announcement. Markets reacted negatively, with criticism focusing on the budget’s emphasis on increased spending, tax hikes, and borrowing, while offering limited impact on economic growth. Pound initially sold off sharply, but a late strong rebound suggested that the market reaction may have been exaggerated. It's possible that some institutional investors attempted, unsuccessfully, to trigger a more pronounced decline similar to the one observed after former Prime Minister Liz Truss's mini-budget two years ago, which led to a steep fall in sterling.
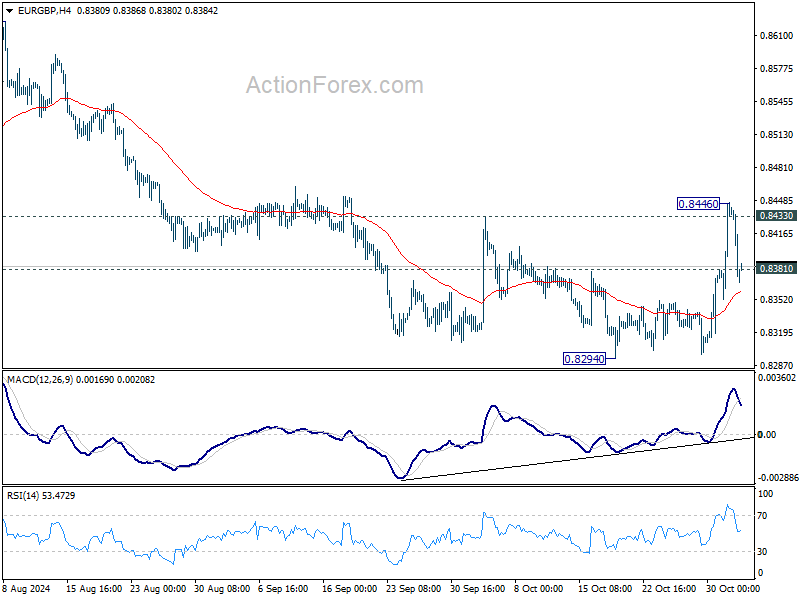
While EUR/GBP's rebound from 0.8294 was strong, the cross failed to sustain above 0.8433 resistance and reversed after hitting 0.8446. The break of 0.8381 minor support argues that the rebound might be over, and range trading would continue in the near term. Outlook stays bearish for downside breakout through 0.8294 to resume the larger down trend at a later stage.
GBP/CHF spiked lower to 1.1105 last week but drew support from 38.2% retracement of 1.0741 to 1.1368 at 1.1128 again and rebounded strongly. Near term outlook stay bullish for now, with focus back on 1.1318 resistance. Firm break there should argue that consolidation from 1.1368 has completed, and the rally from 1.0741 is ready to resume through 1.1368.

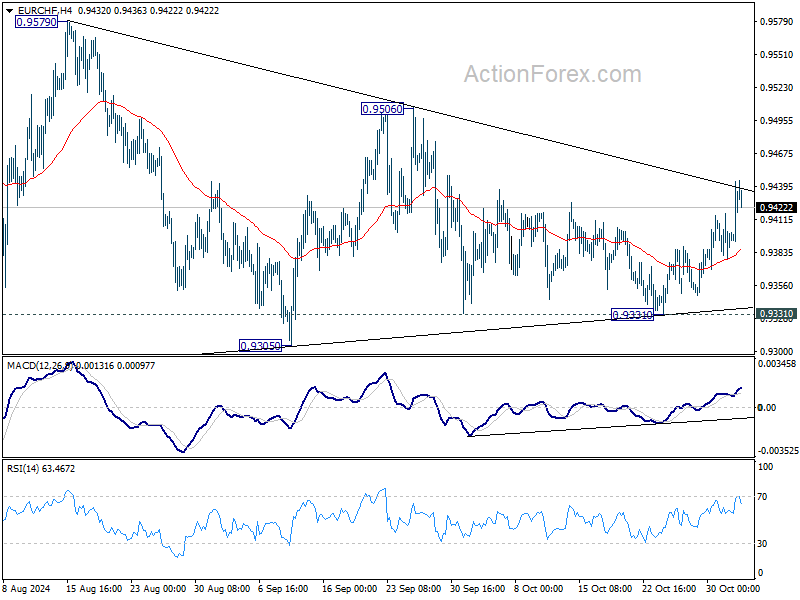
EUR/CHF extended the rebound from 0.9331 but failed to breakout from recent converging range. Outlook is mixed for now, as the near term picture suggests that rebound from 0.9209 would resume after consolidation from 0.9579 completes. But failure to do so will keep the medium term outlook bearish for at least a retest on 0.9209 low later.
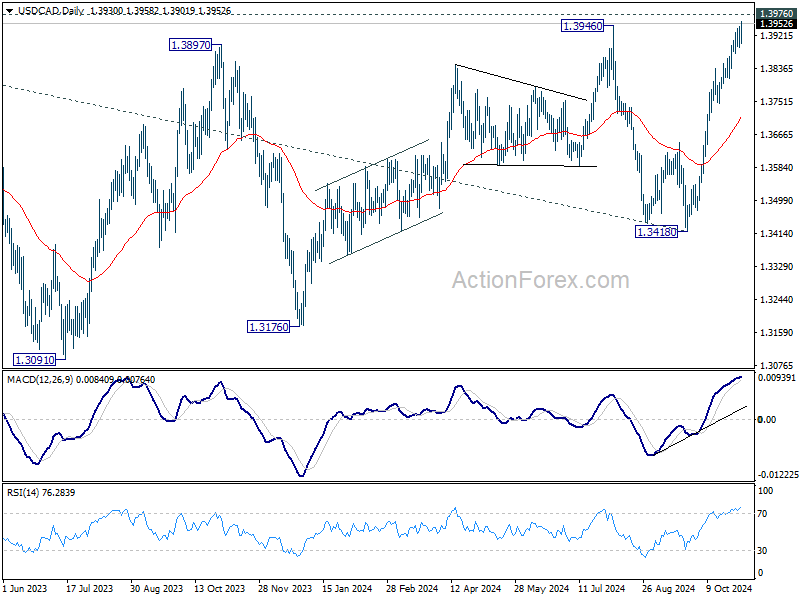
USD/CAD Weekly Outlook
USD/CAD's rally from 1.3418 continued last week and there is no clear sign of topping yet. Initial bias remains on the upside for 1.3976 resistance. Decisive break there will resume larger up trend. Nevertheless, considering bearish divergence condition in 4H MACD, break of 1.3890 minor support will indicate short term topping, and turn bias back to the downside for deeper pullback.
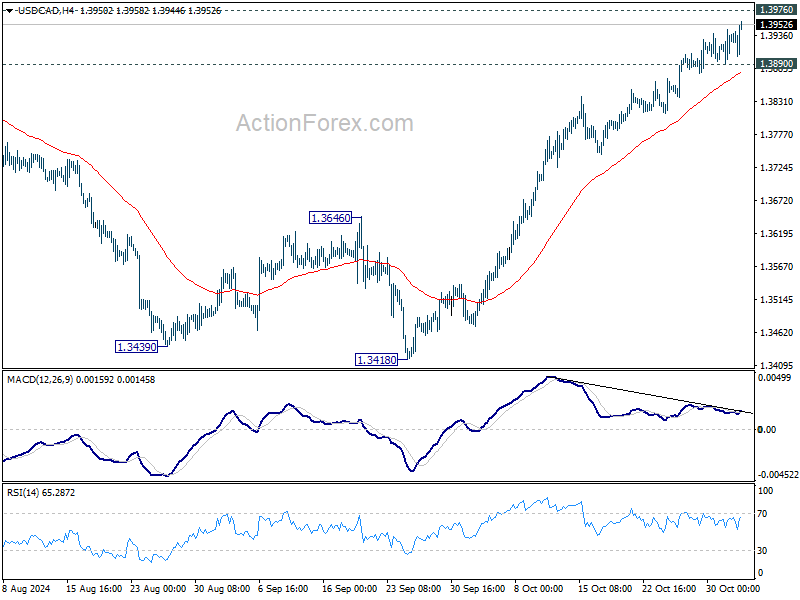
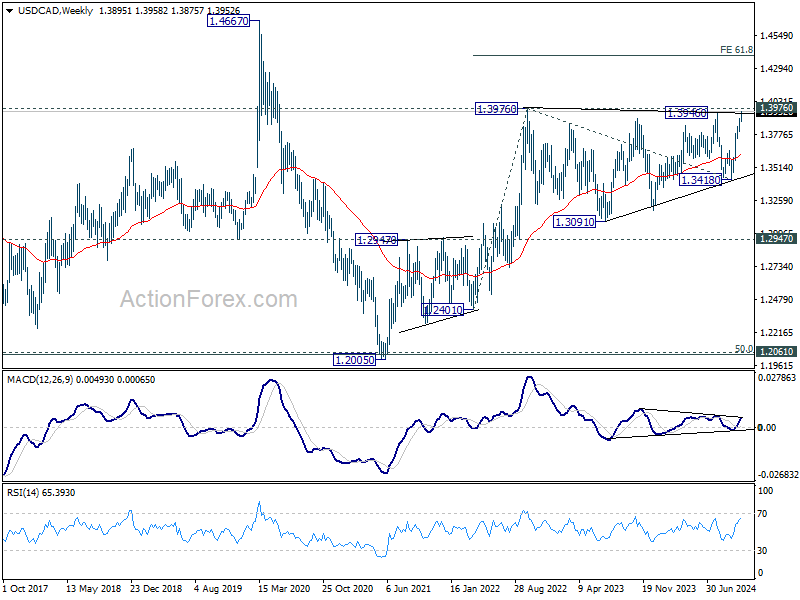
In the bigger picture, sideway consolidation pattern from 1.3976 (2022 high) might still extend further. While another decline cannot be ruled out, strong support should emerge above 1.2947 resistance turned support to bring rebound. Rise from 1.2005 (2021 low) is still in favor to resume at a later stage. Decisive break of 1.3976 will target 61.8% projection of 1.2401 to 1.3976 from 1.3418 at 1.4391.
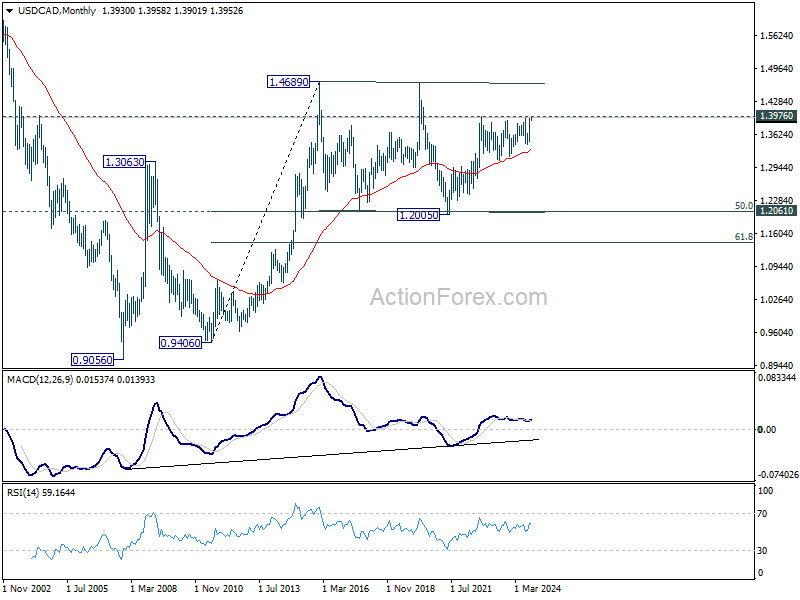
In the longer term picture, price actions from 1.4689 (2016 high) are seen as a consolidation pattern, which might have completed at 1.2005. That is, up trend from 0.9506 (2007 low) is expected to resume at a later stage. This will remain the favored case as long as 1.2947 resistance turned support holds.
EUR/USD Weekly Outlook
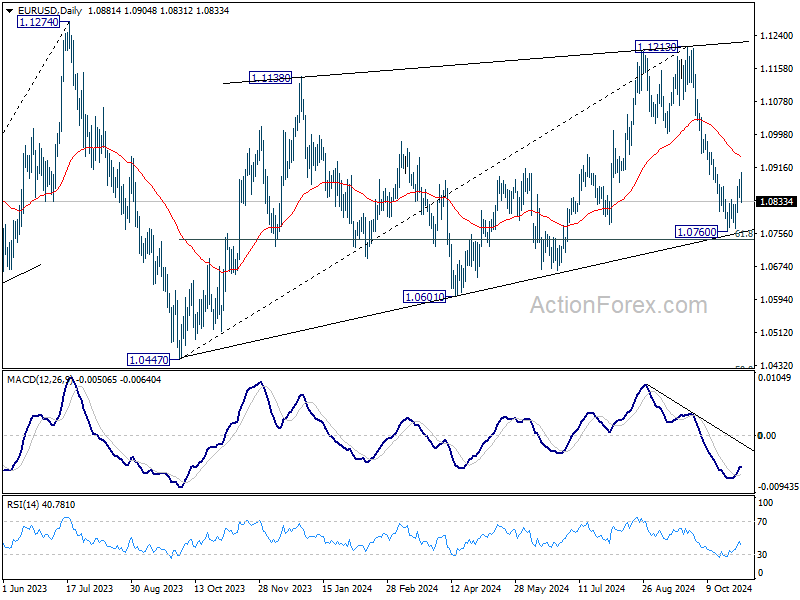
EUR/USD's recovery from 1.0760 short term bottom extended higher last week but retreated after hitting 1.0904. Initial bias is turned neutral this week first. More consolidation could be seen above 1.0760 and another rise cannot be ruled out. But upside should be limited by 55 D EMA (now at 1.0941). On the downside, sustained break of 61.8% retracement of 1.0447 to 1.1213 at 1.0740 will extend the fall from 1.1213 to 1.0601 support next.
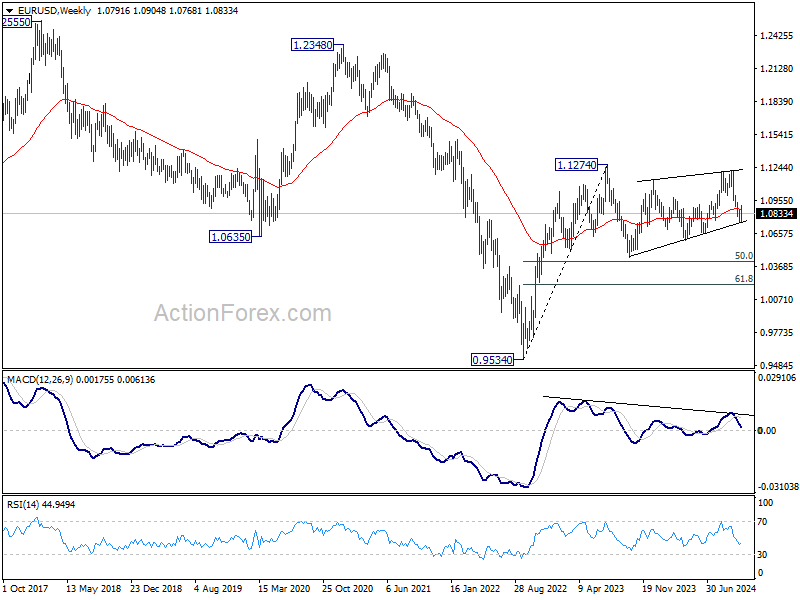
In the bigger picture, price actions from 1.1274 (2023 high) are seen as a consolidation pattern to up trend from 0.9534 (2022 low), with fall from 1.1213 as the third leg. Downside should be contained by 50% retracement of 0.9534 (2022 low) to 1.1274 at 1.0404, to bring up trend resumption at a later stage.
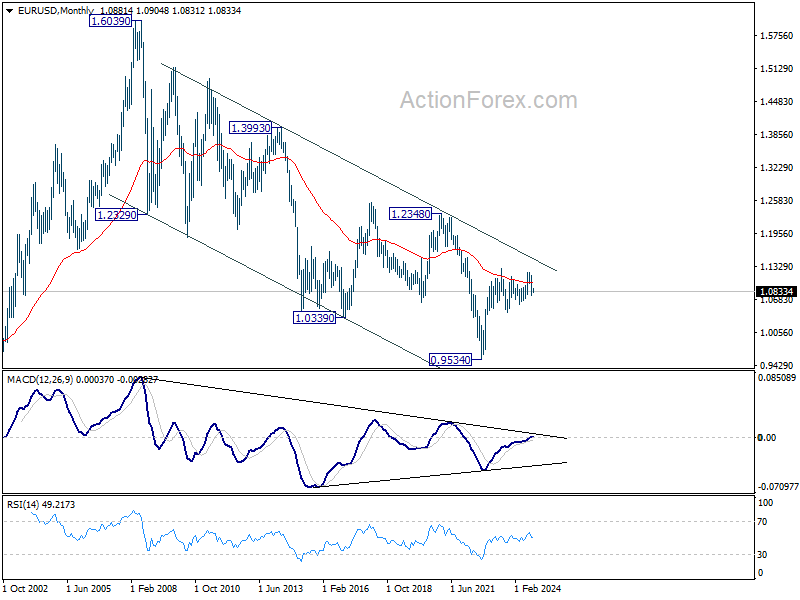
In the long term picture, a long term bottom is in place at 0.9534 (2022 low). But for now, EUR/USD is struggling to sustain above 55 M EMA (now at 1.1011). Outlook is neutral at best at this point.
USD/JPY Weekly Outlook
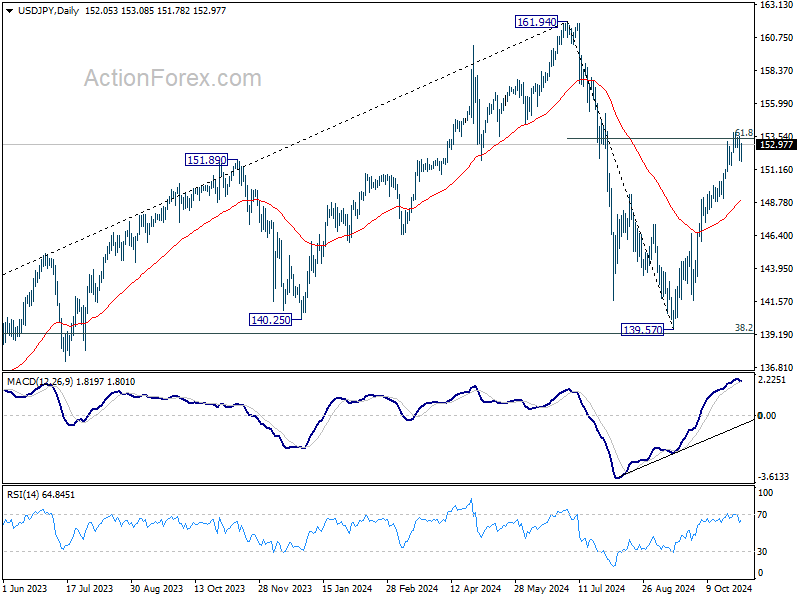
USD/JPY edged higher to 153.87 last week but failed to sustain above 61.8% retracement of 161.94 to 139.57 at 153.39 and retreated. Initial bias remains neutral this week for more consolidations. Further rally is expected as long as 55 D EMA (now at 148.96) holds. Sustained trading above 153.39 will pave the way to retest 161.94 high.
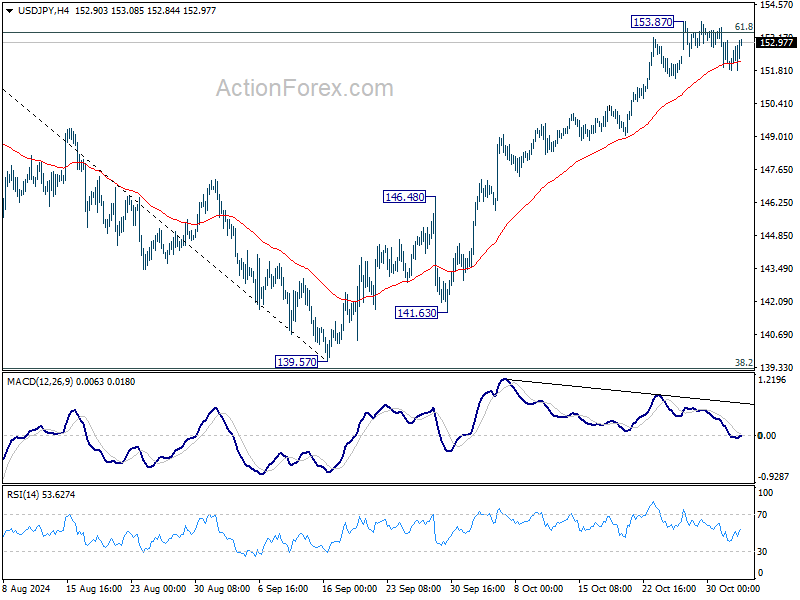
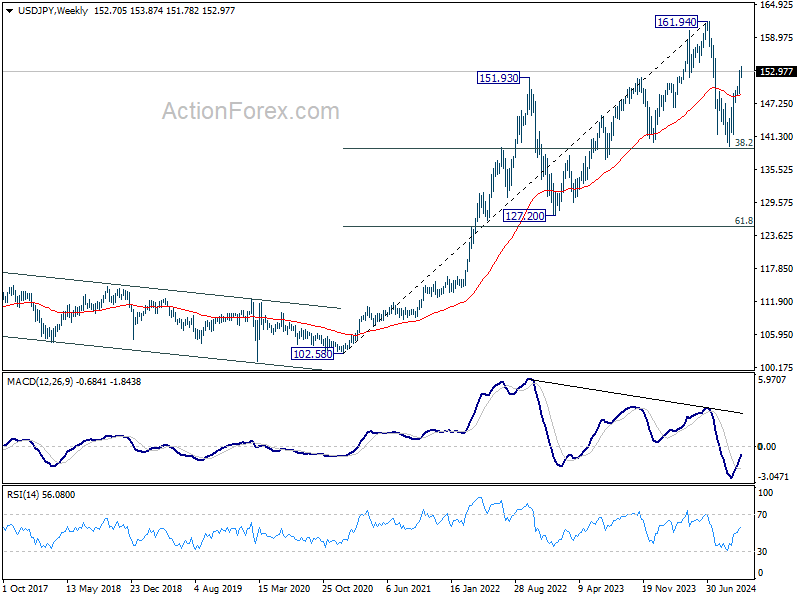
In the bigger picture, price actions from 161.94 are seen as a corrective pattern to rise from 102.58 (2021 low). The range of medium term consolidation should be set between 38.2% retracement of 102.58 to 161.94 at 139.26 and 161.94. Nevertheless, sustained break of 139.26 would open up deeper medium term decline to 61.8% retracement at 125.25.
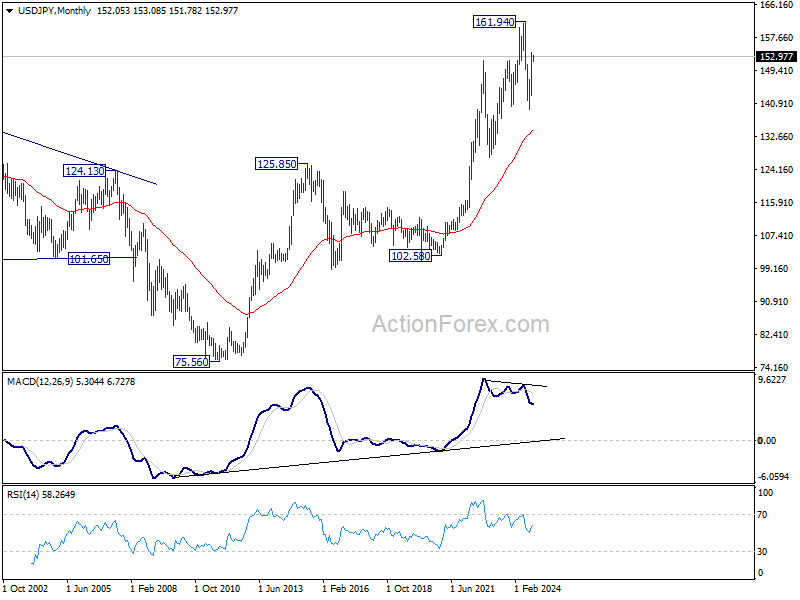
In the long term picture, it's still early to conclude that up trend from 75.56 (2011 low) has completed. However, a medium term corrective phase should have commenced, with risk of deep correction towards 55 M EMA (now at 134.54).
GBP/USD Weekly Outlook
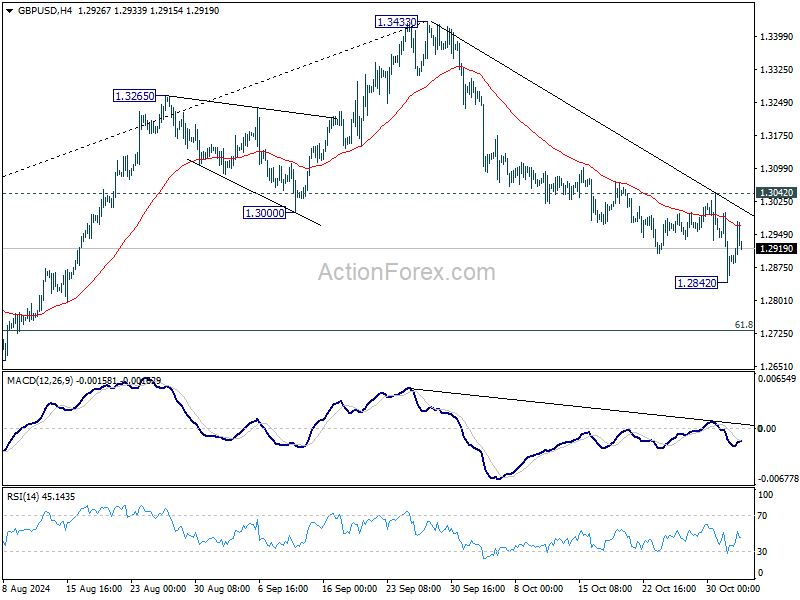
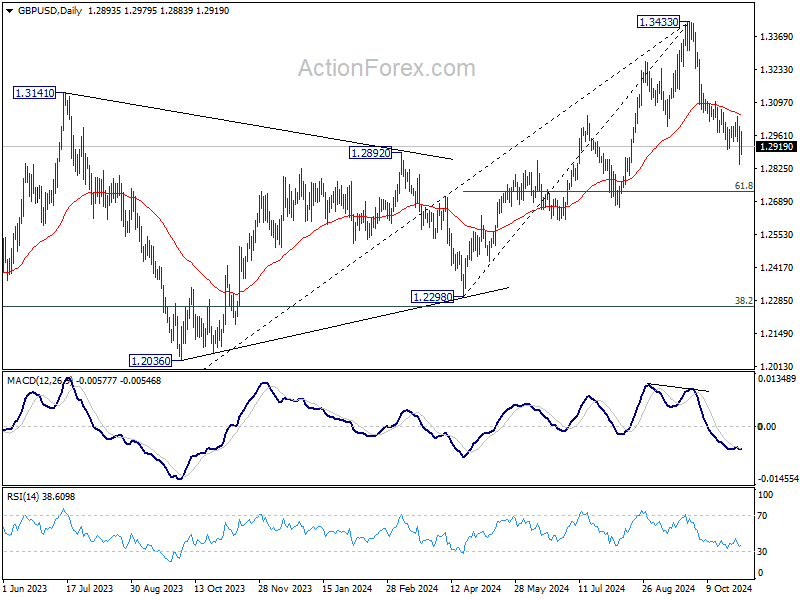
GBP/USD's decline from 1.3433 resumed last week and fell to 1.2842 before recovering. Initial bias is neutral this week for consolidations first. But further decline is expected as long as 1.3042 resistance holds. Below 1.2842 will target 61.8% retracement of 1.2298 to 1.3433 at 1.2732. However, firm break of 1.3042 will indicate short term bottoming, and turn bias back to the upside.
In the bigger picture, considering mild bearish divergence condition in D MACD, a medium term top is likely in place at 1.3433 already. Price actions from there are seen as correction to whole up trend from 1.0351 (2022 low). Deeper decline would be seen to 38.2% retracement of 1.0351 to 1.3433 at 1.2256, which is close to 1.2298 structural support. Strong support should be seen there to bring rebound.
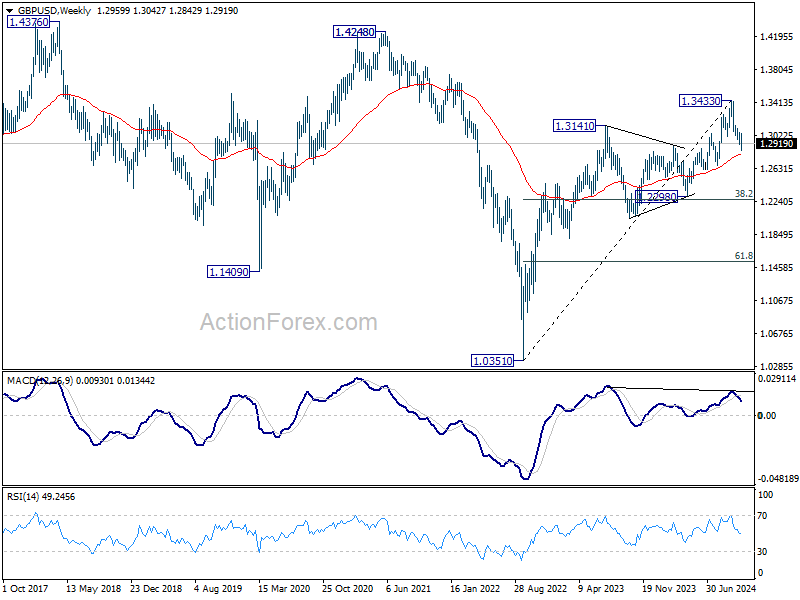
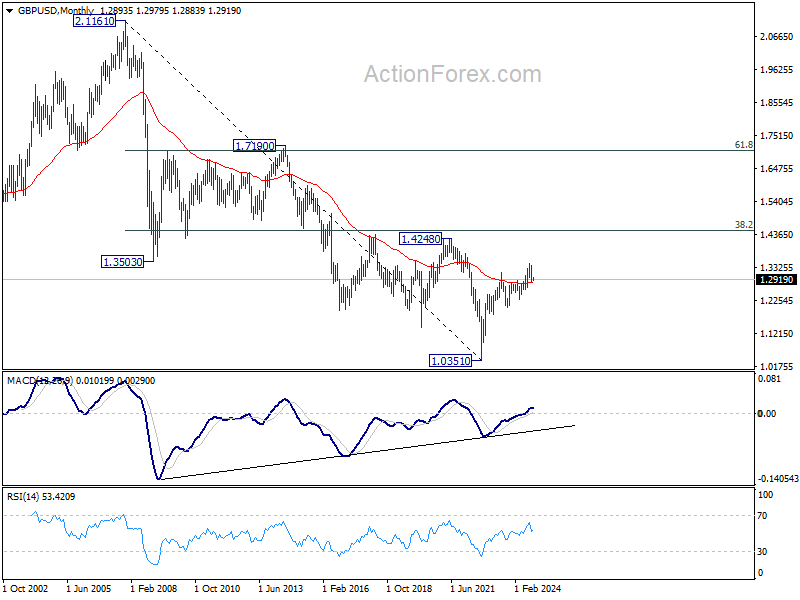
In the long term picture, as long as 1.2298 support holds, rise from 1.0351 long term bottom is expected to continue. The strong break of 55 M EMA (now at 1.2811) is a sign of bullish trend reversal. Yet, break of 1.4248 structural resistance is needed confirm. Otherwise, price actions from 1.0351 could just be part of a consolidation pattern.
USD/CHF Weekly Outlook
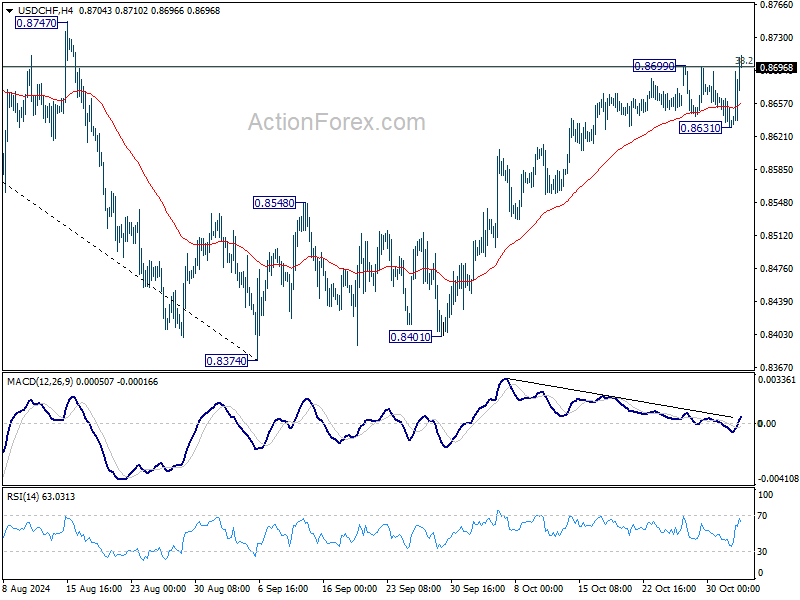
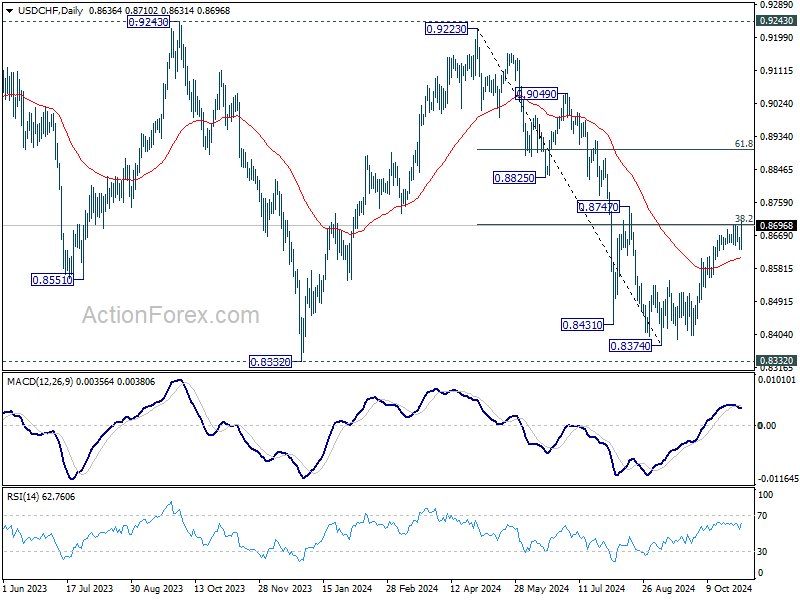
USD/CHF's rally from 0.8374 extended to 0.8699 last week and retreated from there. But late break of 0.8699 indicates that the rise is resuming. Initial bias is now on the upside this week. Sustained trading above 38.2% retracement of 0.9223 to 0.8374 at 0.8698 will argue that fall from 0.9223 has completed after defending 0.8332 low. Further rally should then be seen to 61.8% retracement at 0.8899 next. On the downside, below 0.8631 support will turn intraday bias neutral again.
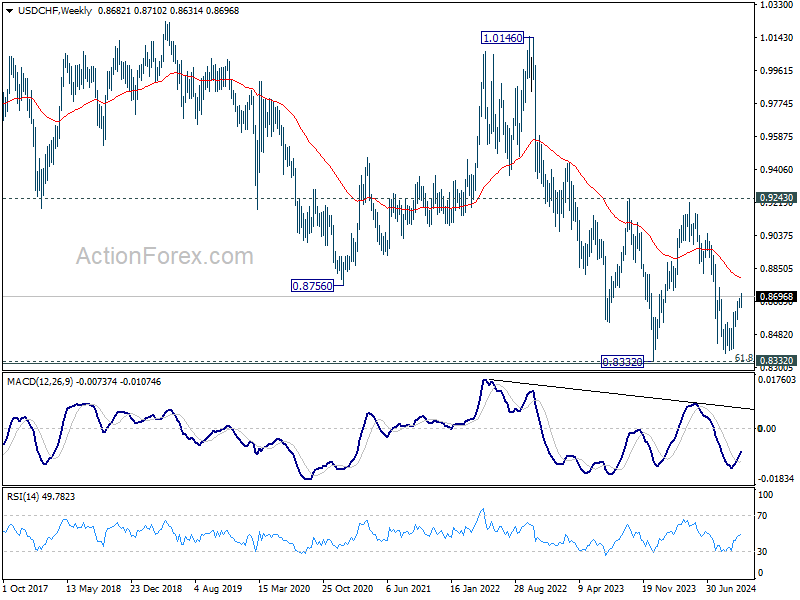
In the bigger picture, price actions from 0.8332 (2023 low) are currently seen as a medium term corrective pattern, with fall from 0.9223 as the second leg. Strong support could be seen from 0.8332 to bring rebound. Yet, overall outlook will continue to stay bearish as long as 0.9243 resistance holds. Firm break of 0.8332, however, will resume larger down trend from 1.0146 (2022 high).
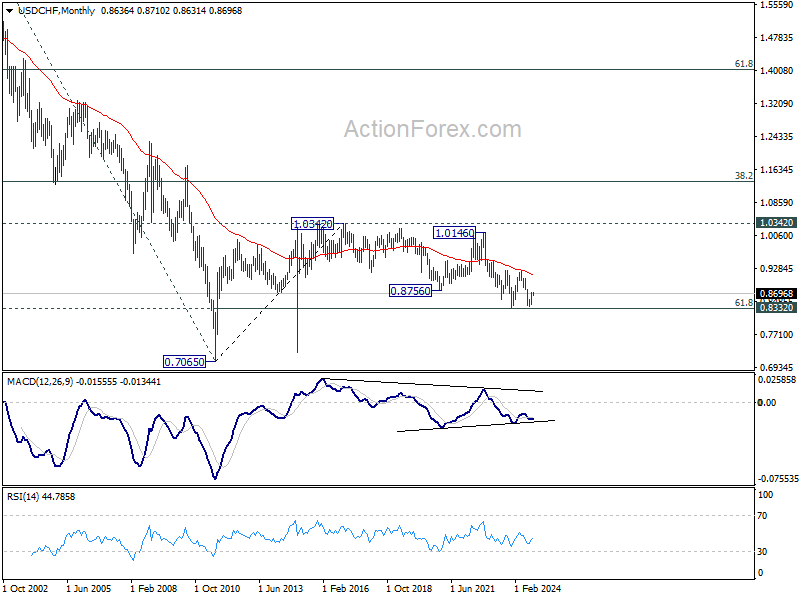
In the long term picture, price action from 0.7065 (2011 low ) are seen as a corrective pattern to the multi-decade down trend from 1.8305 (2000 high). Fall from 1.0342 (2016 high) is seen as the second leg. Rejection by 55 M EMA suggest that this fall is in progress. Break of 61.8% retracement of 0.7065 to 1.0342 at 0.8317 will pave the way back to 0.7065.
AUD/USD Weekly Report
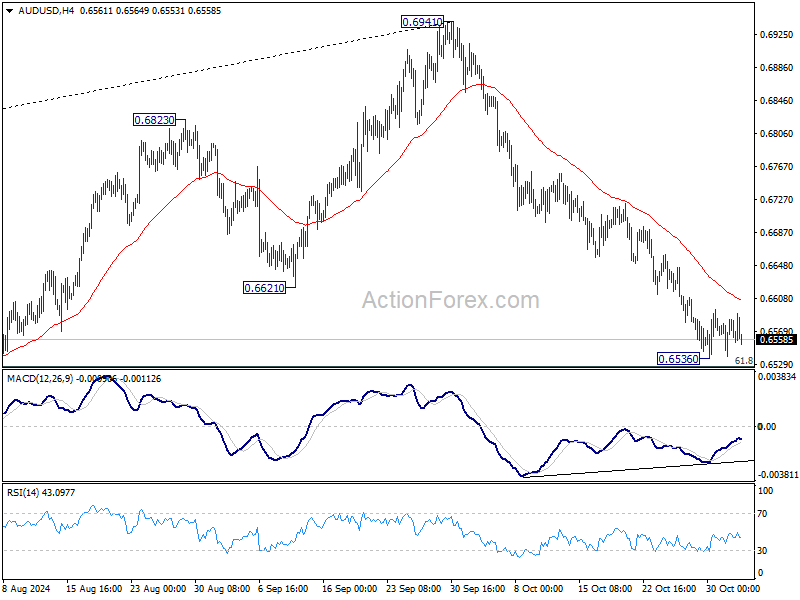
AUD/USD's fall from 0.6941 continued last week but formed a temporary low at 0.6536, ahead of 61.8% retracement of 0.6269 to 0.6941 at 0.6526. Initial bias remains neutral this week for consolidations first. Further decline is expected as long as 55 D EMA (now at 0.6700) holds. On the downside, sustained break of 0.6526 will target 0.6348 support next.
In the bigger picture, rise from 0.6269 (2023 low) should have completed with three waves up to 0.6941. Corrective pattern from 0.6169 (2022 low) is now extending with another falling leg. Deeper decline would be seen back to 0.6269 as sideway trading extends.
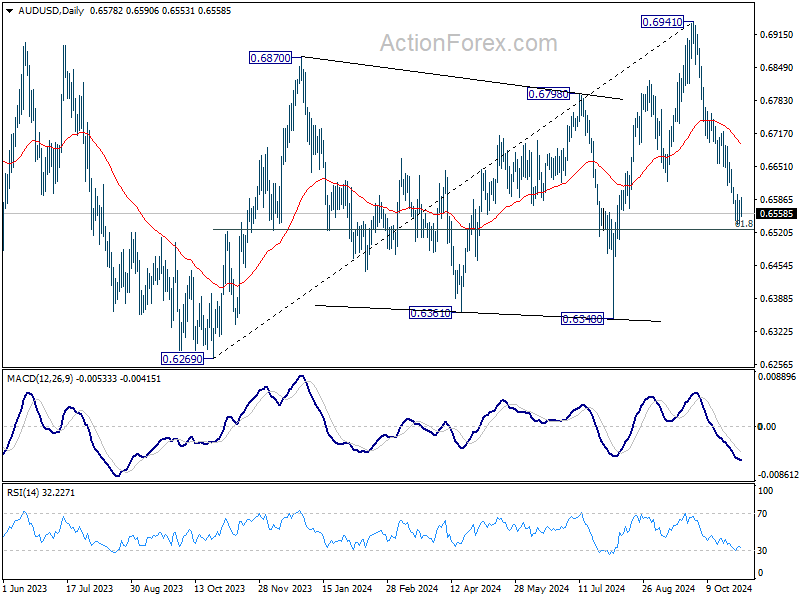
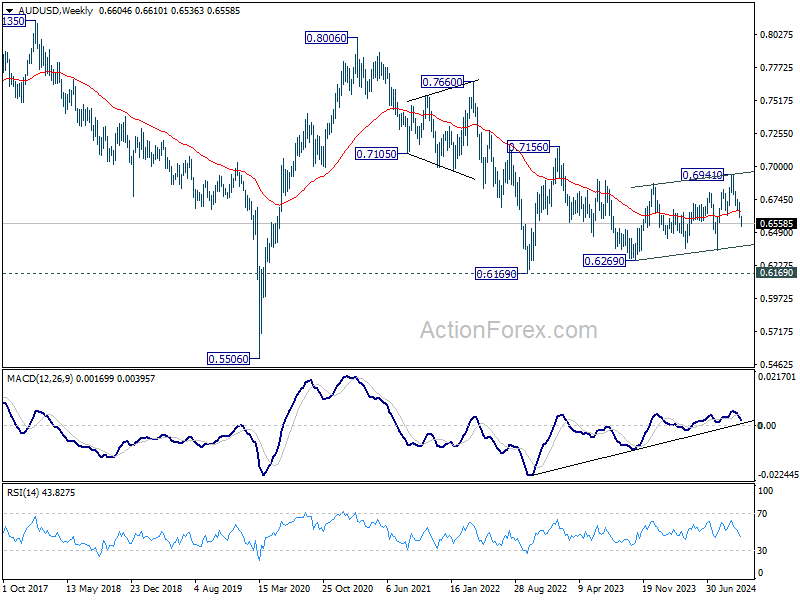
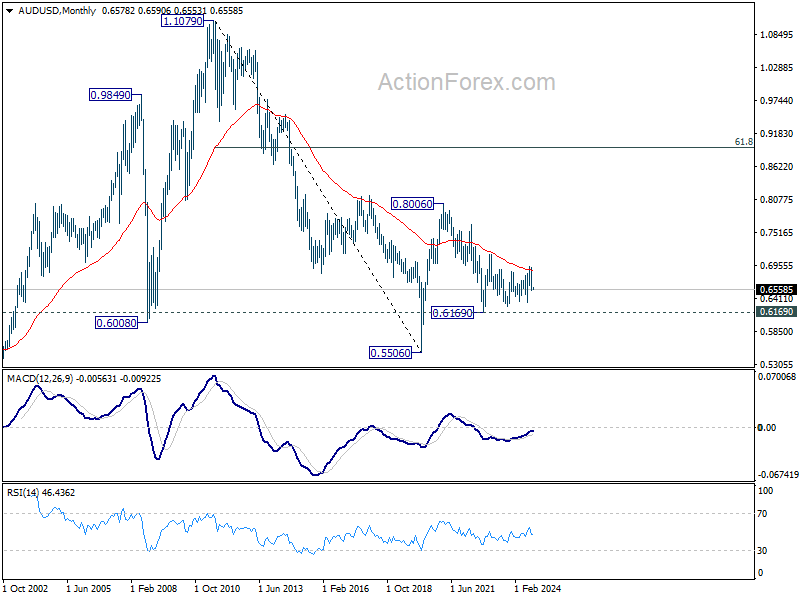
In the long term picture, the down trend from 1.1079 (2011 high) should have completed at 0.5506 (2020 low) already. It's unsure yet whether price actions from 0.5506 are developing into a corrective pattern, or trend reversal. But in either case, fall from 0.8006 is seen as the second leg of the pattern. Firm of 0.7156 resistance will argue that the third leg has already started towards 0.8006.