
Sample Category Title
Dollar Struggles as Safe Havens Strengthen Ahead of US Election; RBA Holds Key Focus Tomorrow
Dollar remains the weakest currency in the lead-up to the US presidential election, though its downside appears contained as early selling momentum in Asia has not extended into European session. Safe-haven currencies, led by the Swiss Franc and Yen, are gaining as US and European Treasury yields retreat. Among other currencies, Sterling and Loonie are also lagging behind, although overall market indecisiveness keeps most major pairs within Friday’s trading range.
While the US election remains the primary focus, attention is also turning to RBA’s rate decision in the upcoming Asian session. The central bank is widely expected to hold rates at 4.35%, with virtually no expectation for any surprises. Market participants will be watching closely for any changes in RBA’s language that might hint at future policy easing, particularly any shift from the “not ruling anything in or out ” stance, which could set a clearer tone for policy easing in 2025. The release of new economic projections will also be key in gauging RBA’s outlook.
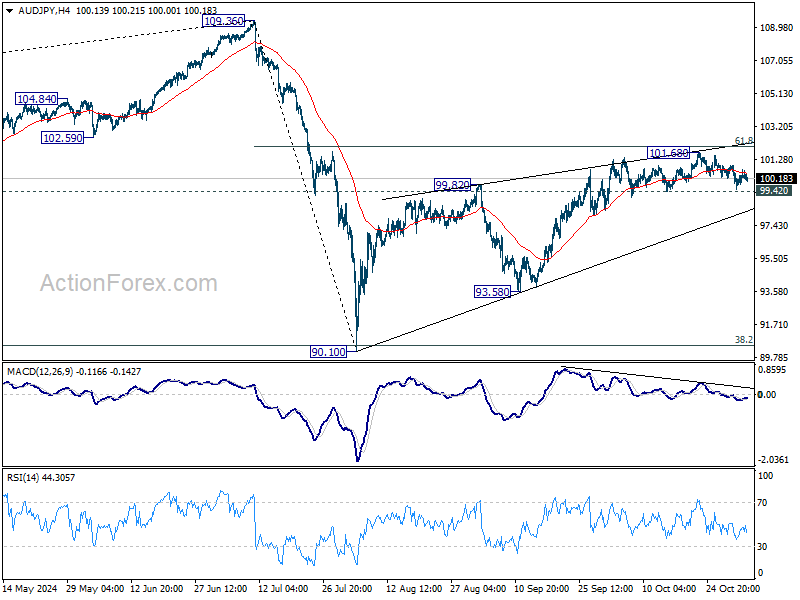
Technically, a short term top was in place at 101.68 in AUD/JPY, on bearish divergence condition in 4H MACD, ahead of 61.8% retracement of 109.36 to 90.10 at 102.02. Firm break of 99.42 support will argue that corrective rise from 90.10 has completed with three-waves up to 101.68. The third leg of the pattern from 109.36 might have then commenced. Next target will be 90.10/93.58 support zone in the near term.
In Europe, at the time of writing, FTSE is up 0.62%. DAX is down -0.06%. CAC Is up 0.12%. UK 10-year yield is down -0.018 at 4.442. Germany 10-year yield is down -0.006 at 2.404. Earlier in Asia, Japan was on holiday. Hong Kong HSI rose 0.30%. China Shanghai SSE rose 1.17%. Singapore Strait Times rose 0.47%.
Eurozone Sentix investor confidence rises slightly to -12.8, inflation fears resurface
Eurozone Sentix Investor Confidence index showed modest improvement, rising from -13.8 to -12.8 in November, though it fell just short of the anticipated -12.7. Current Situation index also moved up slightly from -23.3 to -21.5, while the Expectations index held steady at -3.8.
Sentix noted that Germany continues to be the "problem child" of the Eurozone, with ongoing economic struggles that have drawn widespread media attention. However, investors remain largely unfazed by these issues, showing limited reaction to the concerns surrounding Germany’s economic policy.
Meanwhile, inflationary concerns have re-emerged, with Sentix highlighting a significant drop in its "Inflation" theme barometer from +11 to -12.25—the lowest reading since July 2023.
This slump underscores a difficult situation for ECB. A struggling economy would typically benefit from more accommodative monetary policy, but inflationary pressures could restrict the ECB's ability to cut rates further.
Eurozone PMI manufacturing finalized at 46 in Oct, intense competition pressures margins
Eurozone manufacturing showed mild signs of stabilization in October, with PMI Manufacturing index finalizing at 46.0, up from September's 45.0. This marks a slight improvement, but activity remains firmly in contraction.
By country, Spain led the group with a PMI Manufacturing of 54.5, a 32-month high, followed by Ireland at 51.5 and Greece at 51.2. In contrast, the Netherlands and Austria reported significant declines, with PMIs at 47.0 and 42.0 respectively. Germany saw a modest rise to 43.0, marking a three-month high but still in contraction territory, while France's index held steady at 44.5, a two-month low.
Cyrus de la Rubia, Chief Economist at Hamburg Commercial Bank, commented that while the manufacturing recession "did not deepen further" in October, challenges persist. Production and new orders both declined at a slower rate, leading to a Q4 GDP Nowcast indicating a -0.1% contraction in industrial output.
The environment remains "deflationary," benefiting purchasing departments with lower input costs but intensifying competitive pressures, particularly with firms passing on price reductions to customers. De la Rubia noted that this "fierce competition," likely amplified by competition from China, is squeezing profit margins across the sector.
RBNZ flags geopolitical risks as key threat to New Zealand’s financial stability
RBNZ highlighted significant geopolitical risks as a major concern for New Zealand’s financial stability in a pre-release of findings from its upcoming Financial Stability Report. Key threats stem from global tensions involving Russia, China, and the Middle East, which RBNZ may incorporate into next year’s solvency stress test.
RBNZ noted that in some scenarios, “global supply chains were disrupted,” triggering renewed inflationary pressures and elevated interest rates. The report mentions a “more extreme scenario” involving a conflict in the Asia-Pacific region with one or more of New Zealand’s key trading partners. This may allude to risks of a major disruption if China attempts to assert territorial claims in the South China Sea or to use force in the Taiwan Strait.
Kerry Watt, RBNZ’s Director of Financial Stability Assessment & Strategy, commented on the increased “concern about geopolitical tension,” emphasizing that “as a small open economy, dependent on international trade and investment, geopolitical risks are clearly relevant to our financial system. Their potential impacts cannot be underestimated."
EUR/USD Mid-Day Outlook
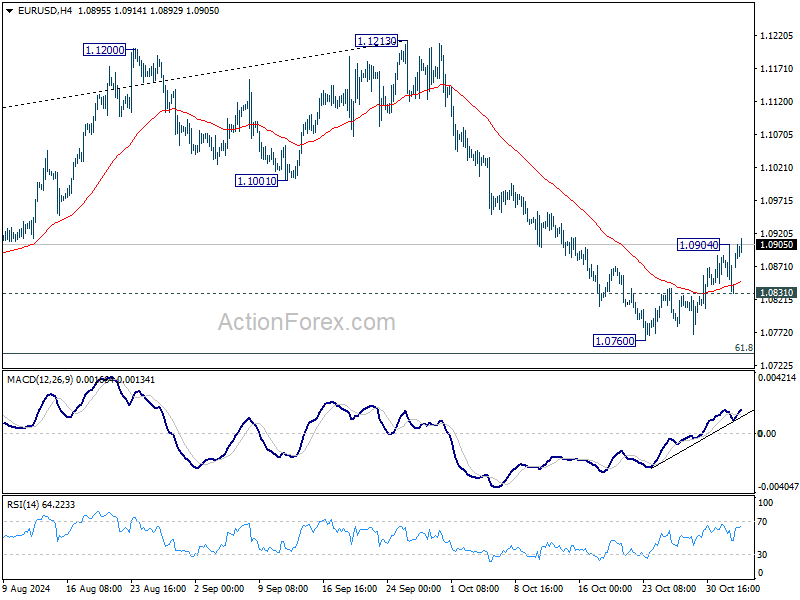
Daily Pivots: (S1) 1.0809; (P) 1.0857; (R1) 1.0883; More...
Intraday bias in EUR/USD is back on the upside as rebound from 1.0760 short term bottom resumed. Further rise would be seen to 55 D EMA (now at 1.0940). Strong resistance should be seen there to limit upside. On the downside, below 1.0831 minor support will bring retest of 1.0760 first, and then 61.8% retracement of 1.0447 to 1.1213 at 1.0740.
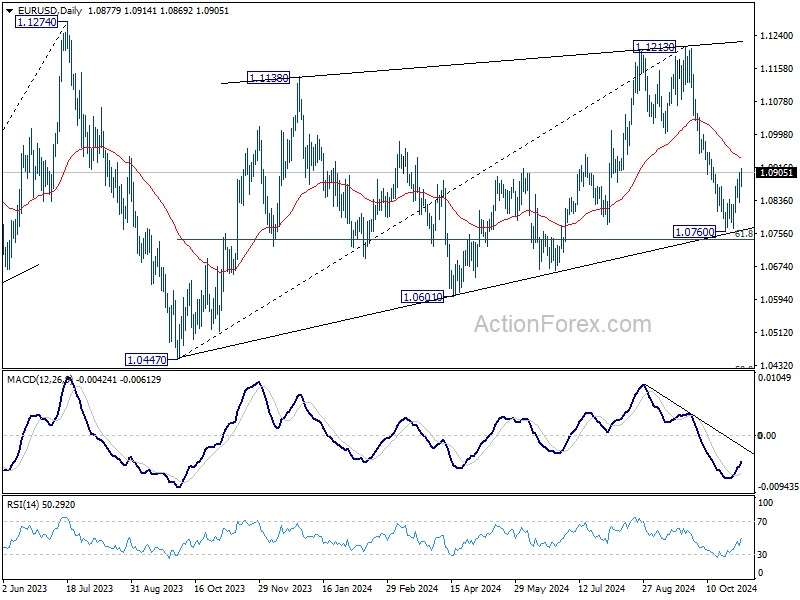
In the bigger picture, price actions from 1.1274 (2023 high) are seen as a consolidation pattern to up trend from 0.9534 (2022 low), with fall from 1.1213 as the third leg. Downside should be contained by 50% retracement of 0.9534 (2022 low) to 1.1274 at 1.0404, to bring up trend resumption at a later stage.
Brent Crude Rises as OPEC+ Delays Production Increase
Brent crude oil prices climbed above 74 USD per barrel following OPEC+'s announcement to delay its production increase originally scheduled for December. This decision marks the second postponement by OPEC+ amid persistent global economic challenges and aims to avoid potential market oversupply.
Demand prospects remain subdued with Europe's slow economic recovery and Asia's lacklustre performance, particularly in China despite recent stimulus efforts. Additionally, tensions in the Middle East, particularly Iran's continued threats against Israel, are providing strong support to oil prices, with potential escalations anticipated post-US presidential elections on 5 November.
Concerns that regional oil production facilities might be targeted in these attacks contribute to fears of disrupted supply, further buoying oil prices. Meanwhile, temporary weakness in the US dollar also increases oil prices.
Technical analysis of Brent
Brent crude oil prices have rebounded from a recent low of 70.55 and are upward towards 76.16. The market is consolidating around 73.22, with a potential breakout that could lead to the 76.16 level. Once this target is achieved, a pullback to 73.22 could occur before further gains towards 79.20 are pursued. This bullish scenario is supported by MACD indicators suggesting upward momentum.
Following a correction to 73.22, Brent is poised to ascend to 74.90. A successful breach of this level could pave the way to 76.16. The stochastic oscillator's position above 50, pointing upwards towards 80, corroborates this potential upward movement.
As Bitcoin Retreats from the Top, Ethereum Moves to the Bottom
Market Picture
The crypto market lost 1.7% of its cap in 24 hours to $2.24 trillion. The market is correcting as Trump’s chances of winning national polls diminish ahead of the election. For now, it looks like a de-risking ahead of an important event where both major candidates have roughly equal chances of winning.
The price of bitcoin has fallen back below $68.5K and was bottomed out at levels $1K lower on Sunday. The pullback has not yet broken the overall bullish pattern that has been forming since September. We will be able to talk about the bears’ clear superiority when the price breaks below $65K, which would be a failure below the local lows from the end of last month and the 50-day moving average.
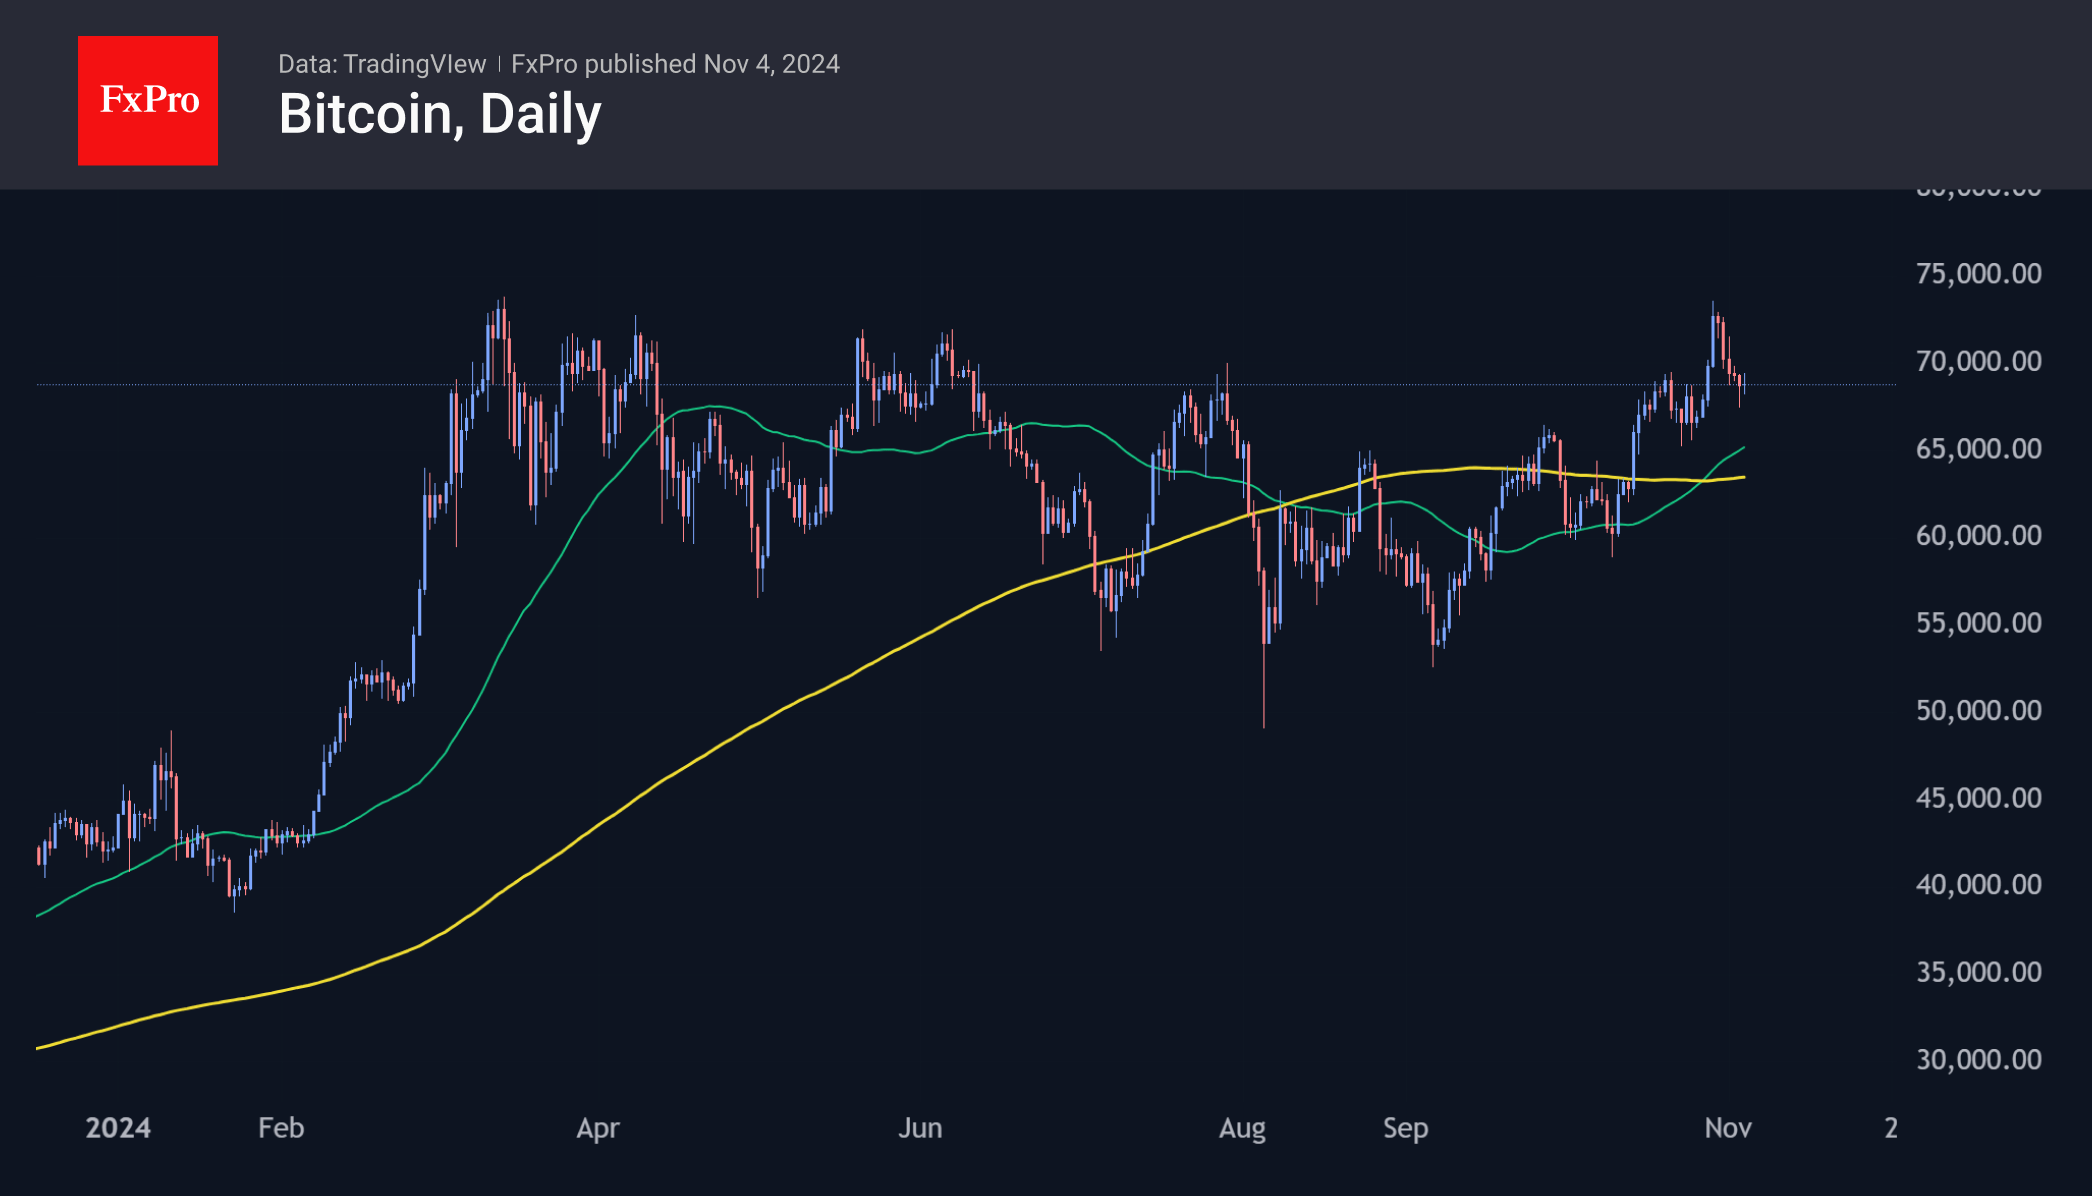
The situation is gloomier for Ethereum, which has been losing for the fifth day in a row, falling back to $2450—the lowest of the last three weeks. It is below the 50-day moving average and generally near the lower end of its trading range since August.

News Background
Inflows into spot bitcoin ETFs in the US were the highest since mid-March and the fourth highest since the funds’ inception. According to data from SoSoValue, inflows into BTC ETFs totalled $2.22 billion last week, bringing total investment to $24.15 billion.
Bitcoin options traders prepared for a bullish scenario after the US presidential election and the Fed meeting by increasing open interest in November calls with strike prices above $80K. JPMorgan noted that a Trump victory in the election on 5 November may strengthen BTC’s upward momentum.
Swiss company 21Shares has filed a Form S-1 with the US SEC to register an ETF based on XRP.
Tether, the issuer of the USDT stablecoin, reported a net profit of $2.5bn for the third quarter. Since the beginning of the year, the figure has reached $7.7 billion. According to Tether’s statement, the financial results have been confirmed by the auditing firm BDO. The group’s equity reached $14.7 billion, and consolidated assets reached an all-time high of $134.4 billion.
The state of Florida reported $800 million in cryptocurrency-related assets. It is not the first US state to invest in crypto assets. In May, the Wisconsin Investment Board announced the purchase of $163 million worth of spot bitcoin ETF shares.
Eurozone Sentix investor confidence rises slightly to -12.8, inflation fears resurface
Eurozone Sentix Investor Confidence index showed modest improvement, rising from -13.8 to -12.8 in November, though it fell just short of the anticipated -12.7. Current Situation index also moved up slightly from -23.3 to -21.5, while the Expectations index held steady at -3.8.
Sentix noted that Germany continues to be the "problem child" of the Eurozone, with ongoing economic struggles that have drawn widespread media attention. However, investors remain largely unfazed by these issues, showing limited reaction to the concerns surrounding Germany’s economic policy.
Meanwhile, inflationary concerns have re-emerged, with Sentix highlighting a significant drop in its "Inflation" theme barometer from +11 to -12.25—the lowest reading since July 2023.
This slump underscores a difficult situation for ECB. A struggling economy would typically benefit from more accommodative monetary policy, but inflationary pressures could restrict the ECB's ability to cut rates further.
XAU/USD Analysis: Gold Price Chart Displays Bearish Signals
Analysing the XAU/USD chart on October 18, we:
→ Established a long-term upward channel (indicated in blue);
→ Suggested that the target for bulls might be the upper red line, drawn parallel to the red corrective channel.
Since then:
→ The gold price rose to the upper red line and the top of the blue channel,
→ But then experienced a bearish reversal, dropping sharply on October 31 amid economic news.
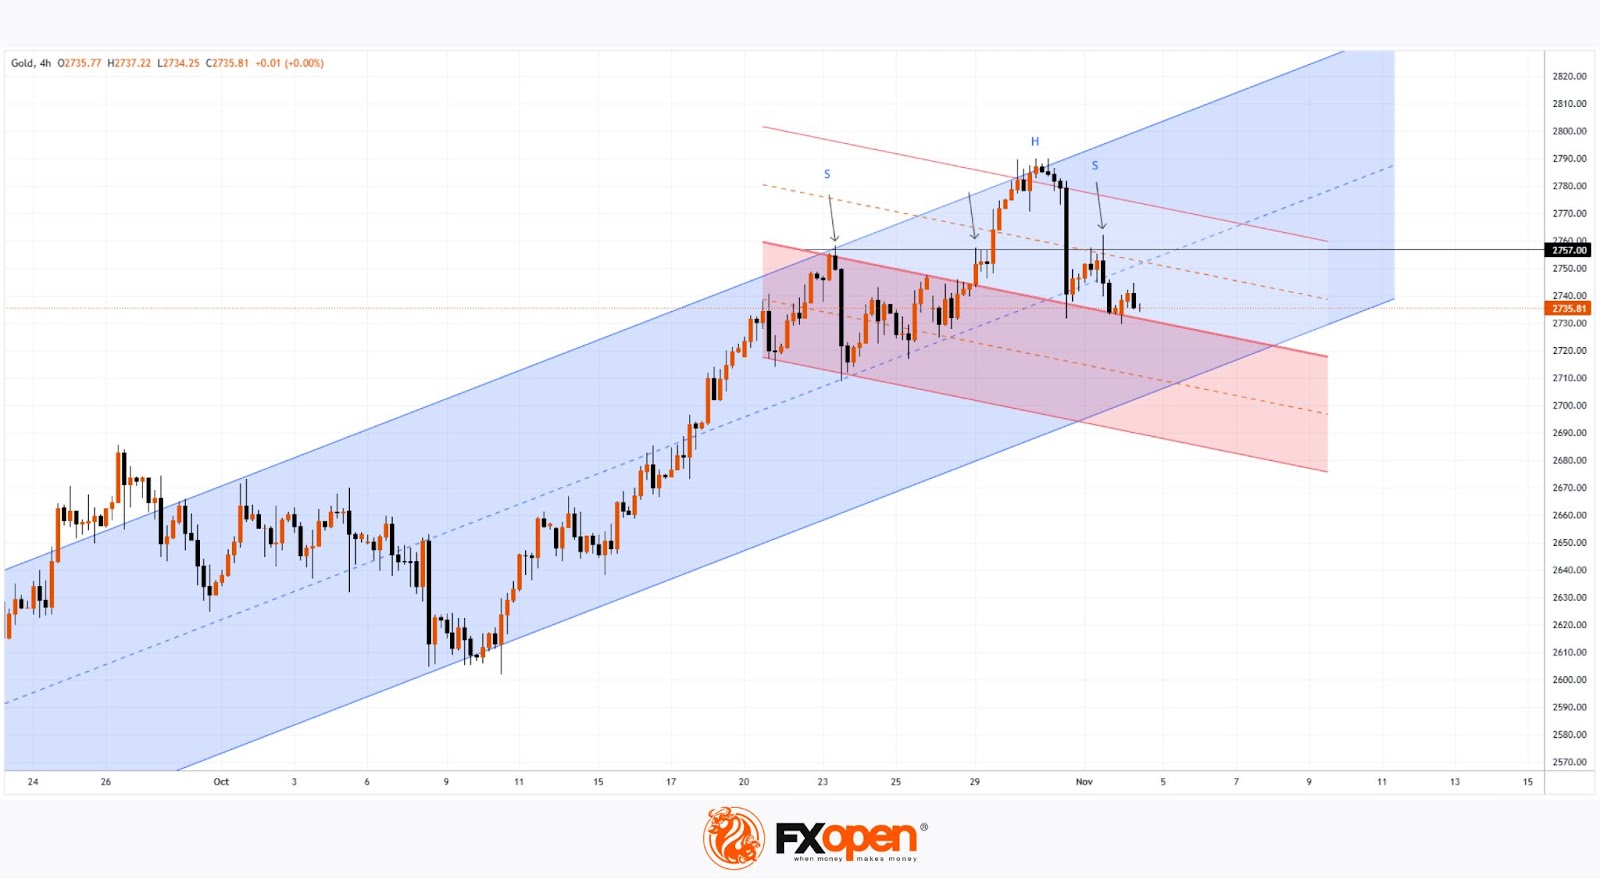
Today, technical analysis of the XAU/USD chart shows several bearish signals, specifically:
→ Gold has moved into the lower half of the blue channel, crossing below its midpoint—indicating supply pressure;
→ The $2757 level has once again acted as resistance (marked with arrows);
→ A bearish "Head and Shoulders" pattern (SHS) is forming on the chart.
A central question for November will likely be whether bulls can keep the gold price within the ascending channel. The channel’s lower boundary may serve as a support level.
However, it’s possible that, with new developments in geopolitics and macroeconomics, the XAU/USD chart will continue to display price action within a more defined downward channel.
Start trading commodity CFDs with tight spreads. Open your trading account now or learn more about trading commodity CFDs with FXOpen.
This article represents the opinion of the Companies operating under the FXOpen brand only. It is not to be construed as an offer, solicitation, or recommendation with respect to products and services provided by the Companies operating under the FXOpen brand, nor is it to be considered financial advice.
Eurozone PMI manufacturing finalized at 46 in Oct, intense competition pressures margins
Eurozone manufacturing showed mild signs of stabilization in October, with PMI Manufacturing index finalizing at 46.0, up from September's 45.0. This marks a slight improvement, but activity remains firmly in contraction.
By country, Spain led the group with a PMI Manufacturing of 54.5, a 32-month high, followed by Ireland at 51.5 and Greece at 51.2. In contrast, the Netherlands and Austria reported significant declines, with PMIs at 47.0 and 42.0 respectively. Germany saw a modest rise to 43.0, marking a three-month high but still in contraction territory, while France's index held steady at 44.5, a two-month low.
Cyrus de la Rubia, Chief Economist at Hamburg Commercial Bank, commented that while the manufacturing recession "did not deepen further" in October, challenges persist. Production and new orders both declined at a slower rate, leading to a Q4 GDP nowcast indicating a -0.1% contraction in industrial output.
The environment remains "deflationary," benefiting purchasing departments with lower input costs but intensifying competitive pressures, particularly with firms passing on price reductions to customers. De la Rubia noted that this "fierce competition," likely amplified by competition from China, is squeezing profit margins across the sector.
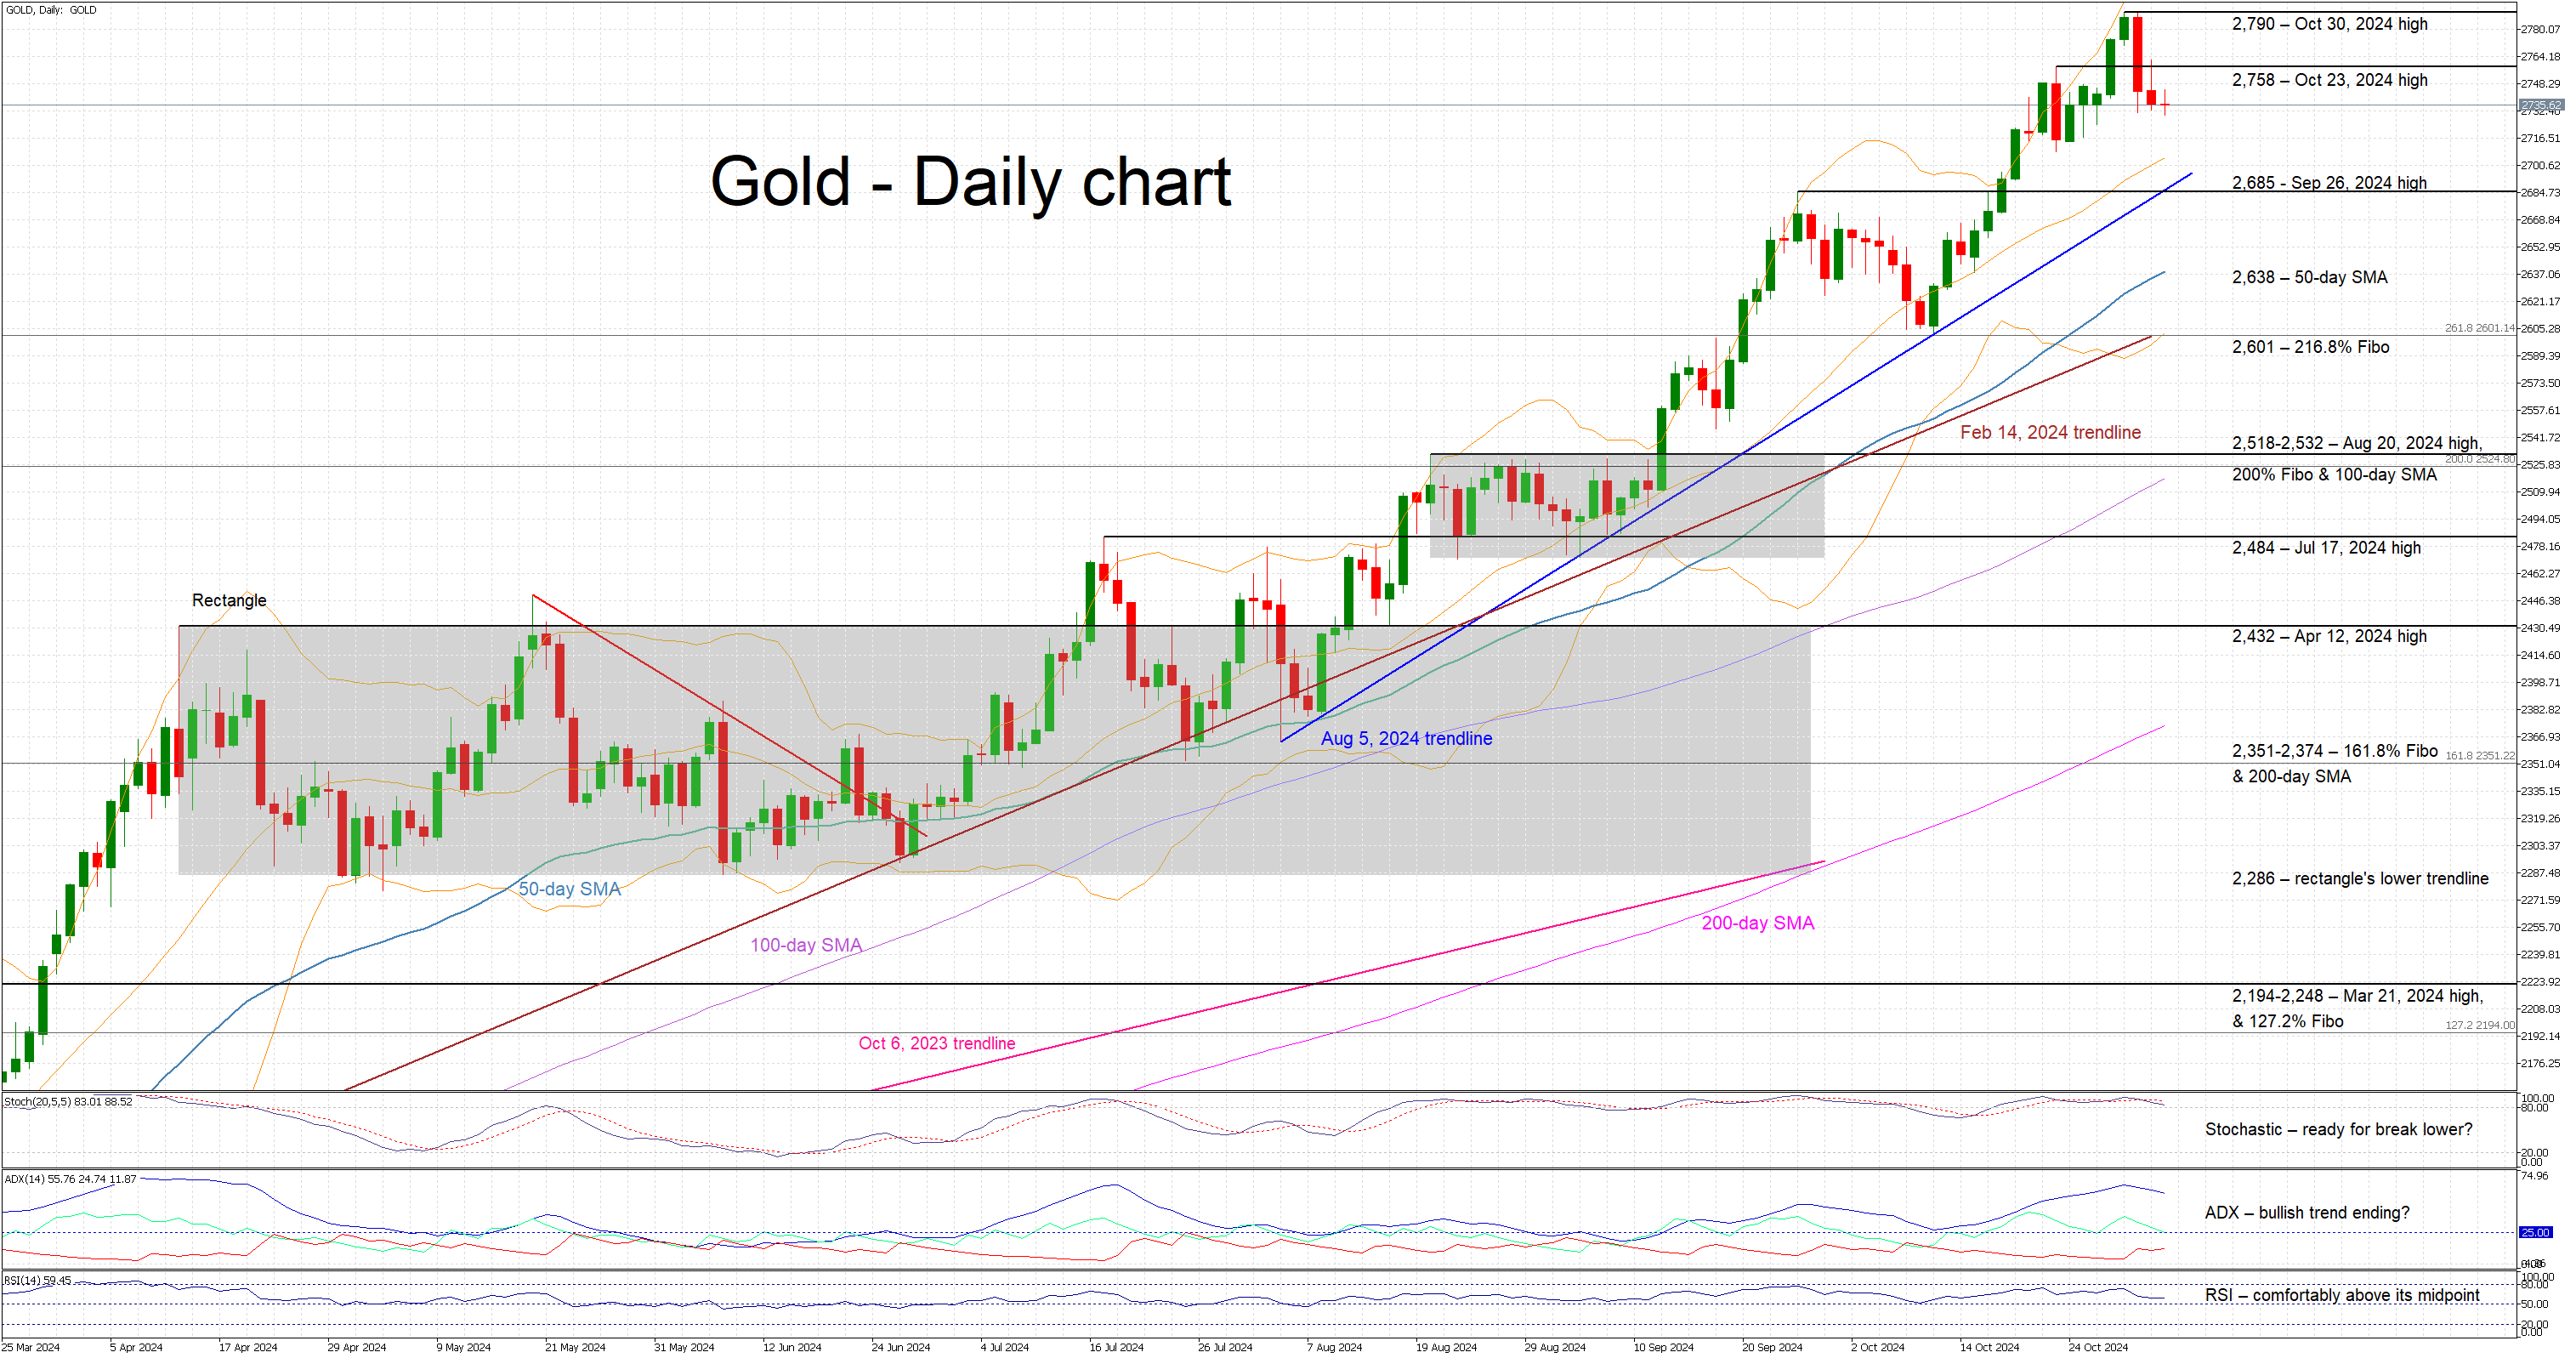
Gold in Anticipation Mode
- Gold is trading sideways, well below its recent high
- Volatility remains elevated ahead of the US election
- Momentum indicators remain mostly bullish
Gold is trading sideways today and thus failing to forcefully react to the two negative sessions that pushed it well below its all-time high of 2,790. Month-end portfolio reallocations and profit taking could explain last week’s price movements, with the market now preparing for Tuesday’s US presidential election. The medium-term bullish trend since the June lows remains in place, supported by a series of higher highs and higher lows.
In the meantime, the momentum indicators are still bullish. The RSI is trading comfortably above its midpoint but appears unwilling to record a higher high. Similarly, the Average Directional Movement Index (ADX) is edging lower, and gradually pointing to a weaker bullish trend in gold. More importantly, the stochastic oscillator is hovering inside its overbought territory (OB) but looks ready for a break below both its moving average (MA) and OB area. Should this move take place, it could be seen as a strong bearish signal.
If the bulls remain confident, they could try to push gold above the October 23, 2024 high of 2,758, with the next target level being the all-time high at 2,790. Should events favour another upleg, the 2,800 level might end up being a small obstacle for the bulls on their way higher.
On the flip side, the bears are keen for a continuation of last week’s weakness. They could lead gold lower towards the 2,685 area where the September 26, 2024 high and the August 5, 2024 ascending trendline intersect. Even lower, the 50-day SMA at 2,638 could be the last hurdle before the bears are able test the support set by the 261.8% Fibonacci extension of March 8, 2022 – September 28, 2022 downtrend at 2,601.
To sum up, gold is trying to find its footing after last week’s correction, with market participants firmly focused on the US presidential election.
AUD/USD and NZD/USD Rebound Could Be Limited
AUD/USD is attempting a recovery wave from 0.6540. NZD/USD is also correcting losses and might recover further if there is a clear move above the 0.6030 resistance.
Important Takeaways for AUD/USD and NZD/USD Analysis Today
- The Aussie Dollar found support near 0.6540 and is now recovering against the US Dollar.
- There was a break above a key bearish trend line with resistance at 0.6575 on the hourly chart of AUD/USD at FXOpen.
- NZD/USD is attempting a recovery wave above the 0.5960 resistance.
- There was a break above a major bearish trend line with resistance near 0.5980 on the hourly chart of NZD/USD at FXOpen.
AUD/USD Technical Analysis
On the hourly chart of AUD/USD at FXOpen, the pair dipped from the 0.6600 resistance zone. The Aussie Dollar declined below 0.6600, but the bulls were active near 0.6540 against the US Dollar.
A low was formed near 0.6537 and the pair is now correcting losses. There was a move above the 50% Fib retracement level of the downward move from the 0.6659 swing high to the 0.6537 low. There was also a break above a key bearish trend line with resistance at 0.6575.
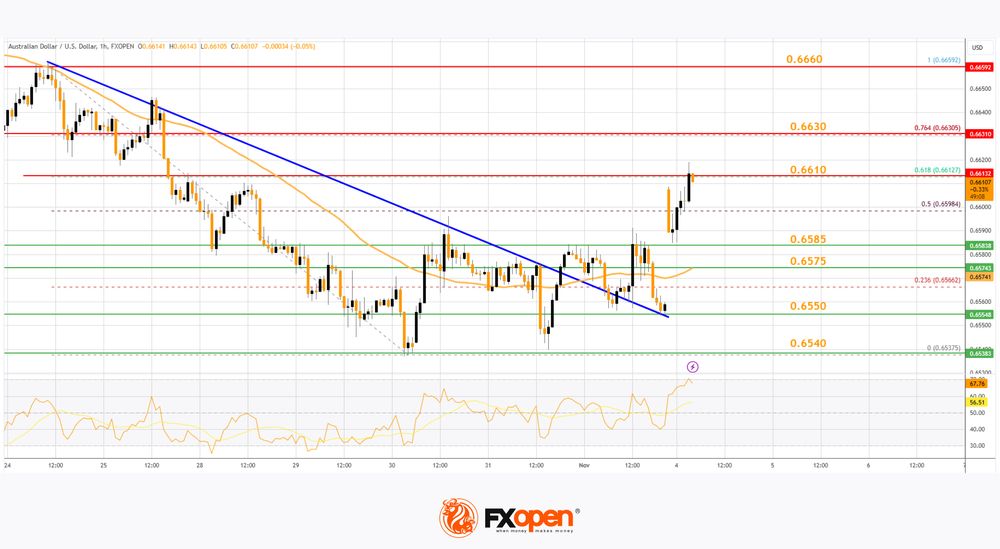
The pair is now above 0.6585 and the 50-hour simple moving average. On the upside, immediate resistance is near the 61.8% Fib retracement level of the downward move from the 0.6659 swing high to the 0.6537 low at 0.6610.
The first major resistance is near a rising channel at 0.6630. A clear upside break above 0.6630 could send the pair toward 0.6660. The next major resistance on the AUD/USD chart is near 0.6680, above which the price could rise toward 0.6725. Any more gains might send the pair toward 0.6740.
On the downside, initial support is near 0.6575 or the 50-hour simple moving average. The next support could be the 0.6540 zone. Any more losses might send the pair toward the 0.6500 support.
NZD/USD Technical Analysis
On the hourly chart of NZD/USD on FXOpen, the pair also followed a similar pattern and declined from the 0.6030 zone. The New Zealand Dollar gained bearish momentum and traded below 0.6000 against the US Dollar.
The pair even dropped below the 50-hour simple moving average and tested 0.5940. A low was formed near 0.5939 and the pair is now attempting a fresh increase. It is back above the 0.5960 level and the 50-hour simple moving average.
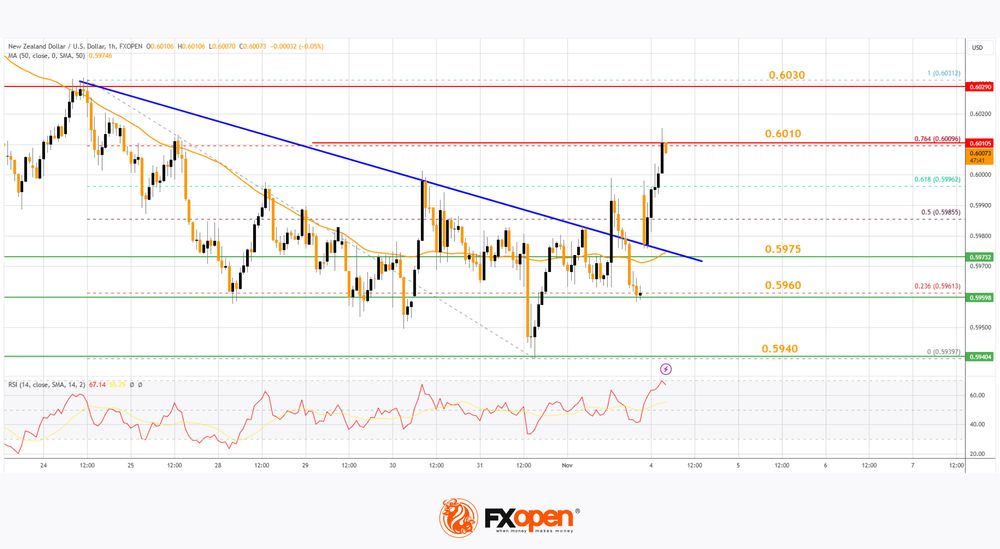
Besides, there was a break above a major bearish trend line with resistance near 0.5980. The pair surpassed the 50% Fib retracement level of the downward move from the 0.6031 swing high to the 0.5939 low.
On the upside, the pair is facing resistance near the 76.4% Fib retracement level of the downward move from the 0.6031 swing high to the 0.5939 low at 0.6010.
The next major resistance is near the 0.6030 level. If there is a move above 0.6030, the pair could rise toward the 0.6050 resistance. Any more gains might open the doors for a move toward the 0.6085 resistance zone.
On the downside, immediate support on the NZD/USD chart is near 0.5975. The next major support is near the 0.5960 zone. If there is a downside break below 0.5960, the pair could extend the decline toward the 0.5940 level. The next key support is near 0.5910.
Trade over 50 forex markets 24 hours a day with FXOpen. Take advantage of low commissions, deep liquidity, and spreads from 0.0 pips. Open your FXOpen account now or learn more about trading forex with FXOpen.
This article represents the opinion of the Companies operating under the FXOpen brand only. It is not to be construed as an offer, solicitation, or recommendation with respect to products and services provided by the Companies operating under the FXOpen brand, nor is it to be considered financial advice.
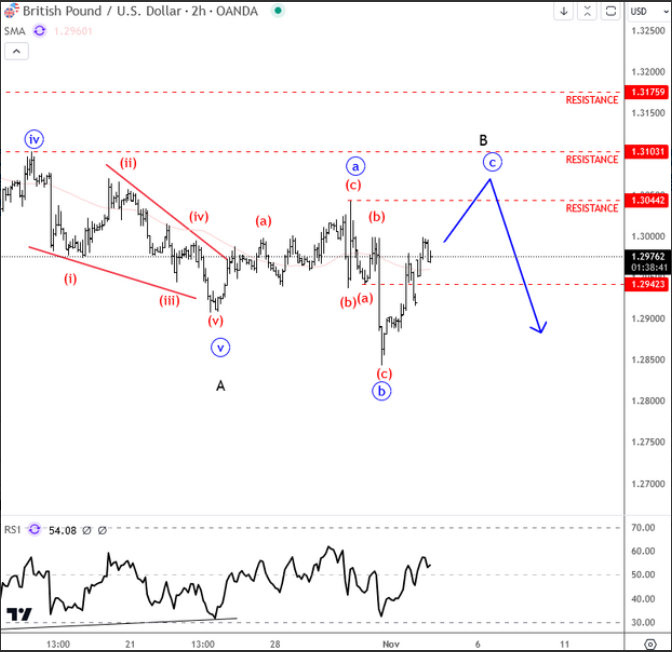
Cable Moving into Resistance Ahead of BoE
Cable's drop to a new low last week occurred in only three waves from 1.3044, suggesting it’s likely part of wave "b" in a complex correction. Therefore, we are looking for a potential flat formation here in wave B, with resistance possibly at the 1.3044 to 1.31 area. We think there is a chance for a sell-off from there, especially if we consider that BOE can be looking for cuts and sound very dovish as latest inflation figures came out at 1.7%, down from 2.2%.
Dollar Ceding Ground, Probably on Headlines Referring to Harris Taking Lead in Battleground State of Iowa
Markets
US payrolls and the Manufacturing ISM caused quite some intraday volatility on Friday but in the end didn’t change the broader market picture in any profound way. The US economy in October only added 12k jobs versus a 100k rise expected. However, the outcome was materially distorted by hurricanes and by a major strike (Boeing) which made it very difficult to draw conclusions on the underlying trends/strength of the US labour market. The unemployment rate remain low at 4.1%. Average early earnings (0.4% M/M, 4.0% Y/Y) were marginally stronger than expected. In a first Pavlov reaction, US yields and the dollar nosedived, but soon reversed (more than) the initial decline. This reversal also shouldn’t have been triggered by a mediocre/mixed manufacturing ISM (46.5 from 47.2). The prices paid index jumped to 54.8 from 48.3, but this might also have been a one-off due to temporary supply disruptions. In the end, Friday’s data didn’t change markets’ assessment that everything is in place for the Fed to slow the pace of easing to 25 bps at this week’s meeting. The long end of the curve continues to suffer from fiscal uncertainty going in the US elections. US yields in the end added between 3.5 bps (2-y) and 10.3 bps (30-y). After better growth data and slightly higher than expected inflation published earlier last week, the German yield curve (re)steepened slightly, changing between -3.4 bps (2-y) and +3.6 bps (30-y). The dollar rebounded against most majors (EUR/USD close 1.0834, DXY 104.28, USD/JPY 153.01), but this probably was mostly ‘conservative’ market positioning going into the weekend and looking forward to the outcome of US elections. US equities gained modest ground after the setback earlier last week (S&P 500 + 0.41%). Some kind of calm also returned to UK markets after the budget-induced volatility. Sterling regained part of last week’s losses. EUR/GBP dropped back from the 0.8440 area to close at 0.8386.
Asian markets this morning are taking a cautious, mostly positive start to the new trading week. US Treasuries gain and the dollar is ceding ground, probably on headlines referring to a poll that Kamala Harris might take the lead in the battleground state of Iowa. Even if this is the reason behind the move, it only can be considered as markets moving to a more neutral positioning as the outcome remains a very close call. This might also cause some further erratic market moves today and tomorrow. The downside in EUR/USD now looks a bit better protected with some additional breathing space versus the 1.0761/69 recent lows. However, the real evaluation will only be possible on Wednesday. Aside from the Fed policy decision on Thursday, several other central banks will also hold regular meetings including the RBA (Tuesday), the National Bank of Poland (Wednesday) and the BOE, the Riksbank, the Norges Bank and the Czech national bank on Thursday. We especially look out for the BoE assessment of the Budget and its potential impact on the pace of easing going forward.
News & Views
The OPEC+ cartel yesterday decided to delay the start its production cut reversal for a second time. The alliance in June announced that they would gradually restore in monthly tranches 2.2mn barrels a day of output halted since 2022. The process would have originally started in October by adding 180k b/d. Weak Chinese demand and higher US supplies triggered a delay to December which is now pushed to January amid the fragile economic outlook which dampened oil prices. OPEC+ will meet on December 1st to review the 2025 outlook. Brent crude prices gapped open higher this morning, rising from a $73/b close on Friday to $74.50.
Rating agency S&P raised the Turkish credit rating for a second time this year by one notch, from B+ to BB- (three notches below investment grade). That’s in line with Fitch (BB-, stable) and slightly better than Moody’s (B1; positive). S&P changed the outlook from positive to stable. The rating agency said that the risk of the sovereign preventing private-sector debtors from servicing foreign currency-denominated debt is diminished in light of steps taken by authorities to re-build previously depleted external buffers amid a gradual removal of financial sector regulations hampering foreign currency liquidity management. The stable outlook balances S&P’s expectation that the current economic team will persevere with tight monetary policy against the implementation risks associated with the government's medium term program. The Turkish lire continues trading near all-time lows (EUR/TRY 37.50).