Sample Category Title
Canada’s GDP grows 0.2% mom in Jul essentially unchanged in Aug
Canada's GDP grew 0.2% mom in July, above expectation of 0.1% mom. Services-producing industries grew 0.2% mom while goods- producing industries rose 0.1% mom. Overall, 13 of 20 sectors expanded in July.
Advance information indicates that real GDP was essentially unchanged in August. Increases in oil and gas extraction and the public sector were offset by decreases in manufacturing and transportation and warehousing.
US PCE inflation falls to 2.2% in Aug, core PCE ticks up to 2.7%
US personal income rose USD 50.5B or 0.2% mom in August, below expectation of 0.4% mom. Personal spending rose USD 47.2B or 0.2% mom, below expectation of 0.3% mom.
PCE price index rose 0.1% mom, matched expectations while core PCE (excluding food and energy)price index rose 0.1% mom,m below expectation of 0.2% mom. Good prices fell -0.2% mom while services prices rose 0.2% mom. Food prices rose 0.1% mom and energy prices fell -0.8% mom.
From the same month a year ago, PCE price growth slowed from 2.5% yoy to 2.2% yoy, below expectation of 2.3% yoy. Core PCE price growth accelerated fro 2.6% yoy to 2.7% yoy, matched expectations. Prices for goods decreased -0.9% yoy and prices for services increased 3.7% yoy. Food prices increased 1.1% yoy and energy prices -decreased 5.0% yoy.
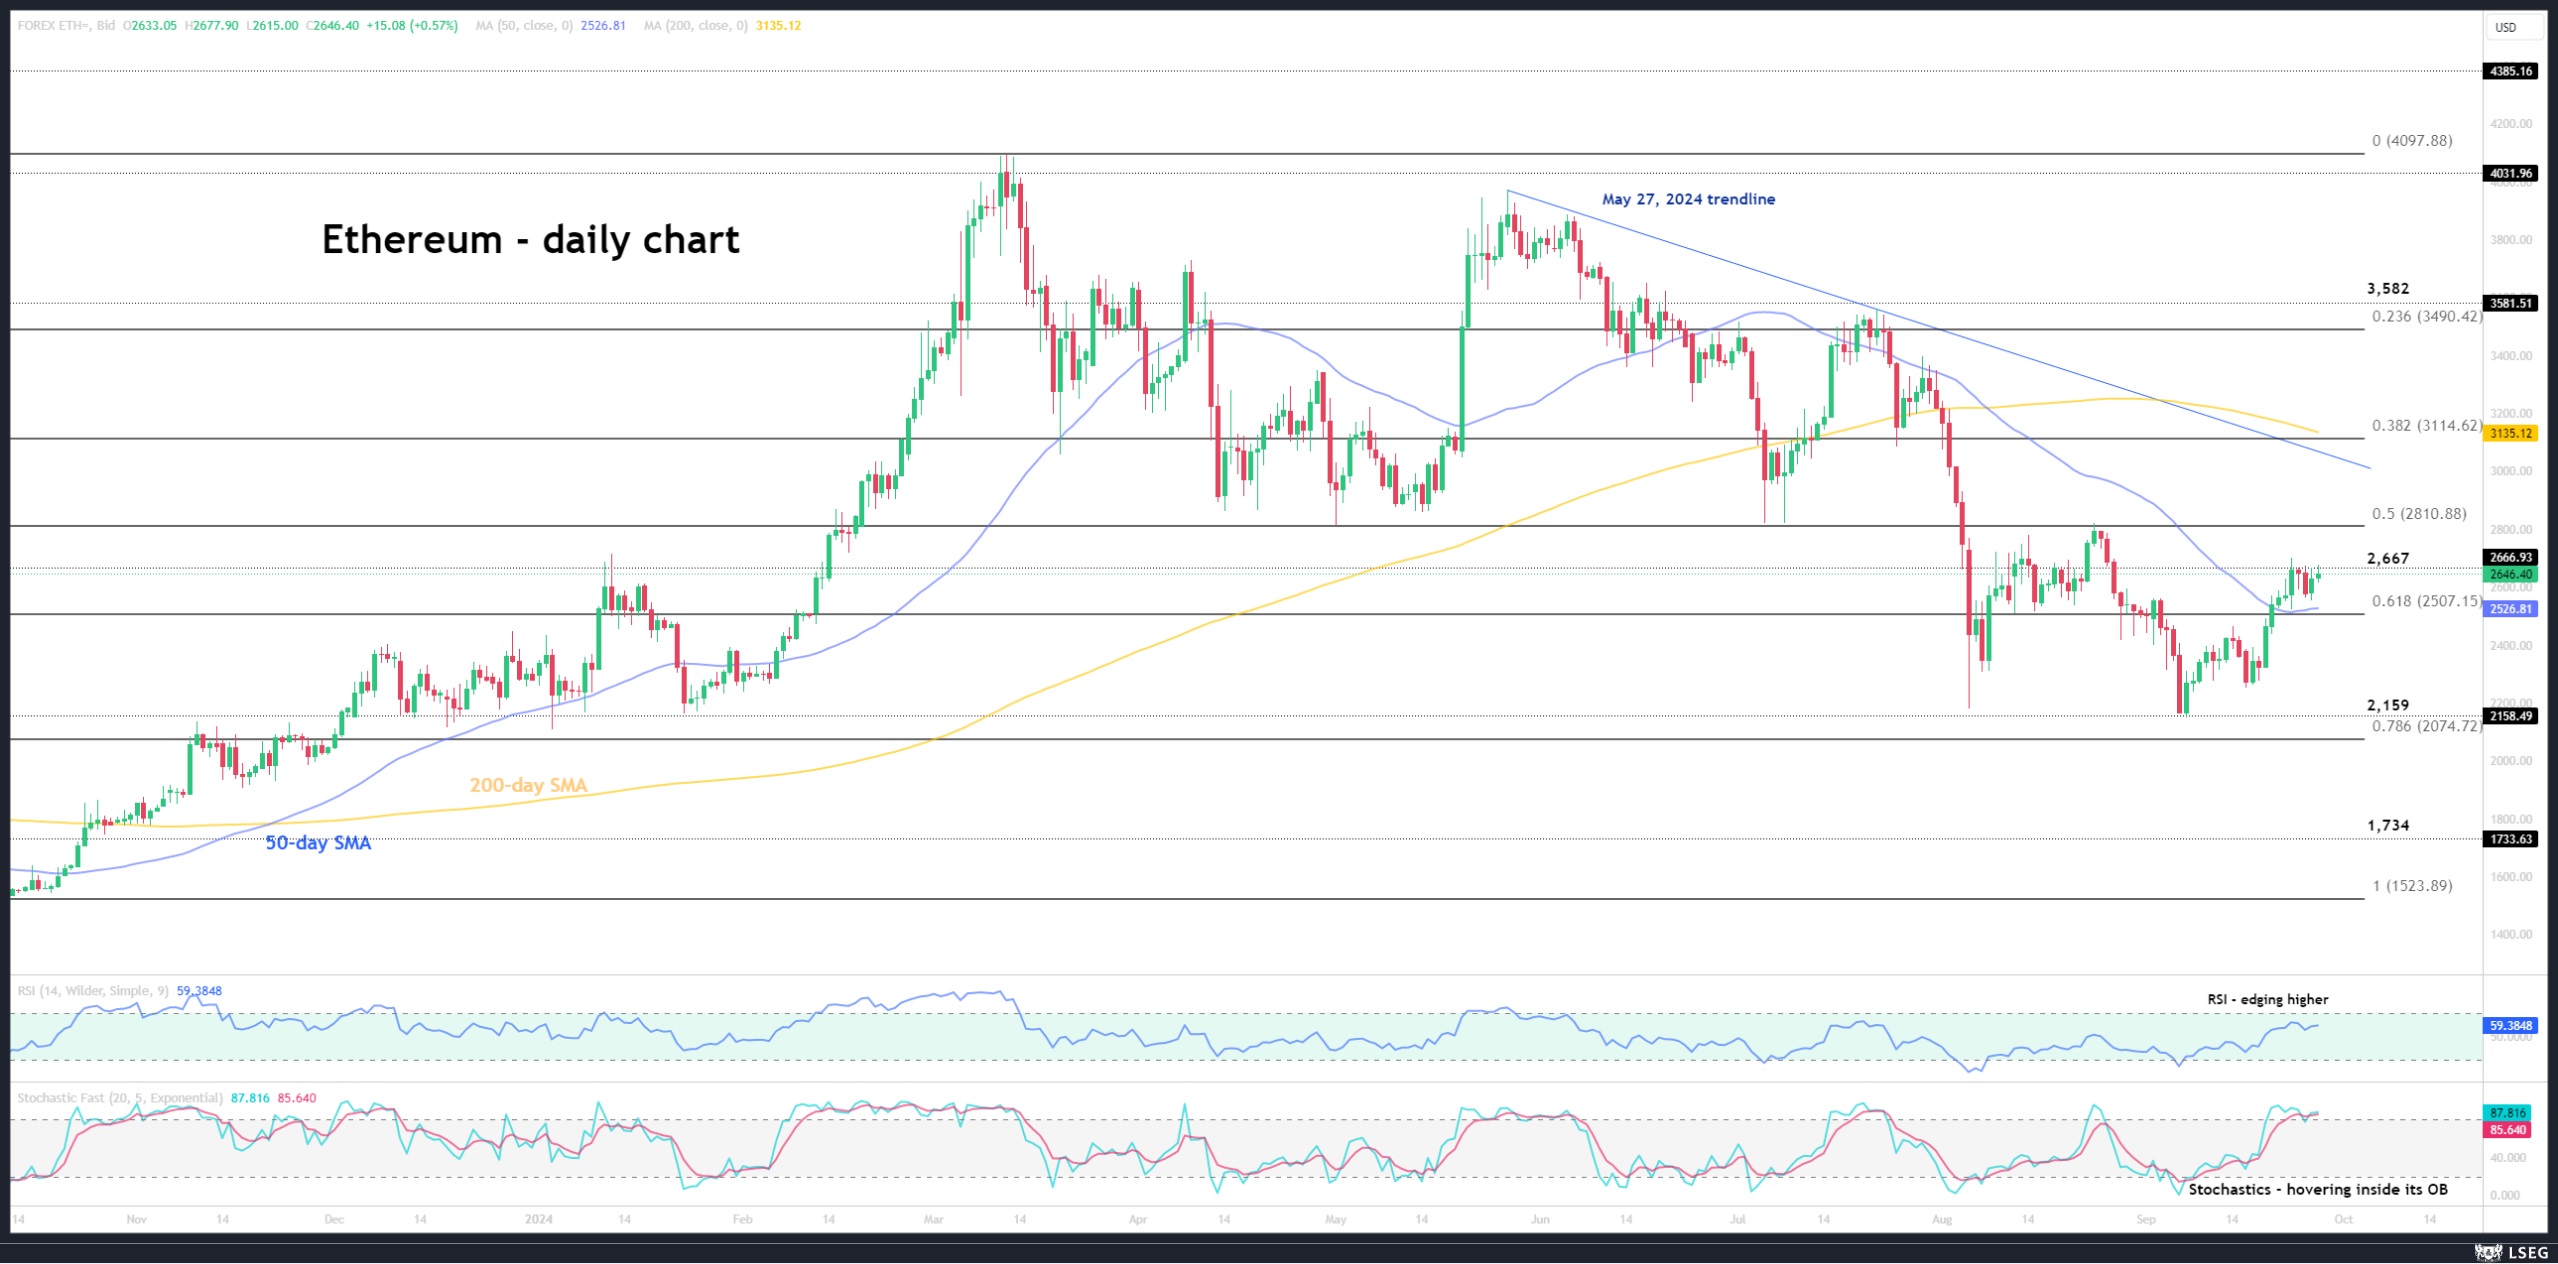
Ethereum Hovers in 2,650 Area
- Cryptos benefit from the improved risk sentiment
- Ethereum is trading above the 50-day SMA
- Momentum indicators remain bullish
Ethereum is recording a green session today, recovering its mid-week weakness and testing the resistance set by the 2,667 level. The improved risk sentiment in equity markets has boosted demand for cryptocurrencies, helping ethereum to quickly bounce back from its early September trough and to climb above its 50-day simple moving average (SMA).
In the meantime, the momentum indicators remain mostly bullish. The RSI is edging higher, but a possible failure to record a new higher high could mean that the current upleg is losing its strength. Interestingly, the stochastic oscillator is hovering inside its overbought territory (OB), battling with its moving average. It can stay in the OB region for a while before signaling the potential completion of the current rally.
Should the bulls remain confident, they would try to lead Ethereum above the 2,667 level and try their luck and resolve against the 61.8% Fibonacci retracement level of the October 13, 2023 – March 12, 2024 uptrend at 2,811. Even higher, the May 27, 2024 trendline might prove a stronger obstacle for the bulls than currently anticipated.
On the other hand, the bears are attempting to retake market control and keep ethereum below the 2,667 level. They could then try to push it below both the 50-day SMA and 61.8% Fibonacci retracement at 2,527 and 2,507 respectively. If successful, the path then looks clear until the recent trough at 2,149, where the bears could have the change to record a new 2024 low.
To conclude, ethereum is benefiting from the improved risk appetite but some key resistance areas have to be broken for the prevailing bearish trend to be reversed.
USD/CAD Eyes Canada’s GDP
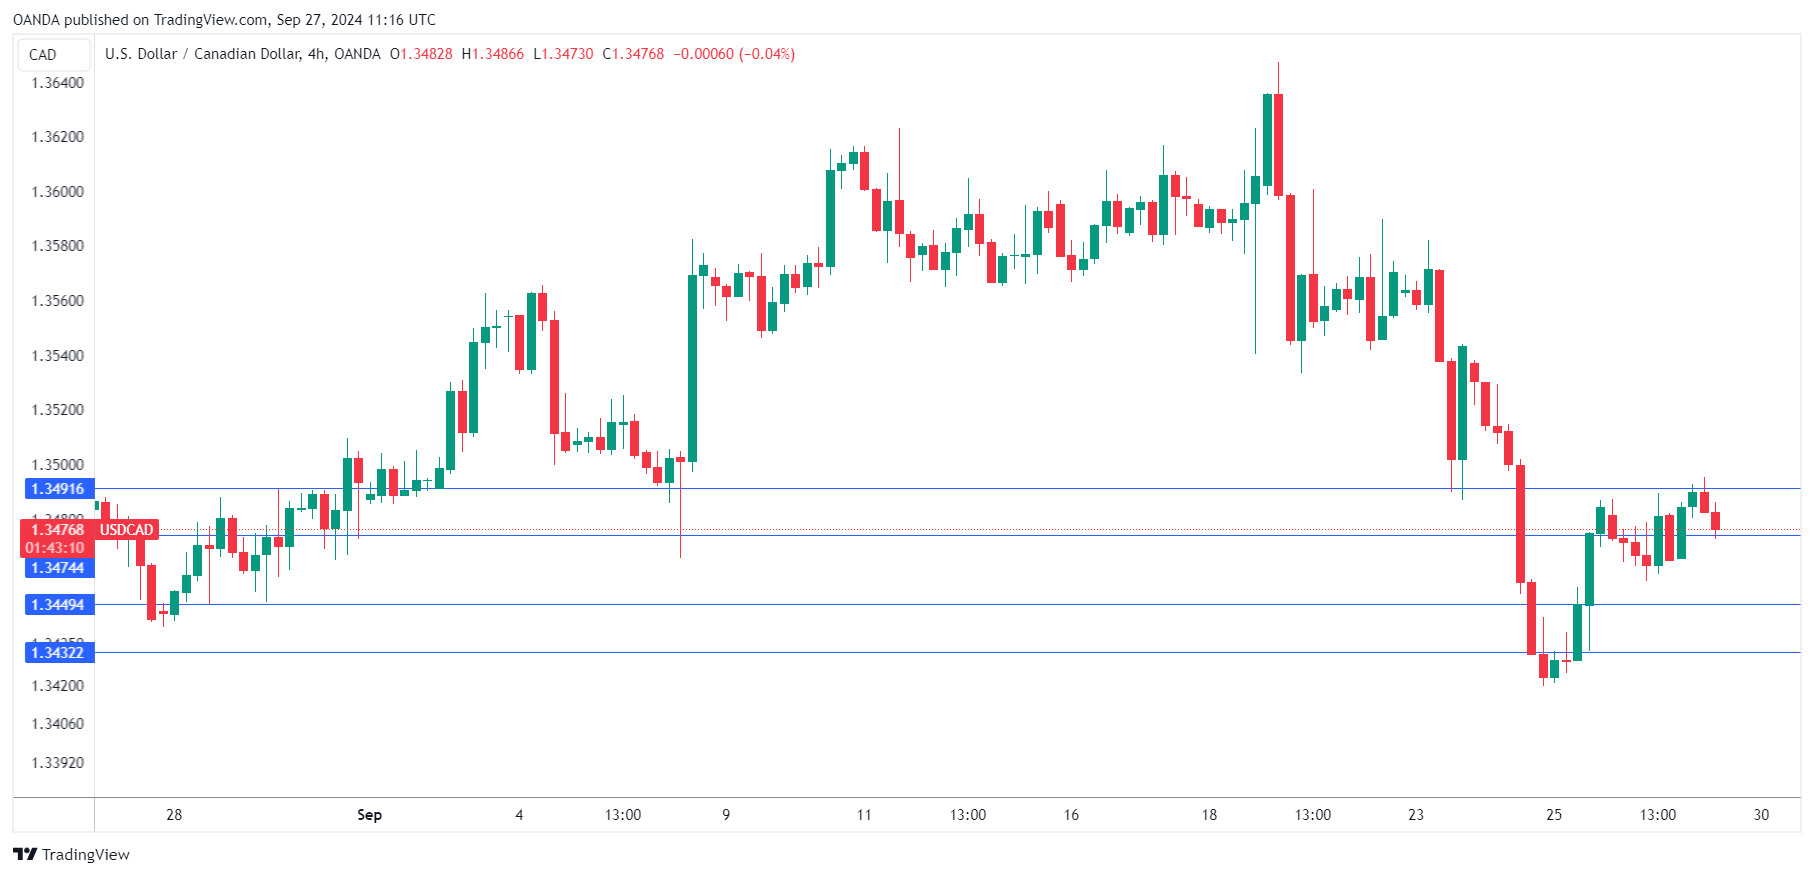
The Canadian dollar is steady on Friday. In the European session, USD/CAD is trading at 1.3476 at the time of writing, up 0.08%.
Canada’s GDP expected to remain unchanged
Canada’s GDP for July is expected at 0.1% m/m, unchanged from June. The economy managed a respectable gain of 2.1% y/y in the second quarter but the third quarter is likely to be much weaker, barring a spectacular turnaround.
The Bank of Canada has been at the forefront of the major central banks in the new rate-cutting cycle. The BoC has already cut three times this year but the economy has been slow to respond. Exports fell in the second quarter and manufacturing and construction continue to weigh on the economy, which is being driven by the services sector.
The BoC, like the Federal Reserve, is expected to remain aggressive and continue trimming rates. With the tough battle against inflation largely won, there is room for further cuts and the markets anticipate cuts of 150 basis points by late 2025. The BoC meets next on October 23. The BoC will be keeping a close eye on the Fed’s rate path, as it doesn’t want Canadian rates to diverge widely from those in the US. Currently, rates in Canada are at 4.25% and 5%-5.25% in the US.
The US will release Core PCE Price Index today, which is considered the Fed’s favorite inflation gauge. The index has hovered at 2.6% for the past three months and is expected to tick up to 2.7% for August. Monthly, the Core PCE is expected to remain at 0.2%. A surprise reading could shake up the US dollar and the rate-cut odds for the Fed’s November meeting. The odds of a 50-basis point continue to swing and are currently at 50%, with a 50% chance of a modest 25-bps reduction.
USD/CAD Technical
- USD/CAD is testing resistance at 1.3474. Close by, there is resistance at 1.3491
- 1.3449 and 1.3432 are the next support levels
Gold Outlook: Limited Pullback from New Record High to Precede Final Attack at $2,700 Target
Gold price eased on Friday after the metal hit new record high on Thursday, with end-of-week partial profit taking being behind the move.
Pullback was so far shallow and the price unlikely to make a stronger dip, but rather consolidation and positioning for fresh push higher.
Sentiment remains firmly bullish in current circumstances of growing expectations for further rate cuts by major central banks and heated geopolitical situation which threatens to escalate, keeping investors in safety.
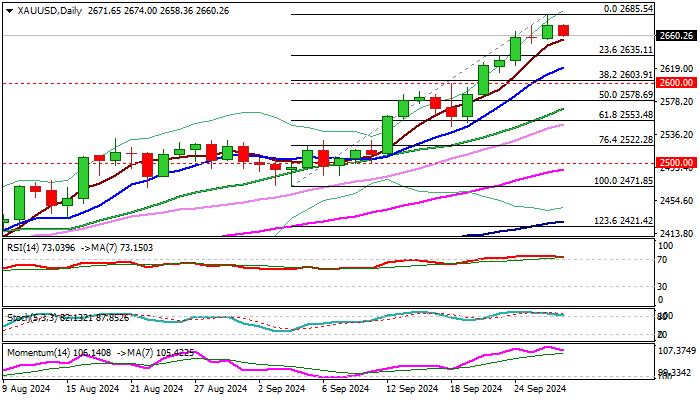
The latest rally neared initial target at $2700, where bulls may face headwinds. However, bullish structure is expected to remain firm in persisting supportive fundamentals.
Daily studies are overbought that contributes to correction scenario, but initial supports at $2655 (Thursday’s low / 5DMA) and $2650 (100HMA) are still intact.
Rising thick hourly Ichimoku cloud ($2660/$2646) also makes significant support and likely to provide additional headwinds.
Dips should be ideally contained above $2620 (rising 10DMA) to keep bulls intact and guard pivotal $2600 support zone (Fibo 38.2% of $2471/2685 / psychological) violation of which would risk deeper correction.
The yellow metal is on track for the third consecutive weekly gain which adds to bullish outlook, though technical selling on overbought weekly studies should be considered.
Res: 2675; 2685; 2700; 2714.
Sup: 2655; 2650; 2635; 2620.
Japanese Yen Soars as Tokyo Core CPI Falls to 2%
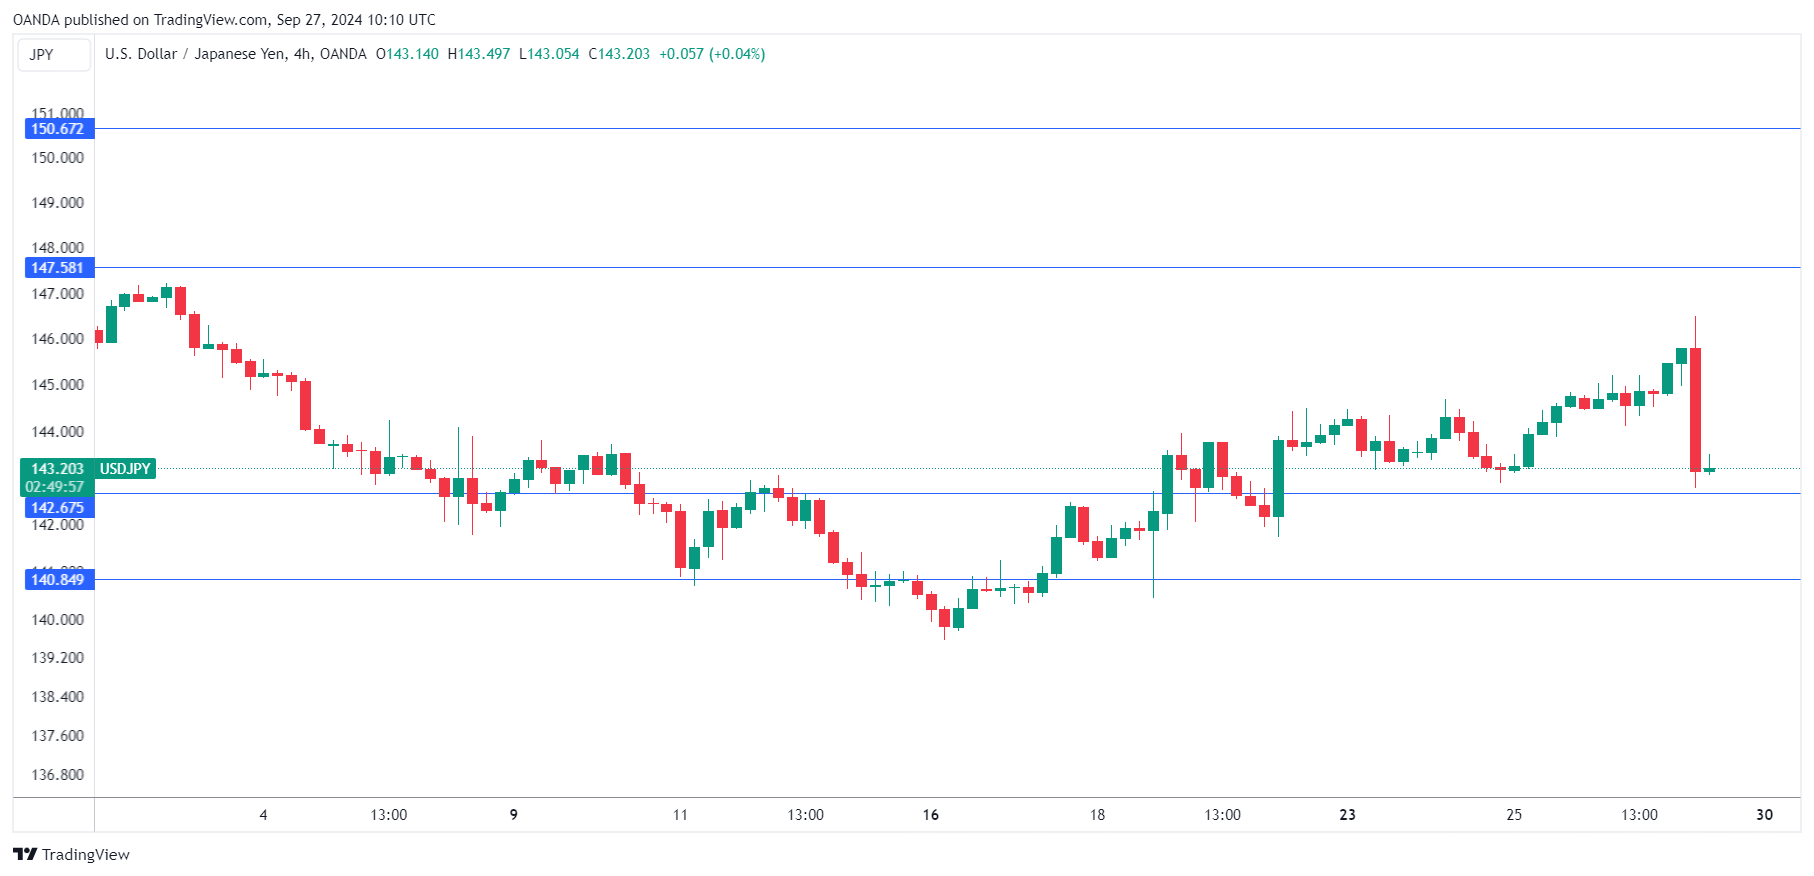
The Japanese yen is sharply higher on Friday. USD/JPY is trading at 143.49 in the European session, down a massive 1.1%.
Tokyo Core CPI matches BoJ’s target
Tokyo Core CPI, which excludes fresh food, slowed to 2% in September, down from 2’s.4% in August and matching the market estimate. The drop was largely driven by the resumption of government subsidies for utility bills.
The inflation reading indicates that Japan is on track to hit the Bank of Japan’s target of sustainable 2% inflation and the yen has responded with sharp gains today. This reading will support the case for further rate hikes, although that’s unlikely until December or early next year.
Governor Ueda said this week that the BoJ is not in any rush to hike rates and that the focus will be on services prices data for October, which won’t be released until November, too late for the October 31 meeting. Wages have been rising but it remains to be seen if this will translate into higher services inflation. If it does, there will be pressure on the BoJ to raise rates at the December meeting.
The week wraps up with US Core PCE Price Index, which is considered the Fed’s preferred inflation indicator. The index has hovered at 2.6% for the past three months and is expected to tick up to 2.7% for August. Monthly, the Core PCE is expected to remain at 0.2%. An unexpected reading could shake up the US dollar and the rate-cut odds for the Fed’s November meeting. The odds of a 50-basis point cut have slipped to 47%, down from 54% a day earlier, according to the CME’s FedWatch tool.
USD/JPY Technical
- USD/JPY faces weekly resistance lines at 147.58 and 150.66
- There is support at 142.67 and 140.84
EUR/USD Sees Recovery as Market Sentiment Shifts Against USD
EUR/USD concluded a stable week, trading around the 1.1170 mark, despite earlier momentum favoring the US dollar. Earlier in the week, the dollar surged—its fastest pace since early June—as markets anticipated insights from key Federal Reserve policymakers. However, no definitive data emerged to significantly sway the dollar's trajectory; rather, subtle market expectations about future Fed actions on interest rates seemed to influence movements.
Fed spokeswoman Adriana Kugler expressed support for the recent decision to implement a half-percentage point rate cut but remained non-committal about future monetary policy directions. Meanwhile, Atlanta Fed President Raphael Bostic cautioned against hastening rate reductions, suggesting that the Fed has the luxury of time before making further adjustments.
These mixed signals from Fed officials highlight a lack of consensus among fiscal policymakers, reflecting the complexity of current economic conditions.
Despite initial gains this month, the US dollar faced another downturn towards the week's end, marking its third consecutive day of declines—a pattern extending into a fourth session.
EUR/USD Technical Analysis
The EUR/USD pair found support at 1.1121 and subsequently formed a growth wave peaking at 1.1188. Currently, the market is shaping a broad consolidation pattern around 1.1155. Today's analysis suggests a potential continuation of the growth wave towards 1.1222, followed by a retest of 1.1155 from above. If successful, the range could expand further to 1.1290. The MACD indicator supports this bullish outlook, with its signal line positioned above zero and pointing upwards, indicating that growth potential remains robust.
the hourly chart, after completing a growth phase to 1.1164 and a correction to 1.1125, the market initiated another upward impulse to 1.1188. Currently, a corrective move to 1.1150 is underway. Upon reaching this level, the potential for a new growth wave to 1.1189 will be evaluated. A breakthrough above this level could signal a continuation of the upward trend towards 1.1222. This scenario is corroborated by the Stochastic oscillator, whose signal line is below 50 and poised to drop towards 20, suggesting a temporary pullback before further gains.
Eurozone economic sentiment dips slightly to 96.2
Eurozone Economic Sentiment Indicator fell slightly from 96.5 to 96.2 in September. Employment Expectations Indicator ticked up from 99.4 to 99.5. Economic Uncertainty Indicator rose from 17.5 to 17.8. Industry confidence fell from -9.9 to -10.9. Services confidence rose from 6.4 to 6.7. Consumer confidence rose from -13.4 to -129. Retail trade confidence fell from -7.9 to -8.5. Construction confidence rose from -6.3 to -5.8.
EU Economic Sentiment Indicator was unchanged at 96.7. For the largest EU economies, the ESI worsened markedly in France (-1.4) and Germany (-1.2), while it improved significantly in Poland (+2.0), Spain (+1.9), Italy (+1.2) and, more moderately, in the Netherlands (+0.5).
Crypto Market and Bitcoin Break the Months-Long Downtrend
Market Picture
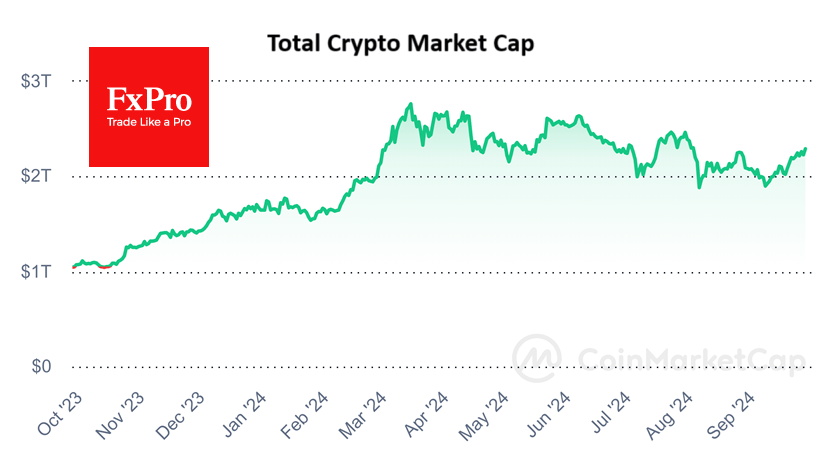
The cryptocurrency market went on to break previous peaks at the end of August, adding over 2.8% in 24 hours to reach 2.29 trillion, a high of almost two months. This rise confirmed the breakdown of the downtrend from the March peak after a higher local low in August. We foresee an easier climb up to previous pivot levels near 2.4 trillion, 4.8% above current prices.
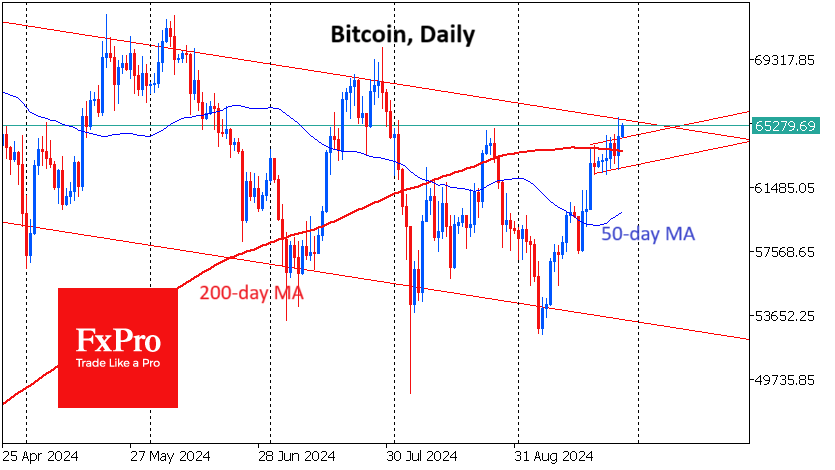
Bitcoin, formerly the growth engine of the crypto market due to risk appetite in traditional finance, also made an important technical breakout. BTCUSD has consolidated above its 200-day moving average, broken local consolidation resistance, and is above the previous area of highs, having risen to $65.3K at the time of writing. The ability to break above $66K in the coming days would signal a move to all-time highs in the coming weeks.
News Background
In another recalculation, the first cryptocurrency’s mining difficulty decreased by 4.6% to 88.4T. The average hashrate for the period since the previous value change was 740.3 EH/s.
A decrease in the inverted US government bond curve after the Fed rate cut creates conditions for strengthening positions in risk assets, including bitcoin, Standard Chartered believes. Positive expectations are supported by an increase in open interest in call options maturing on 27 December with a strike price of $100,000.
CoinShares said in a report that Ethereum’s investment potential remains unclear. Ethereum’s growth is largely dependent on transactional demand for the asset, but so far, on-chain activity has focused mainly on speculation. The popularity of L2 solutions in recent years has ‘absorbed’ demand for the underlying network asset.
Payments giant PayPal has opened the ability for corporate customers in the US to buy, store and sell cryptocurrencies directly from their business accounts. Business account holders can also make external transfers of coins in the blockchain to third-party wallets.
On 26 September, crypto exchanges started trading Hamster Kombat token (HMSTR), a native cryptocurrency of the Telegram game of the same name, issued on the TON blockchain. The trading volume of HMSTR exceeded $150 million in the first half an hour. The cryptocurrency Wallet built into Telegram failed to cope with the load on the TON network and stopped loading. The Hamster Kombat team presented plans for the game’s development in the coming months. The developers promised new games, NFT and token burning.
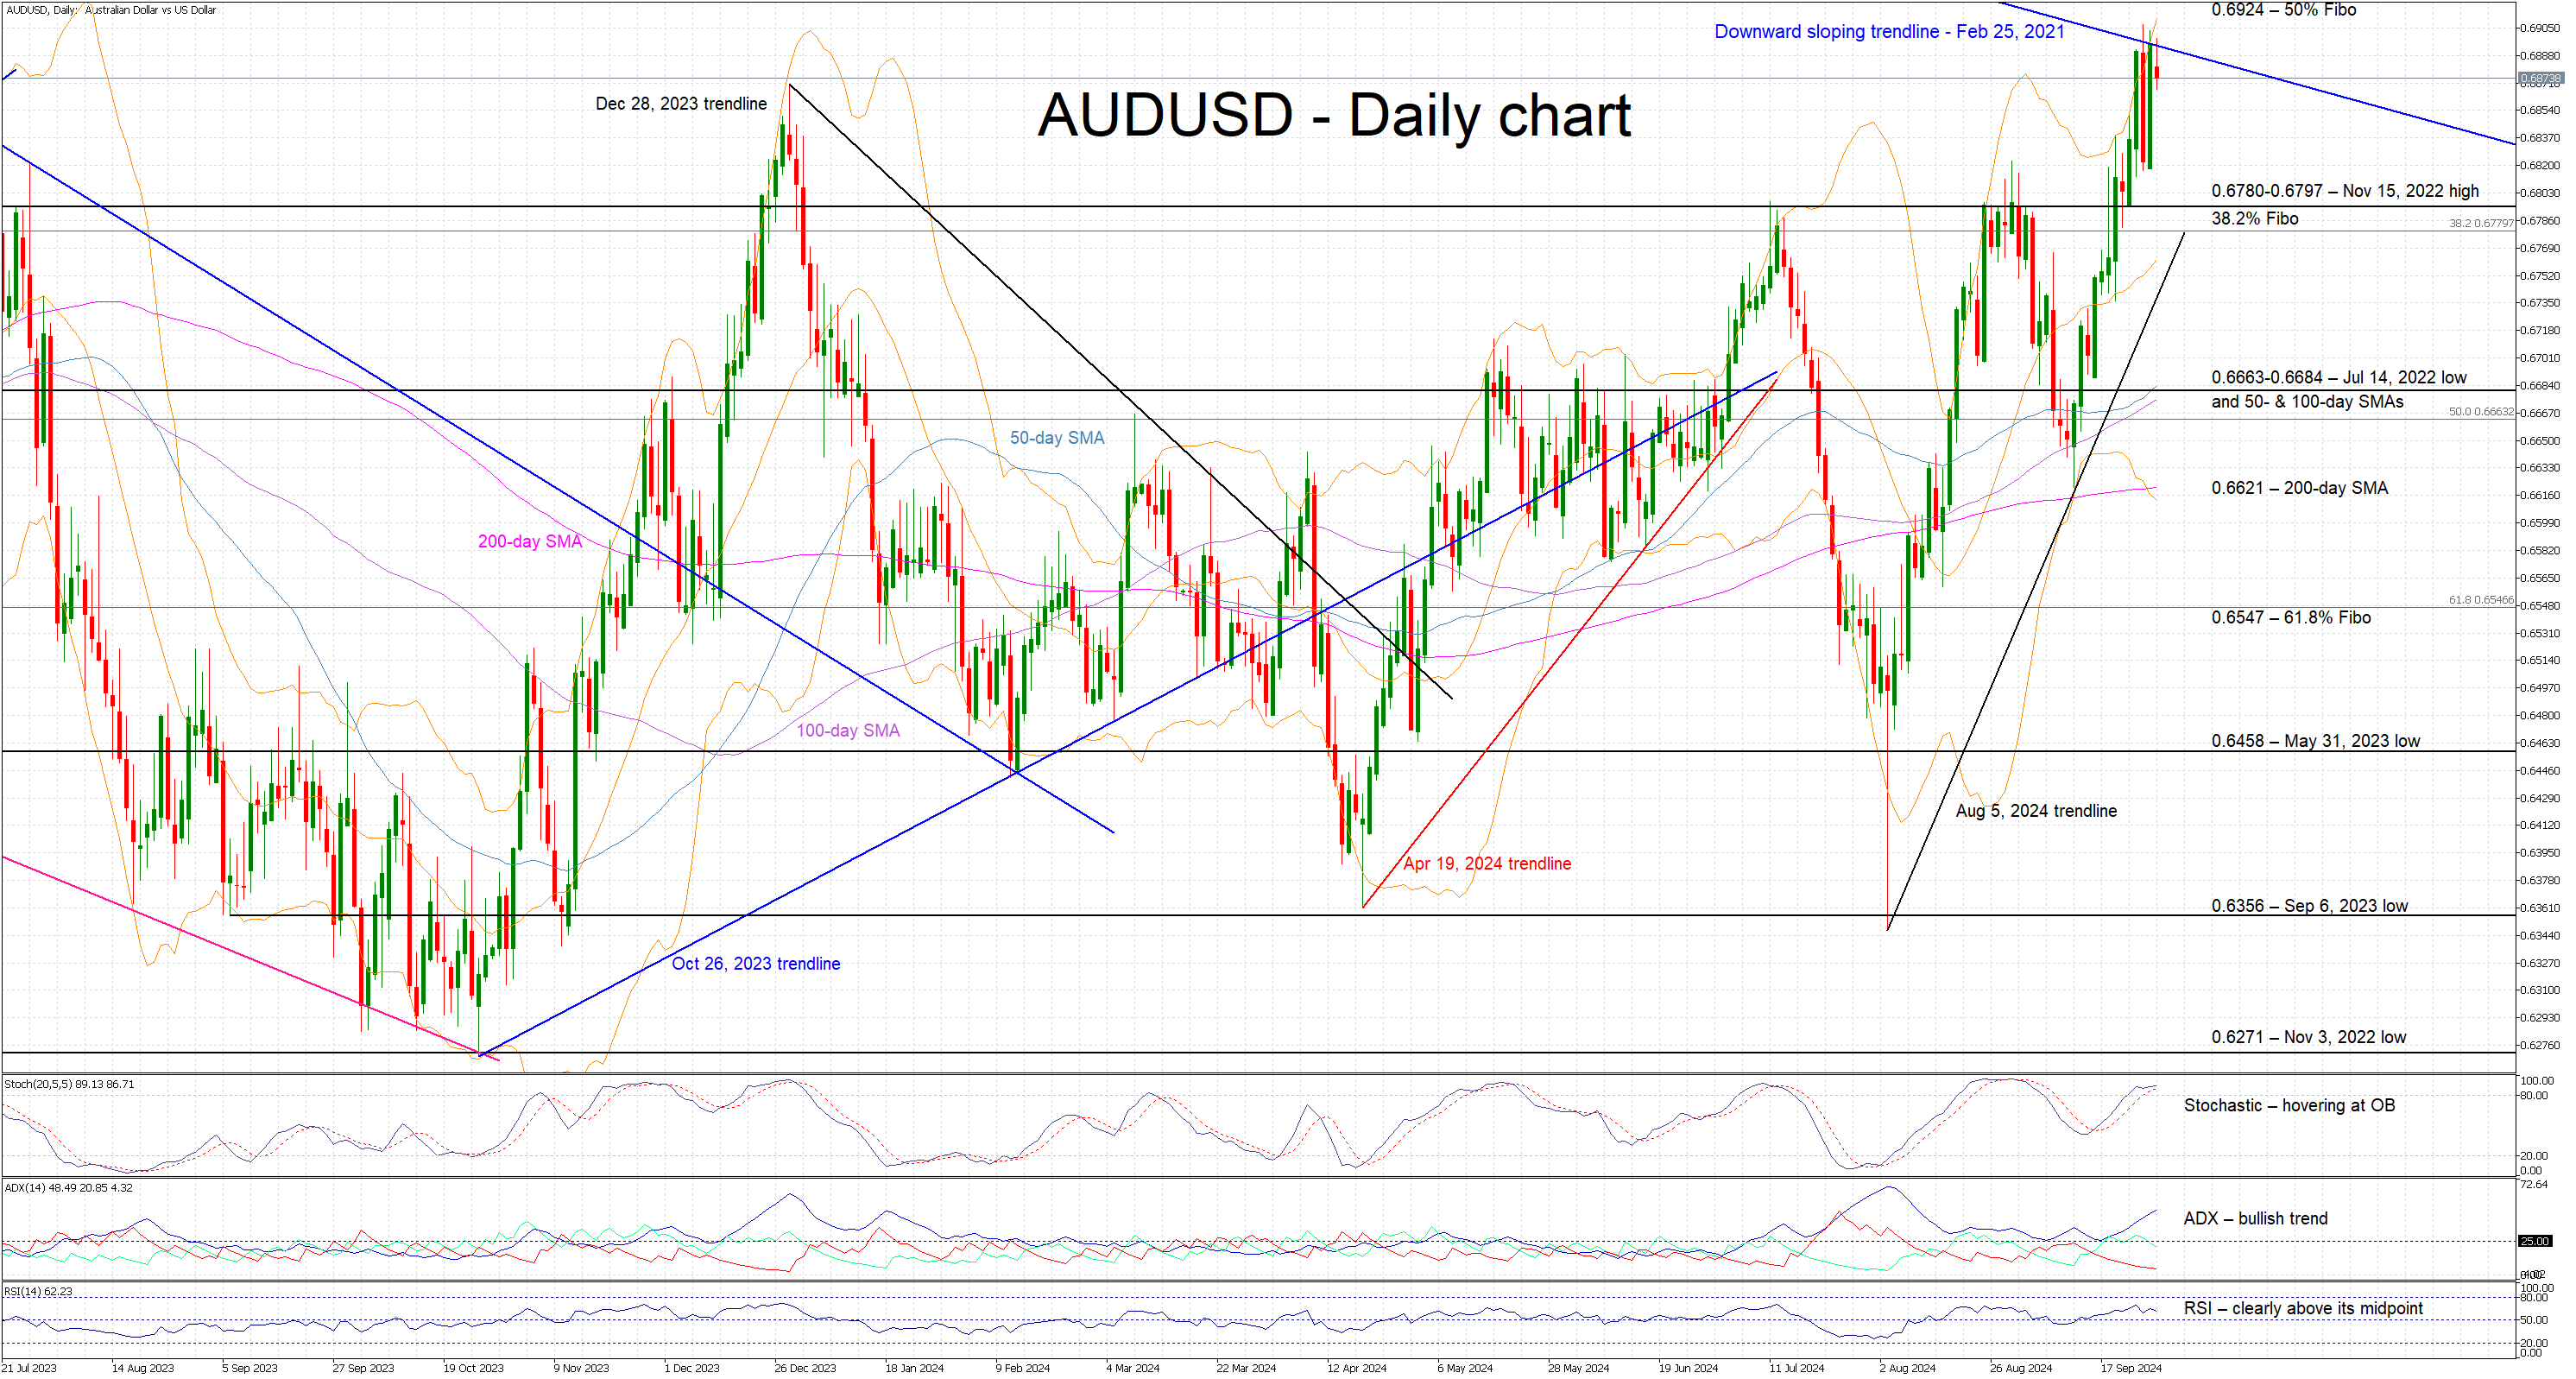
Will AUDUSD Rally Pause Prove Temporary?
- AUDUSD continues to experience high volatility
- It tests the resistance set by a long-term trendline
- Momentum indicators send a mixed message
AUDUSD is trading sideways today, following three very volatile sessions that pushed it to the highest level since February 2023. It is currently testing the resistance set by the February 25, 2021 downward sloping trendline, with today’s US PCE report potentially proving pivotal in the outcome of this battle. In the meantime, the bullish trend that started on August 5, 2024 remains firmly in place and it is supported by a series of higher highs and higher lows.
The momentum indicators are mixed at this juncture. In more detail, the Average Directional Movement Index (ADX) is edging aggressively higher and thus signalling a strong bullish trend in AUDUSD, while the RSI is comfortably trading above its 50-midpoint. Interestingly, the stochastic oscillator is hovering inside its overbought territory, but it has failed, up to now, to record a higher high. This developing bearish divergence could threaten the prevailing bullish trend.
Should the bulls remain confident, they could try to push AUDUSD above the February 25, 2021 trendline. If successful, they could then test the 50% Fibonacci retracement level of the October 13, 2022 – February 2, 2023 uptrend at 0.6924. Even higher, the 0.7000 level could be the next plausible target.
On the flip side, the bears may try to regain market control by keeping AUDUSD below the February 25, 2021 trendline, and then gradually pushing it towards the busy 0.6780-0.6797 area. This is populated by the November 15, 2022 high and the 38.2% Fibonacci retracement. A break below the August 5, 2024 trendline could then open the door to a retest of the 0.6663-0.6684 region, and give bears the chance to break the recent series of higher lows.
To sum up, AUDUSD bulls have benefited from RBA’s relative hawkishness, but another upleg needs fresh catalysts like a weak US PCE report.