
Sample Category Title
Swiss Franc Eyes Swiss CPI and GDP
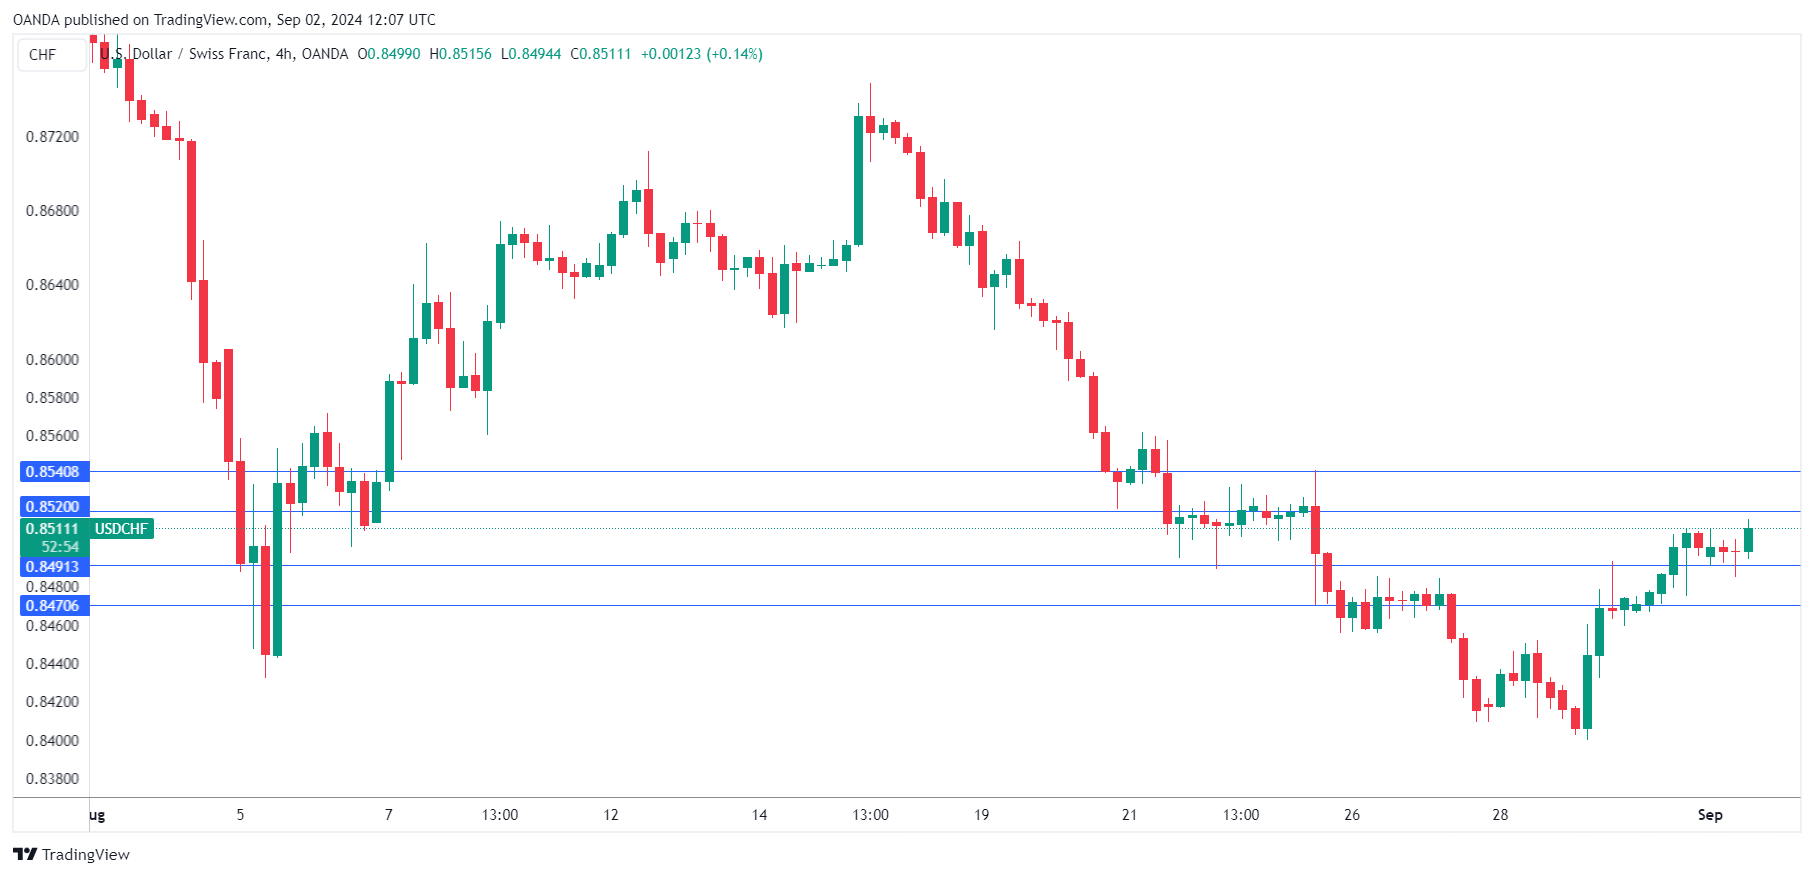
The Swiss franc has edged higher on Monday. USD/CHF is currently trading at 0.8514, up 0.16% on the day. With US markets closed for Labor Day, we’re unlikely to see much movement from the US dollar today.
Swiss retail sales rebounds
Switzerland’s retail sales for July surprised on the upside, with an impressive gain of 2.7% y/y. This crushed the market estimate of -0.2% and followed a revised 2.6% decline in June. It was the first increase since April and the fastest pace since February 2022. Monthly, retail sales rebounded with a 1.4% gain, up from a revised -0.3% and the market estimate of -0.2%.
The strong retail sales report failed to move the Swiss franc and investors have shifted focus to Tuesday’s inflation report. Inflation is expected to tick lower to 1.2% y/y in August, compared to 1.3% in July. Monthly, inflation is projected to rise to 0.1%, up from -0.2% in July.
The Swiss National Bank has kept inflation within its target of between zero and 2%, although it is keeping a concerned eye on the Swiss franc, which has surged 7.5% against the sagging US dollar since May 1. The Swissy sharp appreciation has kept inflation in check and the central bank has responded by trimming rates twice this year, bringing the cash rate to 1.25%.
The downside of a strong Swiss franc is that it makes Swiss exports more expensive. On Thursday, the Swiss franc dropped to 0.8400, its lowest level since Jan.2. If the Swiss franc’s continues to rise, the SNB could respond by intervening in the currency markets and blunt the upward swing.
Switzerland’s economy is expected to rise 0.5% in the second quarter, unchanged from the first quarter. The Q1 gain was the fastest expansion since the second quarter of 2022 and the service sector continues to drive the economy. Annually, the economy is expected to climb 0.9% in the second quarter, up from 0.6% in Q1.
USD/CHF Technical
- 0.8520 is a weak resistance line. Above, there is resistance at 0.8541
- 0.8491 and 0.8470 are providing support
USD/JPY Mid-Day Outlook
Daily Pivots: (S1) 145.13; (P) 145.69; (R1) 146.72; More...
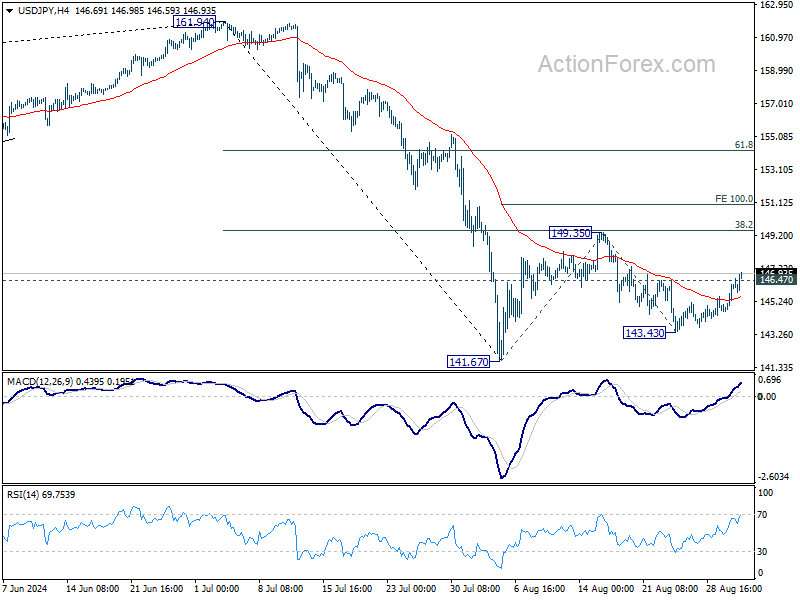
USD/JPY's break of 146.47 resistance suggests that pull back from 149.35 has already completed at 143.43. More importantly, rebound from 141.67 could be ready to resume. Intraday bias is back on the upside for 149.35 resistance first. Firm break there will target 100% projection of 141.67 to 149.35 from 143.43 at 151.11, as the second leg of the corrective pattern from 161.94 high. For now, risk will stay on the upside as long as 143.43 support holds, in case of retreat.
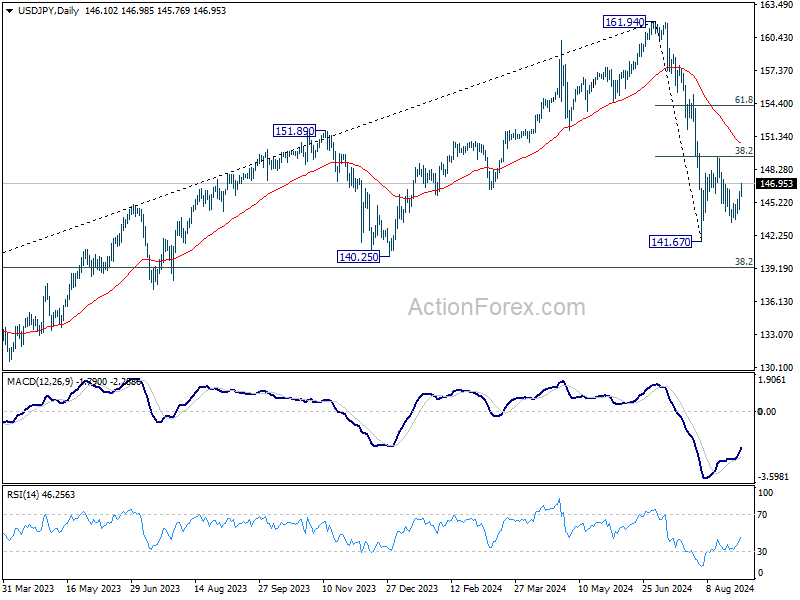
In the bigger picture, fall from 161.94 medium term top is seen as correcting whole up trend from 102.58 (2021 low). Deeper decline could be seen to 38.2% retracement of 102.58 to 161.94 at 139.26, which is close to 140.25 support. In any case, risk will stay on the downside as long as 55 W EMA (now at 149.47) holds. Nevertheless, firm break of 55 W EMA will suggest that the range for medium term corrective pattern is already set.
Yen Slide Intensifies, More Downside Likely Ahead
In relatively quiet market environment, Japanese Yen is coming under increasing pressure, with notable selloff driven by rising benchmark yields in the US and Europe. With major European stock indexes largely flat and the US and Canadian markets closed for a holiday, the Yen's decline has gained momentum. Several Yen crosses have broken near term resistance levels, signaling that the currency's weakness could extend further until markets fully reopen and liquidity improves tomorrow.
This week, while the spotlight remains on US non-farm payrolls report, significant attention will also be directed toward Switzerland's economic data, including CPI and GDP figures set to be released tomorrow. These data points are crucial as SNB is expected to cut interest rates for the third consecutive meeting on September 26. However, the magnitude of this rate cut is uncertain and will heavily depend on whether the Swiss economy can sustain its growth momentum in the second quarter.
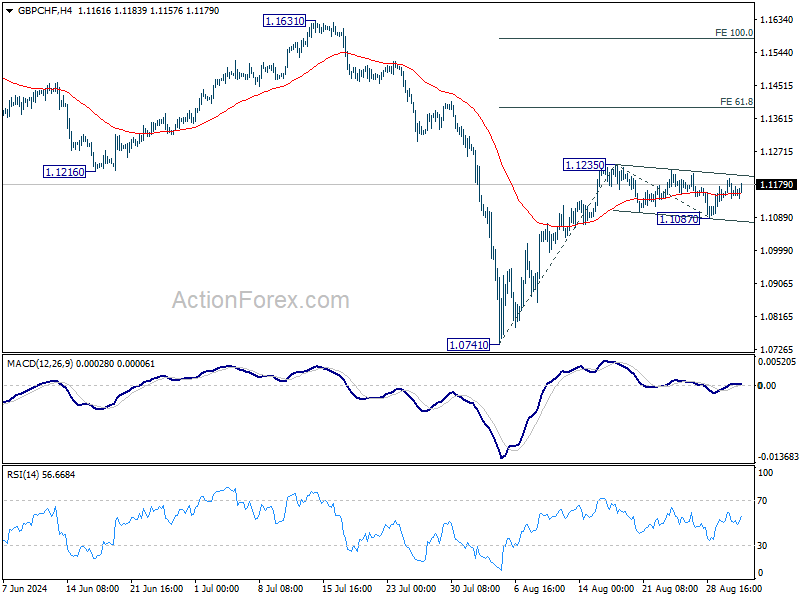
Technically, GBP/CHF's price actions from 1.1235 are clearly corrective. It's plausible that the pullback has completed with three waves down to 1.1087 already. Break of 1.1235 will resume the whole rebound from 1.0741 to 61.8% projection of 1.0741 to 1.1235 from 1.1087 at 1.1139 in the near term.
In Europe, at the time of writing, FTSE is down -0.07%. DAX is down -0.07%. CAC is down -0.03%. UK 10-year yield is up 0.020 at 4.028. Germany 10-year yield is up 0.029 at 2.332. Earlier in Asia, Nikkei rose 0.14%. Hong Kong HSI fell -1.65%. China Shanghai SSE fell -1.10%. Singapore Strait Times rose 0.59%. Japan 10-year JGB yield is up 0.0182 at 0.912.
UK PMI manufacturing finalized at 26-month high, strong domestic demand but export challenges persist
UK PMI Manufacturing was finalized at 52.5 in August, up from July's 52.1, and 26-month high. Growth was broad-based across sectors, with strong domestic demand driving new contract wins. This domestic strength helped offset the continued decline in export orders, which have been falling steadily since early 2022.
Rob Dobson, Director at S&P Global Market Intelligence, noted that manufacturing remained a "positive contributor" to the UK economy, with solid growth in output, new orders, and the strongest job creation in over two years. The investment goods sector led the upturn.
However, the sector faces ongoing challenges in exports, with weaker demand from Europe and China, along with issues like freight delays, high shipping costs, and political uncertainty, hampering overseas sales.
These challenges are also disrupting supply chains, leading to longer delivery times and driving up input costs, which saw another sharp increase in August.
Eurozone PMI manufacturing finalized at 45.8, decline persists with rising prices adding pressure on ECB
Eurozone's manufacturing sector remains entrenched in contraction, with PMI Manufacturing index finalized at 45.8 in August, unchanged from July's reading. This marks the third consecutive month of significant decline, indicating that the sector is still mired in a prolonged downturn. Despite a continued drop in new orders, both domestic and international, goods prices have risen for the first time since April 2023, adding to the growing challenges faced by ECB.
Country-specific PMI data reveals mixed performance. Greece led the pack with a PMI of 52.9, although this marked an eight-month low. Spain and Ireland managed to stay slightly above the neutral 50.0 mark, with readings of 50.5 and 50.4, respectively, but both hit multi-month lows. On the other hand, Italy's PMI improved to 49.4, its highest in five months, although it remains in contraction. France reported a 7-month low of 43.9 while Germany recorded a PMI of 42.4, a 5-month low.
Cyrus de la Rubia, Chief Economist at Hamburg Commercial Bank, noted the worsening conditions, stating, "Things are going downhill, and fast." The manufacturing sector has now been in recession for a grueling 26 months, with no immediate signs of recovery. The persistent decline in new orders has dashed hopes of a near-term rebound, while the recent uptick in input prices since June suggests that the deflationary phase in the goods sector may be ending.
For the first time since April 2023, selling prices in the manufacturing sector have risen, driven by increases in countries like France, the Netherlands, Greece, and Italy. This development could complicate ECB's efforts to control inflation, as the central bank has been relying on falling manufacturing prices to offset persistent inflationary pressures in the services sector.
Japan's PMI manufacturing finalized at 49.8, close to stabilization amid rising cost burdens
Japan's Manufacturing PMI for August was finalized at 49.8, showing a slight improvement from July's 49.1, but still indicating a marginal contraction. S&P Global noted that the sector is moving closer to stabilization, with a renewed rise in production. This marks the first increase in purchasing activity in two years.
According to Usamah Bhatti at S&P Global Market Intelligence, the latest figures paint a "mixed picture" as the sector hovers near stabilization. The renewed rise in production and a softer decline in new orders have encouraged firms to increase staffing levels, while the pace of destocking has slowed. Additionally, there have been signs of improved supplier performance, particularly in the availability of inputs like electrical components.
However, the data also pointed to significant cost pressures, with the strongest rise in input costs since April 2023. Despite this, companies have been reluctant to pass these higher costs onto customers fully, leading to the slowest rate of charge inflation since mid-2021.
China's Caxin PMI manufacturing rises to 50.4, modest return to expansion
China's Caixin PMI Manufacturing rose slightly in August, reaching 50.4 from July's 49.8, signaling a modest return to expansion. The improvement reflects faster output growth and stabilization in employment after an 11-month decline. Meanwhile, average selling prices and input costs continued to decline, indicating ongoing deflationary pressures within the sector.
Wang Zhe, Senior Economist at Caixin Insight Group, noted that while PMI manufacturing returned to expansionary territory, the growth remains "limited". He highlighted the significant challenges China faces in stabilizing its economic growth, particularly given the government's ambitious annual targets. Key issues include weak domestic demand, uncertainties in external demand, and low market optimism, all of which could hinder sustained growth.
In contrast, the official NBS data released over the weekend painted a more subdued picture. NBS PMI Manufacturing fell from 49.5 to 49.1 in August, indicating a deeper contraction in the sector. While PMI Non-Manufacturing ticked up slightly from 50.1 to 50.3, the PMI Composite dropped for the fifth consecutive month, landing at 50.1—the lowest since December 2022.
NBS statistician Zhao Qinghe attributed the decline in manufacturing to several factors, including extreme weather, off-season production in certain industries, insufficient demand, and fluctuations in commodity prices.
USD/JPY Mid-Day Outlook
Daily Pivots: (S1) 145.13; (P) 145.69; (R1) 146.72; More...
USD/JPY's break of 146.47 resistance suggests that pull back from 149.35 has already completed at 143.43. More importantly, rebound from 141.67 could be ready to resume. Intraday bias is back on the upside for 149.35 resistance first. Firm break there will target 100% projection of 141.67 to 149.35 from 143.43 at 151.11, as the second leg of the corrective pattern from 161.94 high. For now, risk will stay on the upside as long as 143.43 support holds, in case of retreat.
In the bigger picture, fall from 161.94 medium term top is seen as correcting whole up trend from 102.58 (2021 low). Deeper decline could be seen to 38.2% retracement of 102.58 to 161.94 at 139.26, which is close to 140.25 support. In any case, risk will stay on the downside as long as 55 W EMA (now at 149.47) holds. Nevertheless, firm break of 55 W EMA will suggest that the range for medium term corrective pattern is already set.
Economic Indicators Update
| GMT | Ccy | Events | Actual | Forecast | Previous | Revised |
|---|---|---|---|---|---|---|
| 23:50 | JPY | Capital Spending Q2 | 7.40% | 9.90% | 6.80% | |
| 00:30 | JPY | Manufacturing PMI Aug F | 49.8 | 49.5 | 49.5 | |
| 01:30 | AUD | Company Gross Operating Profits Q/Q Q2 | -5.30% | -0.40% | -2.50% | |
| 01:30 | AUD | Building Permits M/M Jul | 10.40% | 2.40% | -6.50% | -6.40% |
| 01:45 | CNY | Caixin Manufacturing PMI Aug | 50.4 | 50 | 49.8 | |
| 06:30 | CHF | Retail Sales Y/Y Jul | 2.70% | -0.20% | -2.20% | -2.60% |
| 07:30 | CHF | Manufacturing PMI Aug | 49.0 | 43.7 | 43.5 | |
| 07:50 | EUR | France Manufacturing PMI Aug F | 43.9 | 42.1 | 42.1 | |
| 07:55 | EUR | Germany Manufacturing PMI Aug F | 42.4 | 42.1 | 42.1 | |
| 08:00 | EUR | Eurozone Manufacturing PMI Aug F | 45.8 | 45.6 | 45.6 | |
| 08:30 | GBP | Manufacturing PMI Aug F | 52.5 | 52.5 | 52.5 |
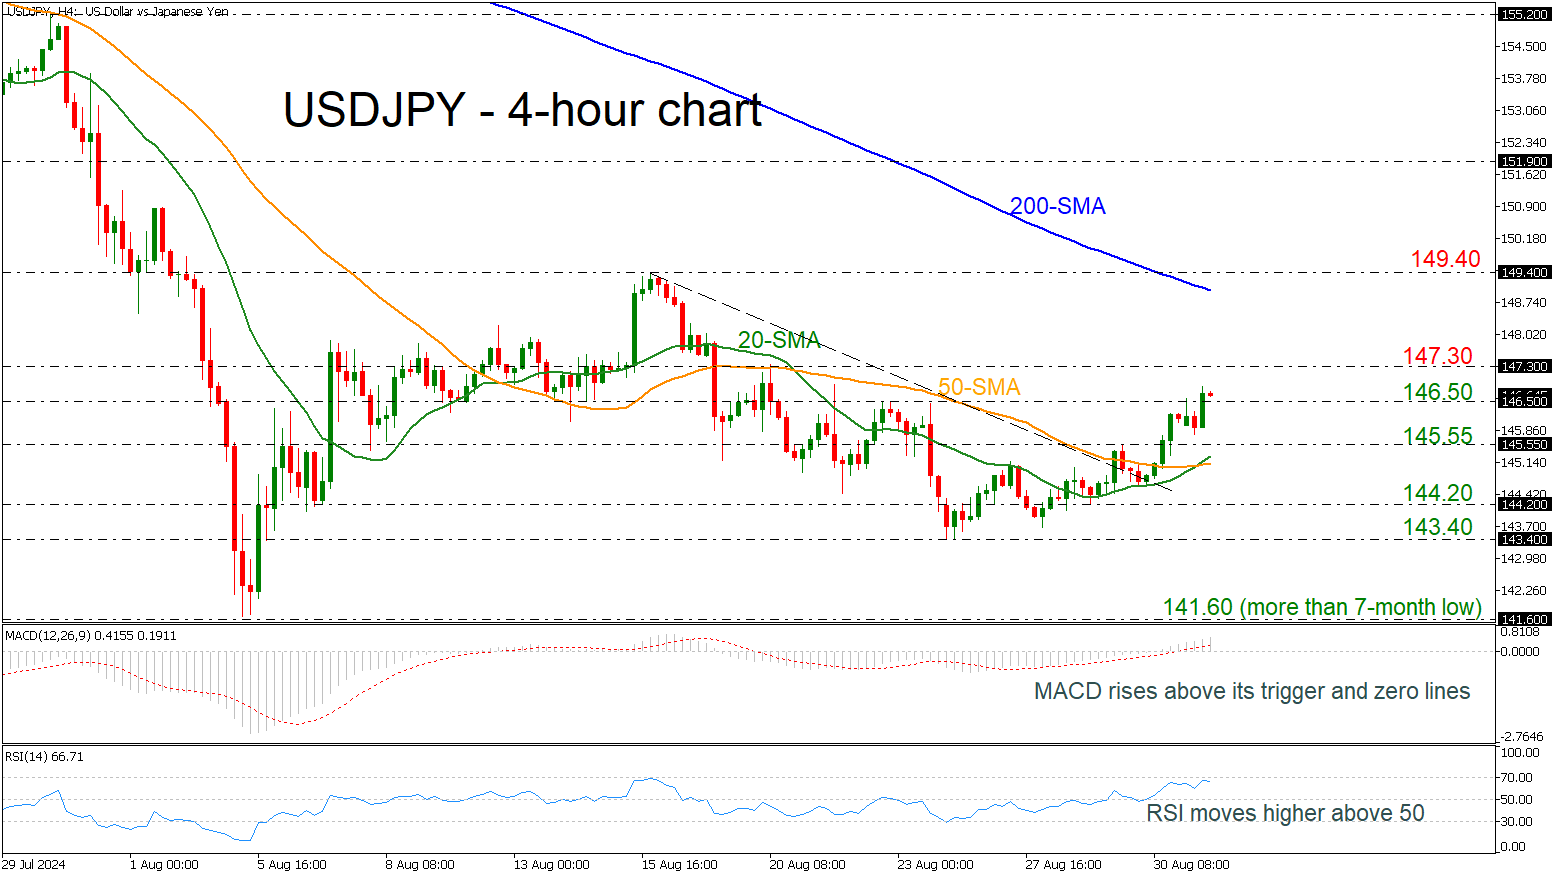
USDJPY in Bullish Mode in Very Short-Term
- USDJPY rises above downtrend line
- MACD stands well above its trigger line
- 20- and 50-period SMAs post bullish cross
USDJPY advanced considerably in the previous 4-hour session, surpassing the 146.50 barricade.
Also, the 20- and 50-period simple moving averages (SMAs) posted a bullish crossover, and the technical oscillators are holding well above their mid-levels. The MACD oscillator currently stands above its trigger and zero lines, strengthening its positive momentum, while the RSI is flattening near the 70 level.
Immediate resistance could come from the 147.30 mark before rallying towards the 200-period SMA at 149.00. Slightly higher, the previous peak at 149.40 may halt upside actions.
On the other hand, a tumble beneath the 145.55 support could meet the bullish cross of the SMAs around 145.00 before battling with 144.20 and 143.40.
All in all, USDJPY has been in a bullish mode after the penetration of the short-term descending trend line to the upside on Friday.
AUD/USD: Recent Rally of Aussie Dollar May Face a Ceiling Below 0.6900
- The recent 7.4% rally in the AUD/USD from its 5 August 2024 low has been driven by a resurgence of risk-on behaviour and the US Fed’s dovish pivot.
- Weak China’s manufacturing PMI data and housing market are likely to be in the driving seat now to potentially dictate the sentiment of the AUD/USD.
- Further weakness in Iron Ore futures prices may trigger a negative feedback loop into AUD/USD.
- Watch the key medium-term resistance of 0.6900 on the AUD/USD with intermediate supports at 0.6700 and 0.6600.
After the global risk-off episode that occurred from mid-July to 5 August, the Aussie dollar has managed to recover all its losses against the US dollar in the same period.
The AUD/USD, being a higher-beta play among the FX majors rose by 7.4% from its 5 August low of 0.6348 to print a recent high of 0.6824 on 29 August reinforced by a clear switch of monetary policy stance by the US Federal Reserve from “hawkish-higher for longer” to “dovish-time has come for policy to adjust” ex-post Fed Chair Powell’s 23 August Jackson Hole Symposium speech that cemented a potential upcoming 25 basis points cut to the Fed funds rate on the 18 September FOMC meeting.
Weak macro data from China is in the limelight again
The latest China NBS Manufacturing PMI data for August has pointed to a fourth consecutive month of contraction in manufacturing activities, it slipped further to 49.1 from 49.4 in July, below the consensus of 49.5.
Its new orders subcomponent declined at a slightly higher magnitude from 49.30 in July to 48.90 in August which is an alarming cause of concern as a significant portion of China’s economic growth so far in 2024 has been driven by external demand and top policymakers’ heavily allocation of state resources towards China’s high tech industrialization programme.
If China’s manufacturing activities languish at this rate in Q4, it is unlikely that China can meet its 5% annualized economic growth target for 2024. In addition, a weak state of manufacturing production coupled with the housing market in China that is still not showing any clear signs of stabilization from a persistent trend of negative growth rates (value of new-home sales from the 100 biggest real estate firms plunged to 26.8% y/y in August from -19.7% in July), there is likely less demand for industrial metals such as iron ore.
Iron ore prices have moved in direct lockstep with AUD/USD
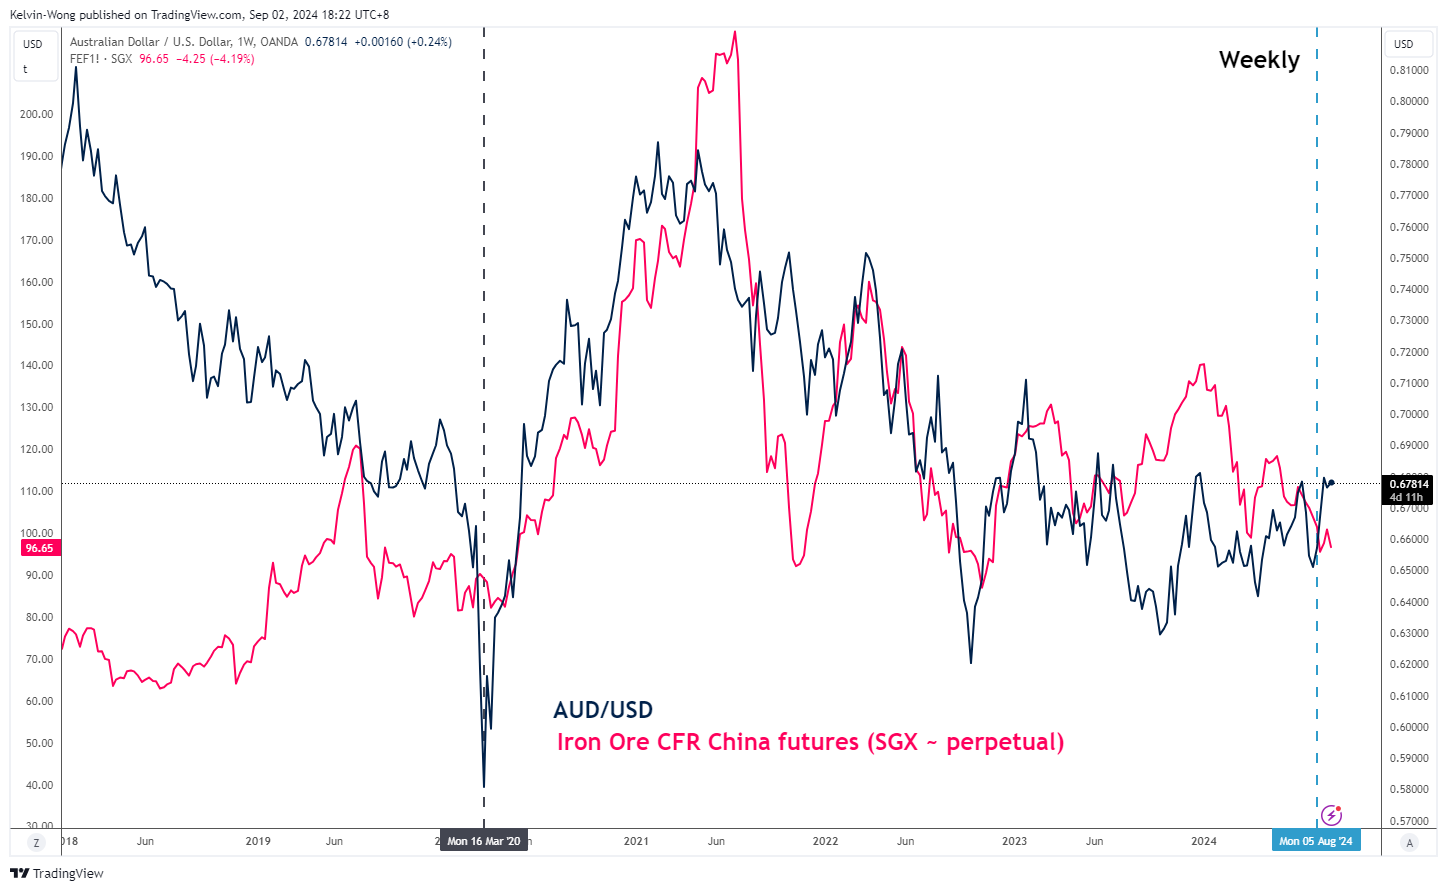
Fig 1: AUD/USD & Iron Ore futures correlation movement as of 2 Sep 2024 (Source: TradingView, click to enlarge chart)
Given that iron ore is one of Australia’s key resource exports and a significant portion of it goes to China; if China’s economic growth languishes, there will be likely less demand for iron ore, in turn, put downside pressure on Australia’s trade balance that may trigger a negative feedback loop into the AUD/USD.
Since March 2020, the movement of the Iron Ore CFR China futures contract listed on the Singapore Exchange has a positive correlation with the AUD/USD. However, this positive correlation flipped to negative for a short period recently from 5 August to 29 August due to the resurgence of global risk-on behaviour (see Fig 1).
Given that China’s lacklustre economic growth narrative is back on the radar screen again, the Iron Ore CFR China futures contract (SGX) has declined by -4.2 % today at this time of the writing, its longer-term positive correlation movement with AUD/USD may come back to influence the movement of the Aussie dollar.
AUD/USD rally has almost reached its 0.6900 major resistance
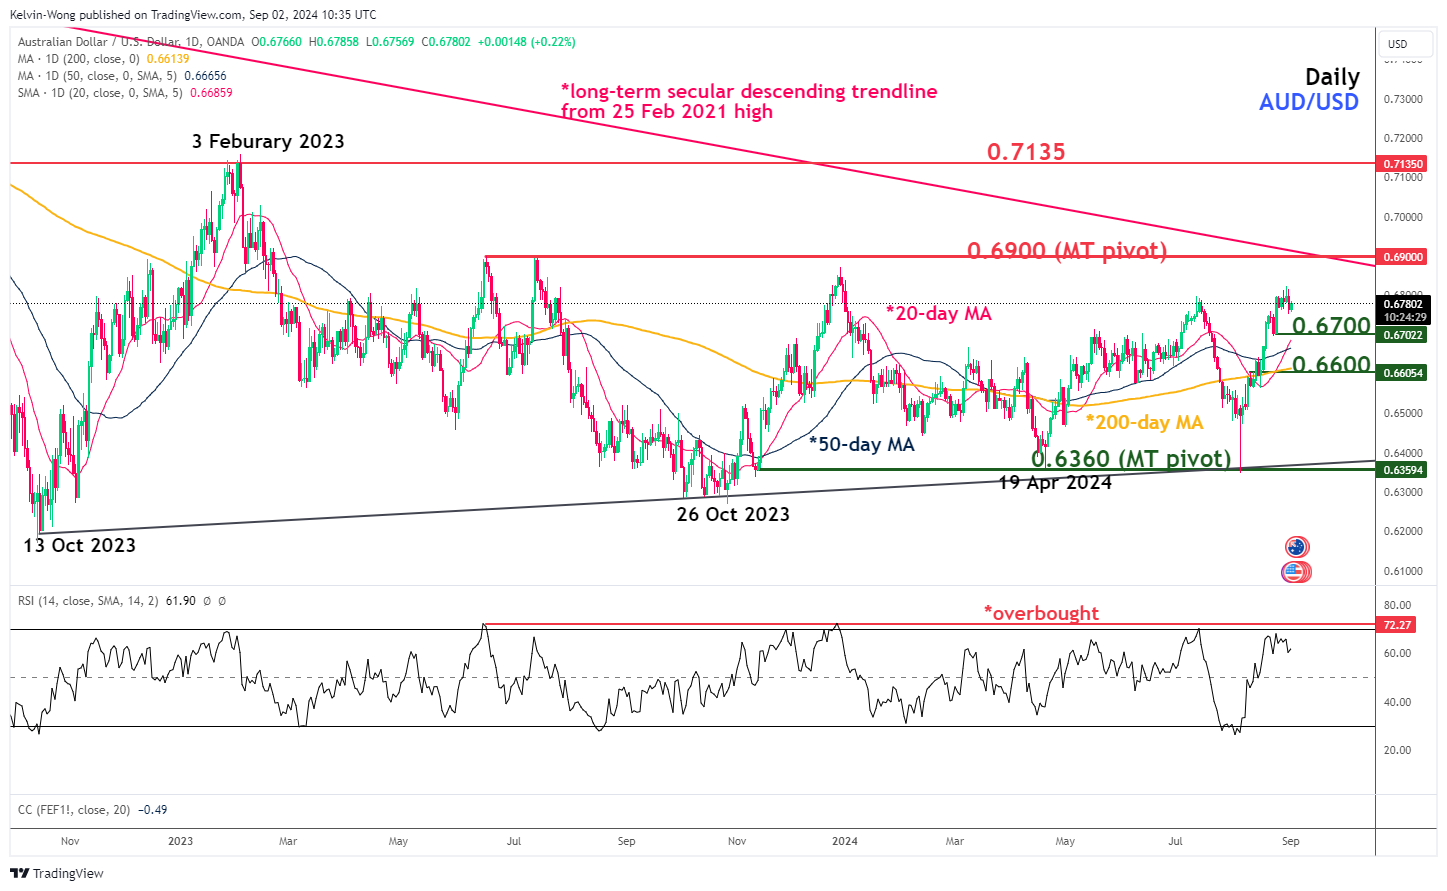
Fig 2: AUD/USD major & medium term trends as of 2 Sep 2024 (Source: TradingView, click to enlarge chart)
The recent rally of 7.4% from its 5 August low seen in AUD/USD has now almost reached a major resistance of 0.6900 (the medium-term swing highs of 16 June/13 July 2023 and long-term secular descending trendline from 25 February 2021 high).
In addition, the daily RSI momentum indicator has almost hit an overbought level of 72 which has capped prior advances of the AUD/USD since 15 June 2023.
If the 0.6900 key medium-term pivotal resistance is not surpassed to the upside, the AUD/USD may see a mean reversion decline scenario unfolding to expose the next intermediate supports at 0.6700 and 0.6600 (also the 200-day moving average) (see Fig 2).
However, a clearance above 0.6900 invalidates the bearish scenario on the AUD/USD for the next intermediate resistance to come in at 0.7135.
Australian Dollar Declines Amid US Dollar’s Strength
The AUD/USD pair dropped significantly to 0.6764 at the start of the week, primarily driven by a strengthening US dollar rather than an inherent weakness in the Australian dollar itself. This shift in the currency pair’s dynamics is primarily attributed to the latest Core PCE inflation data released last Friday, which moderated market expectations regarding the pace of future interest rate adjustments by the Federal Reserve.
The market is now in a consolidation phase as it awaits vital US employment data for August, set to be released this Friday. This upcoming report is critical as it could influence the Federal Reserve’s decisions in the near term.
In August, the manufacturing sector in Australia continued to face challenges, with high loan servicing costs and subdued demand from both businesses and consumers acting as significant headwinds.
Investors also look forward to further insights from Reserve Bank of Australia (RBA) Governor Michelle Bullock. Recently, she indicated that it is premature to consider a relaxation of monetary policy due to persistently high inflation despite some signs of cooling. The minutes from the latest RBA meeting have echoed this sentiment, suggesting that the central bank may maintain a restrictive monetary policy stance for an extended period.
AUD/USD Technical Analysis
The AUD/USD is navigating the first wave of decline towards the level of 0.6743. There is an expectation that this target will be reached soon, followed by a corrective move to 0.6783 (testing from below). This would delineate the upper bounds of a consolidation range. Should the pair break downward from this range, a further decline to 0.6690 is anticipated. A breakout below this level could signal the start of a new downward trend towards 0.6640, potentially extending to 0.6555. The MACD indicator supports this bearish outlook with its high signal line directed downwards.
On the H1 chart, the pair is forming a downward wave structure targeting 0.6743. After achieving this level, a rebound to 0.6783 may occur, setting the stage for the next downward phase. This scenario is corroborated by the Stochastic oscillator, with its signal line preparing to drop from below 80 to around 20, indicating potential for continued declines.
News of the Week (September 2—September 6): USDCAD Trading Focus
USDCAD is setting up for significant market moves—stay alert!
The USDCAD pair, often referred to by traders as the “Loonie,” reflects the exchange rate between the US and Canadian dollars. This pair is a vital indicator of the economic ties between the United States and Canada. The US Dollar is primarily influenced by US economic data, such as employment figures, inflation rates, and Federal Reserve monetary policy decisions. On the other hand, the Canadian Dollar is strongly affected by global oil prices, given Canada’s position as a significant oil exporter, alongside domestic economic indicators like GDP growth and employment rates.
Canada Interest Rate Decision, Sep 04, 15:45 (GMT+2)
The upcoming interest rate decision in Canada is predicted to keep the current rate at 4.5%, indicating that the Canadian economy is stable. If the actual rate decision confirms this forecast and the rate remains unchanged, it could mean that the Bank of Canada (BoC) considers current economic conditions balanced, resulting in a neutral impact on the Canadian Dollar. Given that inflation is falling, this is unlikely. Still, if the Bank of Canada unexpectedly decides to raise rates, this would likely lead to a rise in the Canadian Dollar and a decline in the USDCAD pair. Conversely, if the Bank of Canada cuts rates, which would be a surprise move, it could signal concerns about economic growth or inflation, weakening the CAD.
US Nonfarm Payrolls, Sep 06, 14:30 (GMT+2)
The US NFP is expected to show an increase of 163k jobs, reflecting the potential strength of the US labor market. If the actual NFP data exceeds this forecast, indicating stronger job creation, this would strengthen the USDCAD. It would indicate solid economic growth and could lead to speculation that the Federal Reserve may consider continuing to keep the interest rate unchanged at current levels. On the other hand, if the NFP report fails to meet expectations and the number of jobs is less than 163k, it could raise concerns about the dynamics of the US economy, leading to a weaker USD as market participants expect a softer stance from the Federal Reserve.
On May 3, 2024, the US NFP release came in well below expectations. This event led to high volatility and a sharp collapse of USDCAD!
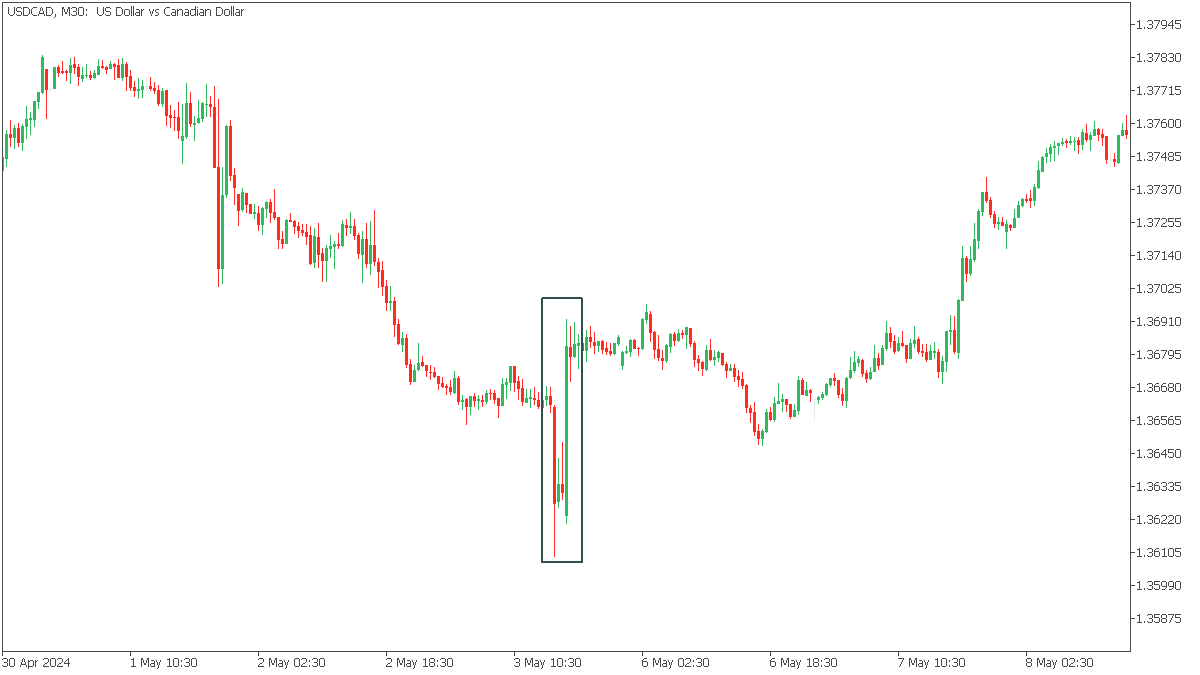
In the Daily timeframe, USDCAD fell sharply to the 61.8 Fibonacci support area after a long-term bullish trend. At the same time, the Stochastic indicates a large oversold condition, which creates two possible scenarios.
If the bears push the price below 1.3470 support, the decline will continue to 1.3370;
A rebound from support will bring USDCAD back to 1.3600 resistance and then to 1.3650, corresponding to 38.2 Fibonacci.

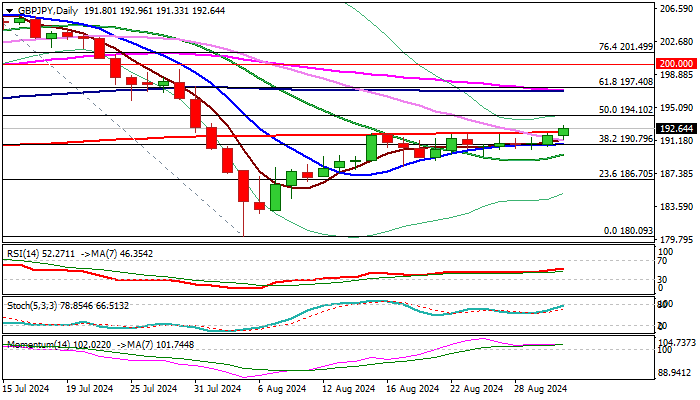
GBPJPY – Probe Above Pivotal 200DMA Generating Initial Signal of Bullish Continuation
GBPJPY rose to one-month high on Monday and generated initial signal of bullish continuation on probe above the top of month-long range (192.16) reinforced by 200DMA.
Firm break here to confirm signal and open way for fresh upside, with immediate target at 194.10 (50% retracement of 208.11/180.09 downtrend), violation of which to unmask next barriers at 197.00 zone.
Improving daily studies (Tenkan-sen / Kijun-sen bull-cross / strong positive momentum) contribute to brightening outlook, but reaction on 200DMA will key factor.
Caution on failure to clear 200DMA which would signal a false break higher and keep the price in extended sideways mode.
Res: 193.25; 194.10; 195.86; 196.92
Sup: 192.16; 191.33; 190.79; 189.60
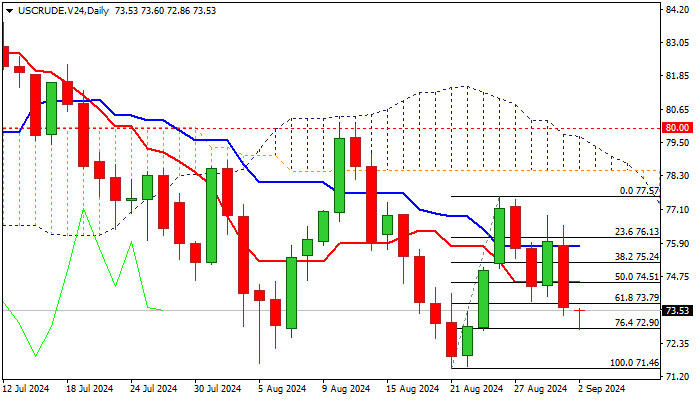
WTI Outlook: Oil Prices Remain Under Pressure on Demand Concerns, OPEC Production Increase
Oil price fell further in early Monday, in extension of Friday’s 3% drop (the biggest daily loss since Aug 14).
The sentiment weakened further on renewed concerns about demand from the US and China, partial reopening of Libya’s oil installation and decision from OPEC to increase production by 180,000 barrels per day in October, partially reversing their 2.2 million bpd.
Weak technical studies on daily chart (strong negative momentum / MA’s back to full bearish configuration) add to bearish near-term outlook.
Fresh weakness cracked pivotal Fibo support at $72.90 (76.4% of $71.46/$77.57 upleg), with firm break here to open way for retest of key support at $71.46 (Aug 21 low, the lowest since Feb 5).
Last week’s bearish candlestick with long upper shadow points to strong offers and adds to downside pressure, though Aug tight monthly Doji candle partially offsets negative signals.
Broken Fibo 61.8% support ($73.79) marks initial resistance, with extended upticks to be capped under daily Tenkan-sen / broken 50% retracement ($74.51) to keep larger bears in play.
Res: 73.79; 74.51; 75.24; 75.80.
Sup: 72.90; 72.19; 71.66; 71.46.
BTC/USD Analysis: Bitcoin Price at a Crossroads
On 9 August, our analysis of the long-term BTC/USD chart noted that Bitcoin's price was at a crossroads, moving within the bounds of two channels:
→ A bullish channel (shown in blue), which began forming in 2023 on the back of Bitcoin ETF approval rumours;
→ A bearish channel (shown in red), which started taking shape in March 2024, when the effect of Bitcoin ETF approval (which actually occurred on 11 January) seemed to have reached its peak, helping Bitcoin reach an all-time high.
Which path has the price taken?
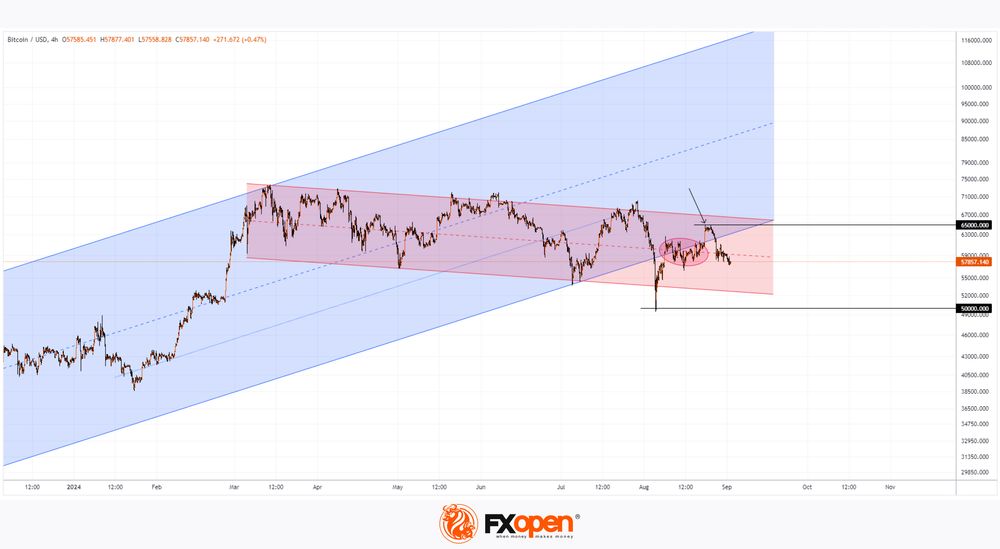
Current technical analysis of the BTC/USD chart indicates that bearish arguments are now more compelling:
→ Since 9 August, attempts to return to the bullish channel have been sporadic and lack continuity;
→ Conversely, the price shows signs of "magnetism" (shown in red oval) towards the median line of the descending channel, confirming its relevance;
→ The growth attempt on 23 August faced resistance at the psychological level of $65k (shown with an arrow).
The decline in BTC/USD in late August was further impacted by Binance’s freezing of accounts linked to Palestinian military groups, undermining Bitcoin's image as an anonymous and decentralised currency.
Under these conditions, it is reasonable to expect a bearish autumn, with more signs of weakness for buyers on the BTC/USD chart. It is possible that by the end of the year, we might see a new push towards the $50k level.
FXOpen offers the world's most popular cryptocurrency CFDs*, including Bitcoin and Ethereum. Floating spreads, 1:2 leverage — at your service. Open your trading account now or learn more about crypto CFD trading with FXOpen.
*At FXOpen UK and FXOpen AU, Cryptocurrency CFDs are only available for trading by those clients categorised as Professional clients under FCA Rules and Professional clients under ASIC Rules respectively. They are not available for trading by Retail clients.
This article represents the opinion of the Companies operating under the FXOpen brand only. It is not to be construed as an offer, solicitation, or recommendation with respect to products and services provided by the Companies operating under the FXOpen brand, nor is it to be considered financial advice.