Sample Category Title
Crypto Near August Bottom
Market Picture
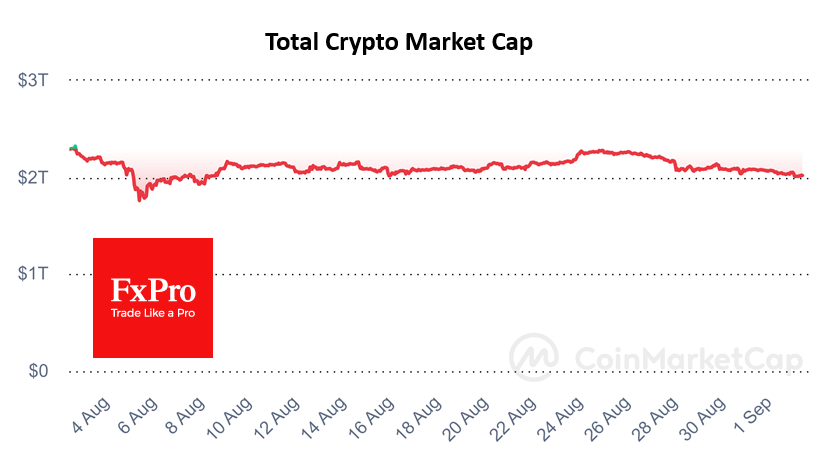
Crypto market capitalisation has fallen to $2 trillion, hitting lows since 8th August and losing almost 10% over the past seven days. The decline has slowed since the second half of last week, but the downtrend persists. The Cryptocurrency Fear and Greed Index fell to 26 (fear).
Bitcoin is trading around $57.5K, having been near the lower end of its trading range since 12th August. A break of this support, which has repeatedly attracted buyers since May, could accelerate the sell-off. The next important support in case of a decline will be the area of the lows of the trading range since March, around $54K.
Bitcoin ended August down 8.7% to $58,950, making it the cryptocurrency’s worst month since April. In terms of seasonality, September is considered the worst month of the year for BTC. Over the past 13 years, Bitcoin has ended the month up only four times and down nine times. The average decline was 12.7%, and the average rise was 9.5%.

News Background
According to SoSoValue, outflows from spot bitcoin-ETFs in the US totalled $277.1 million last week, the highest in 10 weeks. Cumulative inflows since BTC-ETFs were approved in January have fallen to $17.60bn.
The Ethereum-ETF saw negative performance for the third consecutive week, totalling $12.6m against $44.5m a week earlier. Net outflows since product approval rose to $477.3 million.
According to Kaiko, authorities in the US, China, the UK, and Ukraine may begin selling their Bitcoin holdings in September, which could bring the first cryptocurrency down to $53K.
According to CryptoQuant, the aggregate Bitcoin balance on centralised exchanges has updated the year’s lows. Experts believe this may indicate a reduction in selling pressure and the prerequisites for a resumption of the bull market if demand strengthens.
Bitcoin’s hash price (an indicator of mining profitability) is at an extremely low level. CryptoQuant analysts note that the hash price to asset price ratio is reminiscent of the period before the 2020 rally.
El Salvador Nayib Bukele said that a monetary experiment with legalising Bitcoin as a legal tender has had mixed results. According to him, BTC ‘has not received the widespread acceptance we had hoped for.’
UK PMI manufacturing finalized at 26-month high, strong domestic demand but export challenges persist
UK PMI Manufacturing was finalized at 52.5 in August, up from July's 52.1, and 26-month high. Growth was broad-based across sectors, with strong domestic demand driving new contract wins. This domestic strength helped offset the continued decline in export orders, which have been falling steadily since early 2022.
Rob Dobson, Director at S&P Global Market Intelligence, noted that manufacturing remained a "positive contributor" to the UK economy, with solid growth in output, new orders, and the strongest job creation in over two years. The investment goods sector led the upturn.
However, the sector faces ongoing challenges in exports, with weaker demand from Europe and China, along with issues like freight delays, high shipping costs, and political uncertainty, hampering overseas sales.
These challenges are also disrupting supply chains, leading to longer delivery times and driving up input costs, which saw another sharp increase in August.
Eurozone PMI manufacturing finalized at 45.8, decline persists with rising prices adding pressure on ECB
Eurozone's manufacturing sector remains entrenched in contraction, with PMI Manufacturing index finalized at 45.8 in August, unchanged from July's reading. This marks the third consecutive month of significant decline, indicating that the sector is still mired in a prolonged downturn. Despite a continued drop in new orders, both domestic and international, goods prices have risen for the first time since April 2023, adding to the growing challenges faced by ECB.
Country-specific PMI data reveals mixed performance. Greece led the pack with a PMI of 52.9, although this marked an eight-month low. Spain and Ireland managed to stay slightly above the neutral 50.0 mark, with readings of 50.5 and 50.4, respectively, but both hit multi-month lows. On the other hand, Italy's PMI improved to 49.4, its highest in five months, although it remains in contraction. France reported a 7-month low of 43.9 while Germany recorded a PMI of 42.4, a 5-month low.
Cyrus de la Rubia, Chief Economist at Hamburg Commercial Bank, noted the worsening conditions, stating, "Things are going downhill, and fast." The manufacturing sector has now been in recession for a grueling 26 months, with no immediate signs of recovery. The persistent decline in new orders has dashed hopes of a near-term rebound, while the recent uptick in input prices since June suggests that the deflationary phase in the goods sector may be ending.
For the first time since April 2023, selling prices in the manufacturing sector have risen, driven by increases in countries like France, the Netherlands, Greece, and Italy. This development could complicate ECB's efforts to control inflation, as the central bank has been relying on falling manufacturing prices to offset persistent inflationary pressures in the services sector.
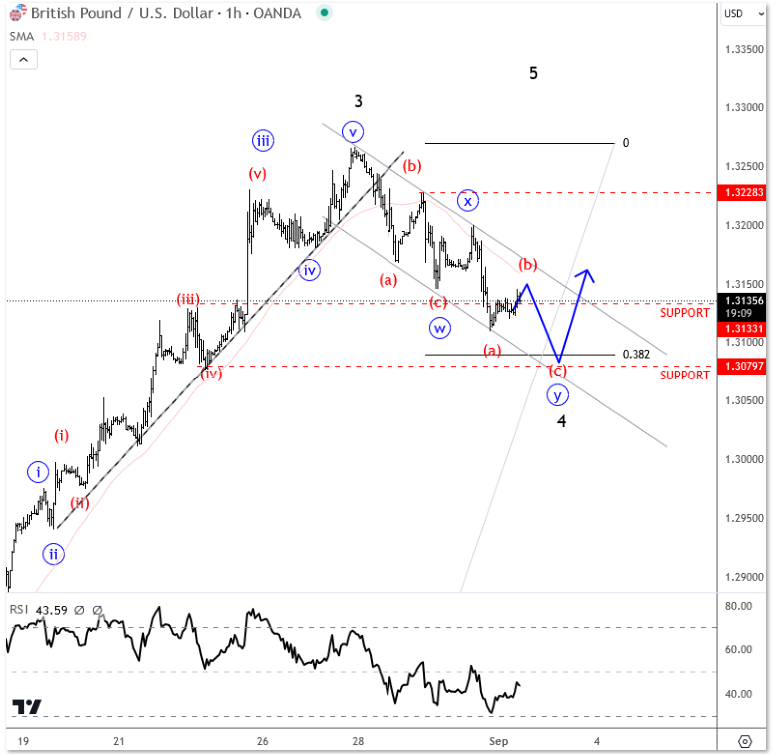
Elliott Wave Analysis: Corrective Pullback for Cable
Cable is coming lower, but the overlapping price action suggests that this is likely a corrective movement within the broader uptrend. However, there could be some further downside as the seven-swing drop is not fully completed yet. In that case, the 38.2% retracement level for wave 4 is around 1.3090, which is also close to the wave four of two lesser degrees, at 1.3079. This certainly appears to be a very interesting area for potential stabilization on the pound this week.
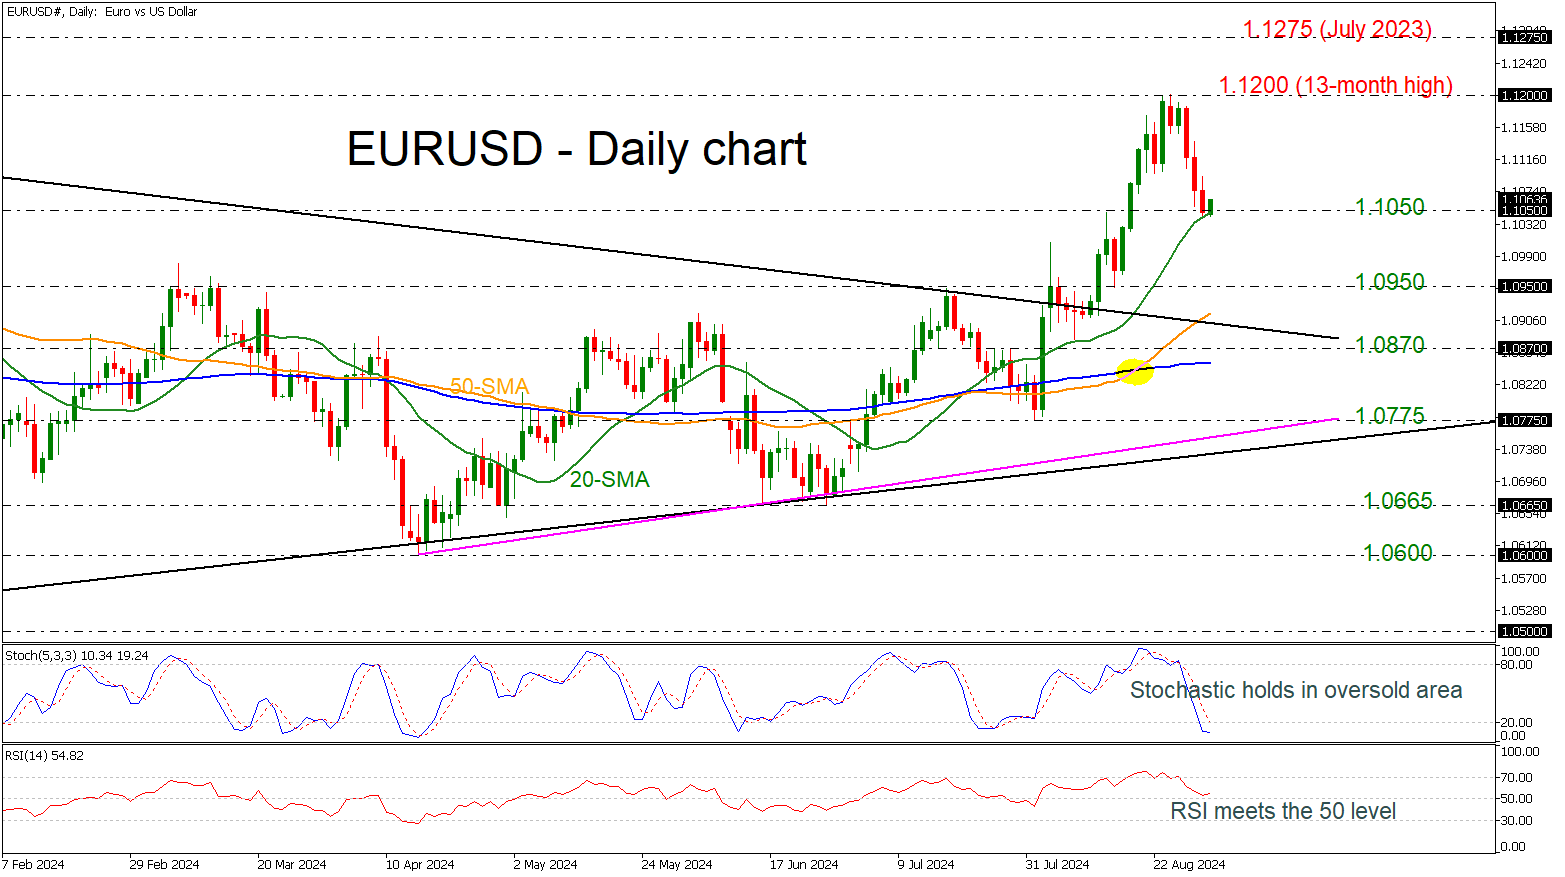
EURUSD Pauses Bearish Correction Near 1.1050
- EURUSD recoups some losses
- Finds support near 20-day SMA
- Stochastics and RSI point north
EURUSD is recovering somewhat after three consecutive red days from its 13-month high of 1.1200. The price is flirting with the 20-day simple moving average (SMA) and the 1.1050 support level, while the technical oscillators are showing some improvement. The stochastic is trying to tick up in the oversold region, and the RSI is pointing marginally higher above the 50 level.
If the market maintains its upside structure and remains above 1.1050, it may challenge the previous peak of 1.1200. The bulls may even surpass the peak of 1.1275, registered in July 2023.
Alternatively, the next support could come around the 1.0950 barricade ahead of the 50-day SMA, which stands around the descending trend line of 1.0915. Steeper declines could lead the market to the 1.0870 mark before testing the 200-day SMA at 1.0850.
Summarizing, EURUSD is creating a notable bearish correction, but the broader outlook remains bullish in the short- and medium-term timeframes.
Oil Prices Abruptly Tumbled Below $80 per Barrel (Brent)
Markets
European inflation figures and US PCE, spending & income data basically played second fiddle on Friday, triggering barely more than some intraday volatility in yields. Technical elements were at least as much of a driver. Support around the August lows waq tested earlier last week. Their survival preluded a countermove higher, be it within the existing ST narrow sideways trading ranges. US yields finished between 2.3 (3-yr) and 5 bps (30-yr) higher. German rates added 2.2-3.4 bps across the curve. It’s 10-yr tenor closed at the highest level since end-July. Oil prices abruptly tumbled below $80 per barrel (Brent) on a report ran by Reuters that OPEC+ is likely to go ahead with the planned output increases. Lingering (Chinese) growth concerns had some in the market assuming the oil cartel would have changed tack. The price of oil extends its fall during Asian dealings to $76.4. While driven by the contract roll as well, it does bring the August dip just north of $75 back in focus. The sharp oil decline came with consequences for the likes of the Norwegian krone. EUR/NOK rebounded from a two-week low. USD was well bid. The trade-weighted index recovered for a third day straight, further leaving the 100.6 support area behind. DXY closed around 101.7. EUR/USD’s three-day losing streak brought it back to the mid 1.10-1.11 area and USD/JPY topped 146. Sterling ended August’s wild ride at virtually the same level where it started the month. EUR/GBP tested the 0.84 big figure before finishing slightly north of it.
News this morning is very scarce and with an empty eco calendar and US financial markets closed for Labour Day that’s probably not going to change anytime soon today. That suggests limited and rangebound technical trading. Reuters is running a story that ECB policymakers are increasingly at odds on the outlook for growth and its impact on inflation. The divide means there’s no clear view on what to expect after the central bank will cut rates again in September. But that’s for next week. After a slow open today, the calendar does get a lot more interesting for markets. The US August ISMs are due tomorrow (manufacturing) and Thursday (services), along with the JOLTS job openings and the Fed’s Beige Book (Wednesday) and the payrolls report on Friday. Their releases are particularly critical for the size of this month’s Fed cut. With what is currently already priced in further out, any downside surprise would have to be material enough for adding to those bets even more. We’re instead especially interested in case of consensus-matching or slightly -beating outcomes.
News & Views
The Czech Ministry of Finance on Saturday presented a 2025 government budget that aims to reduce the budget deficit near 2.0% of GDP. The proposal includes a reduction of the deficit to CZK 230 bln down from a CZK 252 bln target for this year. In preparing this budget, the government had to strike a balance between delivering on a promise to return to return to fiscal orthodoxy while at the same time committing funds for more investments, meeting the target of 2% spending on defensive and other social spending. In this respect, the budget raises spending by CZK 124.1 bln and income by 146.1 bln. The government expects growth to reaccelerate to 2.7% from an expected 1.1% this year. The government will debate the budget before summitting a final version to Parliament by end-September. One of the junior coalition partners (Pirates Party) already indicated that it could not accept lower funding to support new housing. The Czech Republic is scheduled to hold parliamentary elections next year.
Regional elections in Thuringia and Saxony resulted in a big defeat for the parties of the three-party national government coalition of Chancellor Olaf Scholz. In Thuringia, preliminary results indicate that the far-right Alternative for Germany (AfD) could reach as much as 33.2 % of the votes, with the CDU reaching 23.6%. In Saxony both parties are seen neck and neck with the CDU seen potentially winning 31.9% of the votes while the AFD might reach 30.6%. Also the left-wing populist party Sahra Wagenknecht Alliance (BSW) profited from the decline in support for the ruling parties of the national government, securing 15.8% of the votes in Thuringia and estimated to have gained 11.8% in Saxony. The outcome of the elections will make it difficult to make coalitions on a regional level, but might also further pressure on the national government (SPD, Greens, Free Democrats) as Germany is preparing for 2025 parliamentary elections.
Graphs
GE 10y yield
The ECB cut policy rates by 25 bps in June. Stubborn inflation (core, services) make follow-up moves less evident. Markets nevertheless price in two to three more cuts for 2024 as disappointing US and unconvincing EMU activity data rolled in, dragging the long end of the curve down. The move accelerated during the early August market meltdown.
US 10y yield
The Fed in its July meeting paved the way for a first cut in September. It turned attentive to risks to the both sides of its dual mandate as the economy is moving to a better in to balance. Markets tend to err in favour of a 50 bps lift-off. The pivot weakened the technical picture in US yields with another batch of weak eco data pushing the 10-yr sub 4%. Powell at Jackson Hole didn’t challenge markets’ positioning.
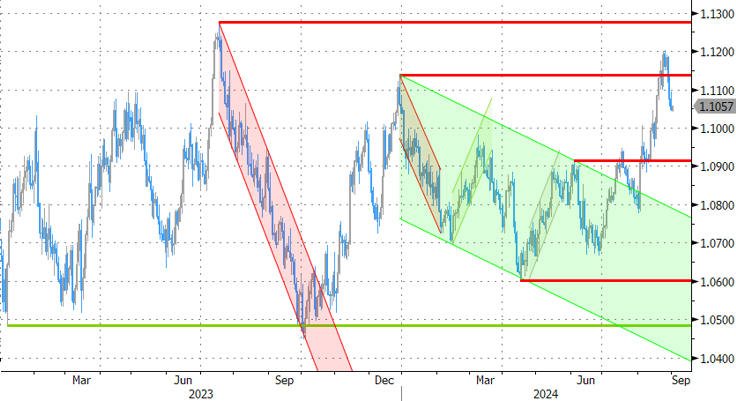
EUR/USD
EUR/USD moved above the 1.09 resistance area as the dollar lost interest rate support at stealth pace. US recession risks and bets on fast and large (50 bps) rate cuts trumped traditional safe haven flows into USD. EUR/USD 1.12 was tested but survived. A (technical) dollar comeback then kicked in.
.
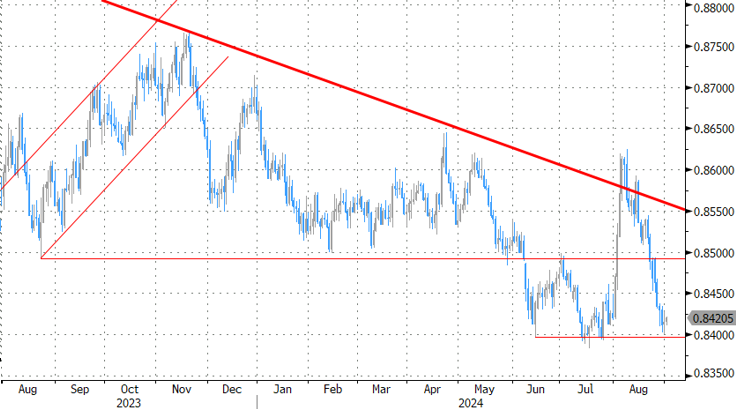
EUR/GBP
The BoE delivered a hawkish cut in August. Policy restrictiveness will be further unwound gradually on a pace determined by a broad range of data. The strategy similar to the ECB’s balances out EUR/GBP in a monetary perspective. Recent better UK activity data and a cautious assessment of BoE’s Bailey at Jackson Hole are pushing EUR/GBP lower in the 0.84/0.086 range.
And September Arrives
August ended on a positive note. Friday’s data showed that the US PCE and the core PCE index stagnated near the levels printed a month earlier instead of a small uptick. Personal spending rose more than expected – and more than income, but the US saving rate fell to 2.9% - the lowest since 2022. Combined with a strong growth number and slowing easing pressures printed a day before, the latest US economic data was good enough to keep the soft-landing dream going, while reinforcing the Federal Reserve (Fed) rate cut bets for September, and at each of the remaining three meetings for this year.
As such, the Dow Jones index advanced to a fresh record last week, the S&P500 closed a touch below a record high, while Nasdaq 100 fell after Nvidia’s blowout results failed to surprise investors who became too used to fireworks and preferred focusing on potential problems instead of the shiny results and as shiny forecasts. Besides that, the prospect of looser monetary policy benefit to cyclical stocks and that’s also causing a rotation from tech to non-tech pockets of the market and leave the tech-heavy Nasdaq behind its major peers, and behind the European stocks as well.
The European Stoxx 600 index rallied to a fresh ATH on Friday, as well, after the latest inflation update from the Eurozone showed further progress toward the European Central Bank’s (ECB) 2% policy target and reinforced the expectations of rate cuts. The EURUSD retreated below the 1.1050 mark and has room for a further slide below the 1.10 psychological level if the Fed and ECB expectations continue to adjust in a way to give less weight to the Fed doves – who expect the Fed to cut its rates at all three of the remaining meetings of the year with a potential 50bp rate cut in one of them, and more weight to the ECB doves, who expect the ECB to cut rates two more times this year, by 25bp in September and in December.
Why not more? Because, although the inflation figures point toward the right direction, the services inflation still accelerated last month, and some known names at the ECB, including Isabel Schnabel or Joachim Nagel, believe that the rate cuts shouldn’t happen too quickly to make sure that inflation returns and stays near the 2% target. And besides the services inflation, the ongoing war in Ukraine and tense relations with Russia remain major worries on the old continent, which sees its natural gas prices increase into fall.
The same worries regarding energy are not true for America, mind you. The nat gas prices there have eased from the summer peak and remain around the $2 mark, while crude oil prices continue to remain under the pressure of higher supply from OPEC+ starting from October and sluggish Chinese growth. US crude fell by more than 3% last Friday, and another 1% this morning in Asia after the official PMI data showed a fourth consecutive month decline in Chinese manufacturing – despite the government’s efforts to boost activity. This morning Caixin data came in better-than-expected, but the CSI 300 index is down by around 1.20% at the time of writing. Almost all gains from Friday, which were based on news that the country considers a $5.4 trillion of mortgages to lower the borrowing costs for millions of families and boost consumption, are gone.
The week ahead
Attention shifts to the all-important US jobs data this week – the last one before the Fed is due to start cutting its rates in September. The job openings data is due Wednesday, ADP on Thursday and NFP, wages and unemployment figures on Friday.
According to the market pricing, a total of 100bp cut is still on the table and the expectations for the upcoming figures are soft. Analysts expect fewer job openings, around 136K print from the ADP report, and around 164K for the NFP. The monthly wages growth may have increased a bit however, and the unemployment rate may have decreased from 4.3% to 4.2%. Sufficiently soft data is good for the Fed cut expectations and risk appetite, but a too soft data and jumbo cut expectations are not supportive of risk appetite. There is a very fine line between optimism due to the expectation of rate cuts and chaos due to expectation of rapid rate cuts on thinking that the Fed may have missed its call at the end of the tightening cycle, as it had missed the turn at the start of it.
Regarding this week’s data, could possibly see stronger-than-expected figures for August, which could further tame the jumbo cut expectations for the Fed and favour the scenario where the Fed would cut its rates by 25bp for the three remaining meetings this year. A sufficiently strong data could even boost the expectation that the Fed will cut only 2 times this year, by a total of 50bp. I believe that there is a greater chance for a hawkish revision in Fed expectations than a dovish one. As such, the US dollar index – which rebounded last week – has room to extend gains this week, if the jobs data looks strong enough.
Brace for Impact, it is NFP-Week
In focus today
Today will be quiet on the macro front, with US markets closed for Labor Day.
In Sweden, PMIs are due 8.30 CET. Like trends observed in many other countries, the manufacturing sector appears to be the weaker segment. The NIER survey, released last week, indicated that business sentiment in August remained nearly unchanged from July. It seems likely that PMIs will reflect a similar trend.
The most important release this week will be the US August Jobs Report on Friday. Ahead of the release, August ISM manufacturing and services indices together with July JOLTs data will also be due for release. Moreover, the Polish Central Bank and Bank of Canada will begin the September central bank meetings on Wednesday. We pencil in an unchanged decision in Poland at 5.75%, and a rate cut of 25bp in Canada, bringing the key rate to 4.25%. In the euro area, ECB's key measure of wage growth, "compensation per employee", is due for release on Friday. Finally, we publish Nordic Outlook with updated economic forecasts on Tuesday.
Economic and market news
What happened overnight
In China, the private manufacturing PMI from Caixin climbed back into growth territory, beating expectations with a reading at 50.4 (cons: 50.0). The uptick was driven by both stronger new orders and production. This contrasts with the NBS' official manufacturing PMI, released on Saturday, which showed the soft trend in manufacturing continuing (49.1, cons. 49.5). NBS' non-manufacturing counterpart was stronger than expected at 50.3. The market reaction was limited. Mainland China's CSI 300 benchmark has declined some 1.3% in early Monday trading.
What happened since Friday
In the US, the PCE inflation data, the Fed's preferred inflation indicator, was released. On a monthly basis, core inflation was as expected at 0.2% m/m SA, while the yearly figure was slightly weaker than expected at 2.6% y/y. The revised August University of Michigan sentiment survey showed that consumers' short-term inflation expectations declined to the lowest level since December 2020 (2.8%), while 5y expectations stood unchanged at 3.0%. The market reaction was muted, as the Fed is now focusing more on labour market data for its rate decisions.
In the euro area, headline inflation dropped to a 3y low of 2.2% y/y in August, primarily due to negative base effects in energy prices. However, underlying price pressure remained sticky as core inflation was virtually unchanged at 2.84% y/y, driven by still elevated services inflation. Coupling this with normalization of core goods prices, we project core inflation to remain sticky going forward, reaching the 2% target only in H2.
The unemployment rate edged lower to its all-time low at 6.4% in July (prior: 6.5%) as the number of unemployed people decreased by 110k. Hence, labour demand in the euro area remains high, keeping wage growth elevated, which also could fuel sticky services inflation given weak productivity in Europe.
In Norway, the final registered labour market report before the Norges Bank (NB) meeting in September showed a surprising decline in the seasonally adjusted unemployment rate to 2.0%. This comes after several months of labour market data generally printing to the weak side of NB's expectations. Hence, the print reduces the likelihood of a rate cut from NB this year. Additionally, NB announced an unchanged NOK FX selling pace in line with expectations.
In commodities space, six OPEC+ sources informed Reuters that the cartel will proceed with its planned oil output hike in October. While some analysts had doubted the hike would happen amid sluggish demand growth, particularly in China, the decision is supported by the Libyan outage tightening the market and hopes of a Fed rate cut in September. Additionally, two sources advised that future output increases will be decided on a month-by-month basis. On Friday, oil prices closed at USD78.80/bbl.
FI: Global yields rose 4bp on the day (with 10y German Bunds rising to 2.30%), taking the cues from hawkish ECB speak (and carry over from Thursday's US GDP figure) rather than the euro area flash inflation print for August. ECB's Schnabel gave fuel to the sell as she was on the hawkish side, yet her argumentation also included an openness to a rate cut in September. Overall, we see her supporting a gradual and cautious approach to a potential rate cutting cycle, for example 25bp per quarter, yet still running a restrictive monetary policy, and not communicating a rate cut path. Markets are pricing 63bp of rate cuts by year end and 97bp through 2025.
FX: The USD finished the week of on a strong note with EUR/USD declining firmly below the 1.11 mark on the back of stronger US data. The key release this week will be the US jobs report out on Friday. A late Friday sell-off in Norwegian kroner completely shifted the weekly performance of NOK from one of the top performers to one of the clear underperformers.
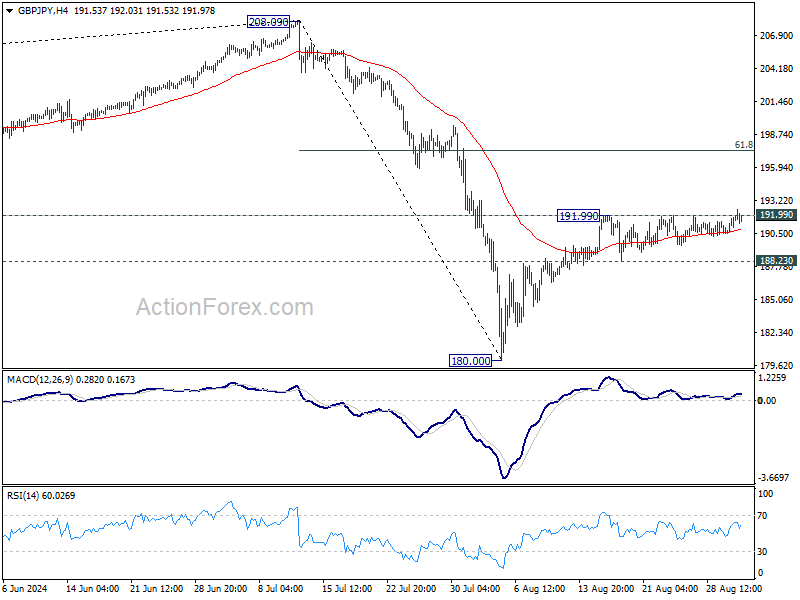
GBP/JPY Daily Outlook
Daily Pivots: (S1) 190.85; (P) 191.45; (R1) 192.40; More...
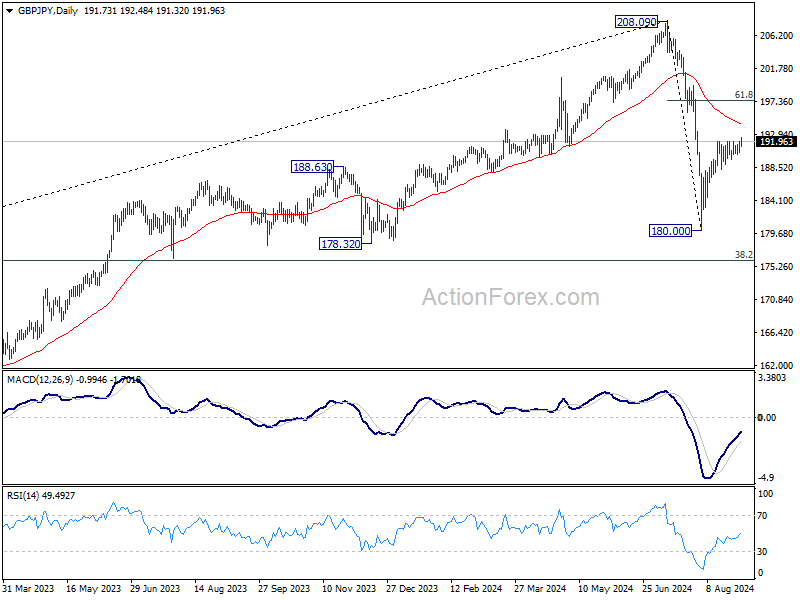
Breach of 191.99 resistance suggests that GBP/JPY's rebound from 180.00 is resuming. Intraday bias is mildly on the upside for 61.8% retracement of 208.09 to 180.00 at 197.35, as the second leg of the corrective pattern from 208.09. On the downside, however, firm break of 188.23 support will argue that rebound from 180.00 has completed, and turn bias back to the downside for retesting 180.00 instead.
In the bigger picture, price actions from 208.09 are seen as a correction to whole rally from 123.94 (2020 low). Current development suggests that the first leg has completed and the range of medium term consolidation should be set between 38.2% retracement of 123.94 to 208.09 at 175.94 and 208.09.
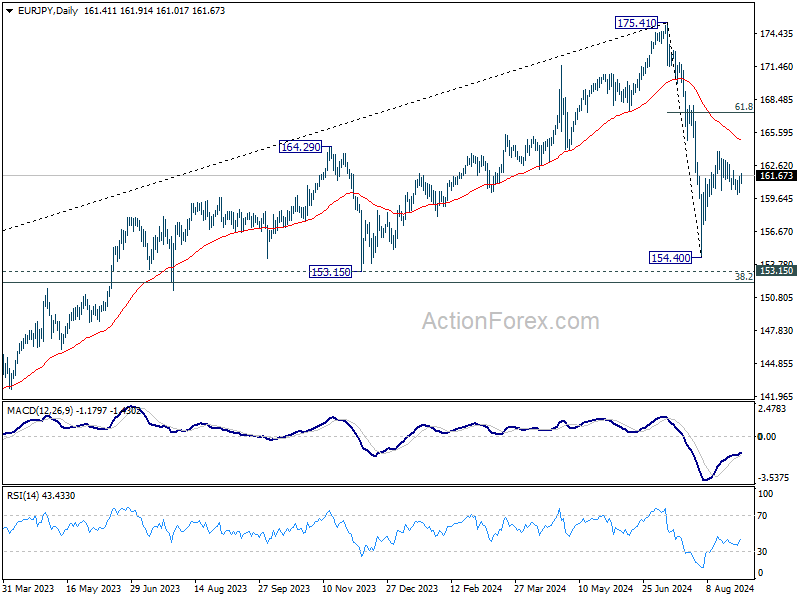
EUR/JPY Daily Outlook
Daily Pivots: (S1) 160.60; (P) 161.11; (R1) 162.01; More....
Intraday bias in EUR/JPY remains neutral as range trading continues below 163.86. On the upside, break of 163.86 will target 61.8% retracement of 175.41 to 154.40 at 167.38, as the second leg of the corrective pattern from 175.41. On the downside, however, firm break of 159.80 support will suggest that the rebound from 154.40 has completed, and turn bias back to the downside for 154.40 instead.
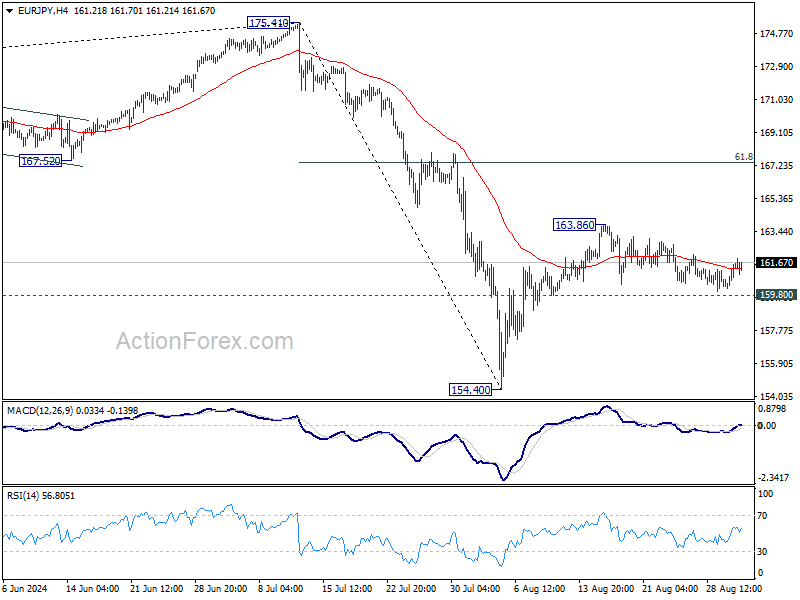
In the bigger picture, price actions from 175.41 are seen as correction to rally from 114.42 (2020 low). Current development suggests that the first leg has completed. The range of consolidation should be seen between 38.2% retracement of 114.42 to 175.41 at 152.11 and 175.41 high.