Sample Category Title
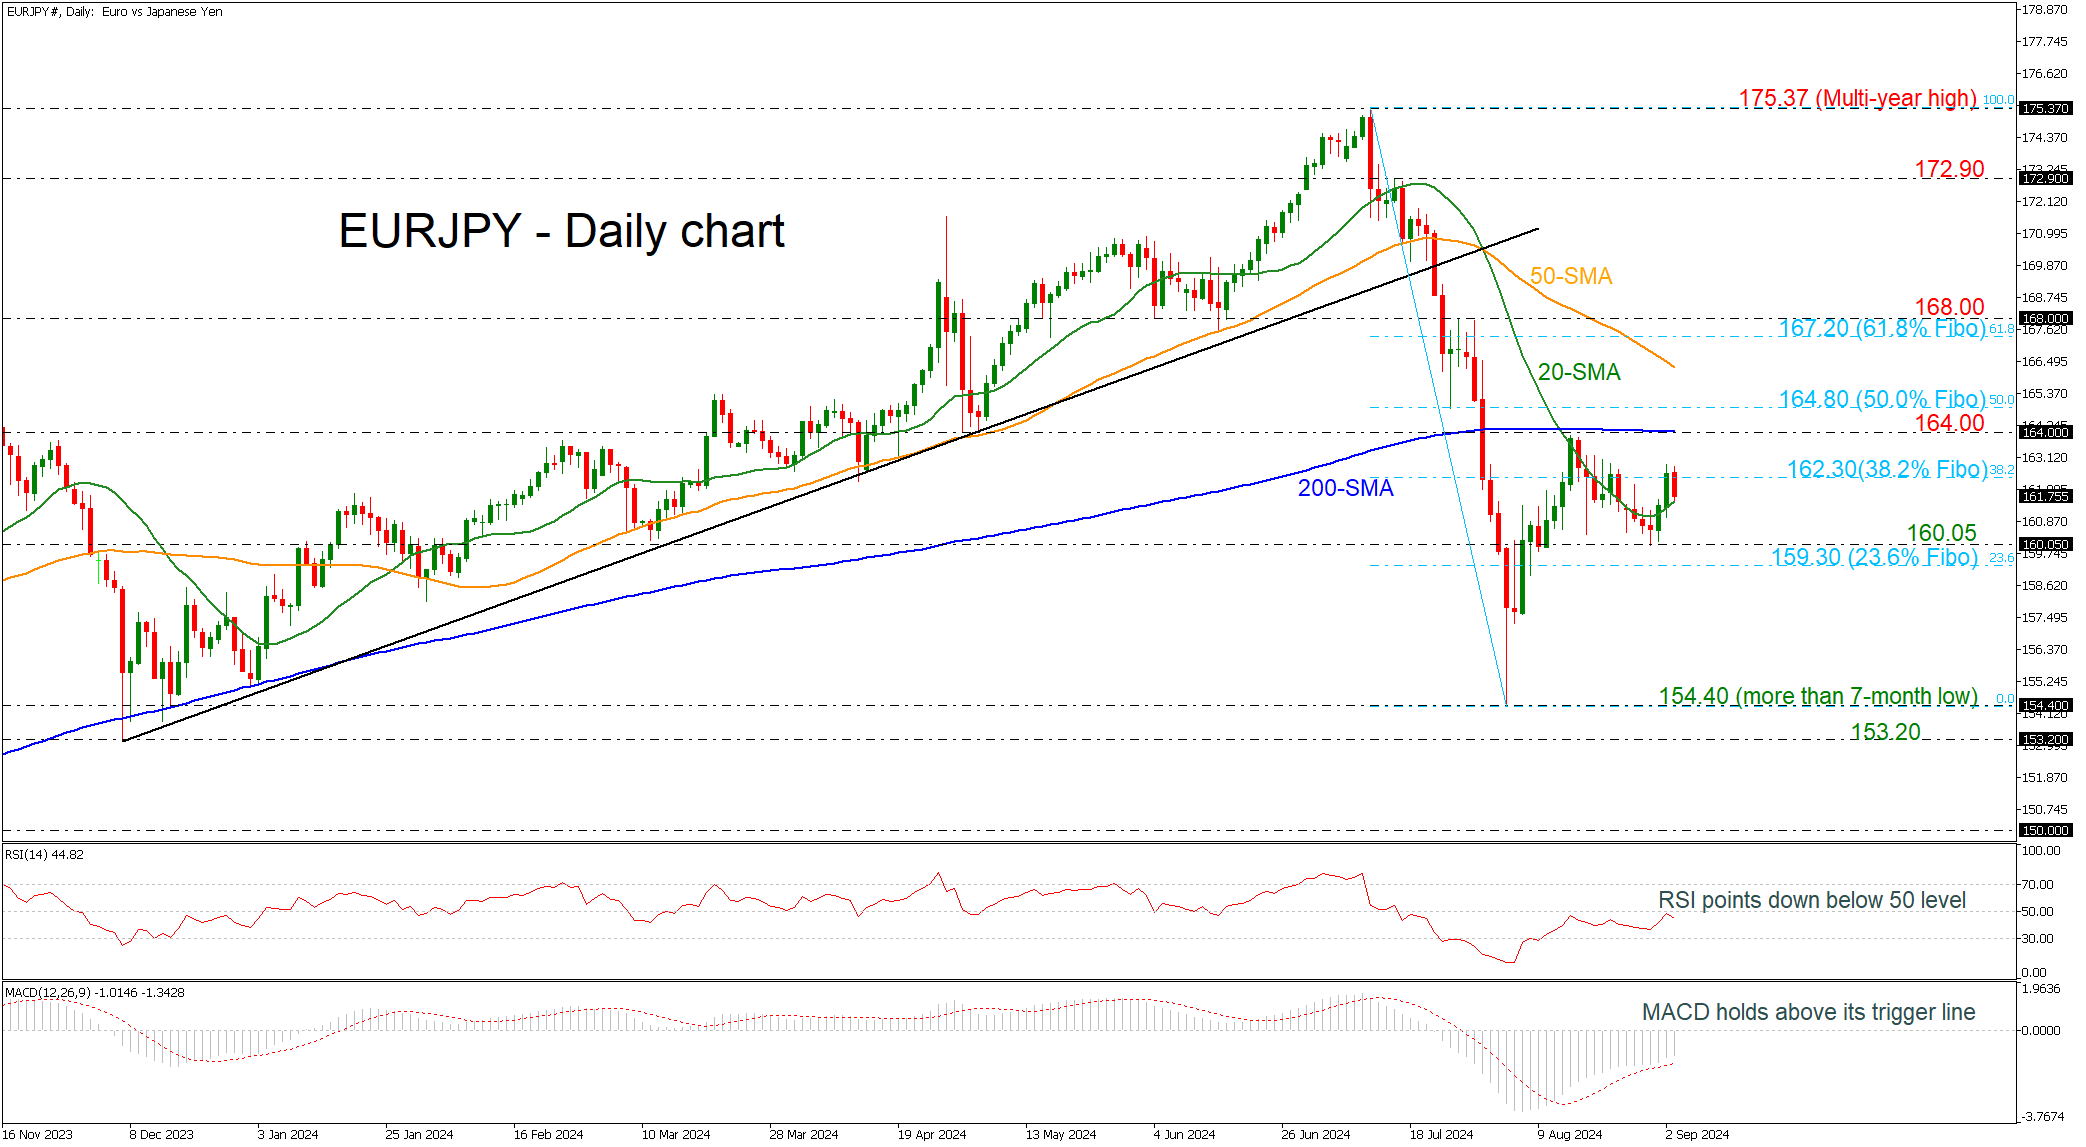
EURJPY Eases from 38.2% Fibonacci
- EURJPY may find significant resistance at 164.00
- Rebound off 7-month low still holds
- RSI heads down below 50 level
- MACD recovers above its trigger line
EURJPY is currently heading south following the unsuccessful battle with the 162.30 resistance level, which is the 38.2% Fibonacci retracement level of the down leg from 175.37 to 154.40. However, a more important struggle for the bulls could come at the 164.00 psychological level, which coincides with the 200-day simple moving average (SMA).
Technical oscillators show some mixed signs. The RSI is pointing downwards beneath the neutral threshold of 50, whereas the MACD is extending its positive momentum above its trigger line.
If the price has a closing session beyond the 162.30 barrier, then the fight with 164.00 would start. A break above it would open the way for a test of the 50.0% Fibonacci of 164.80 before meeting the 50-day SMA at 166.30.
In the negative scenario, a move lower could take the market towards the 159.30-160.05 support region, which encapsulates the 23.6% Fibonacci. More downside pressure could drive the bears towards the more-than-seven-month low of 154.40.
Summarizing, EURJPY has showed some improvement since the bearish spike on August 5 but there is lot of room to cover for changing the outlook to bullish.
Swiss GDP grows 0.7% qoq in Q2, above exp 0.6% qoq
Switzerland’s GDP grew by 0.7% qoq in Q2, exceeding expectations of 0.6% qoq and marking an improvement from Q1’s 0.5% qoq growth. When adjusted for sporting events, GDP still showed solid growth at 0.5% qoq, up from the previous quarter's 0.3% qoq.
This stronger-than-expected performance was largely driven by significant expansion in the chemical and pharmaceutical industries, which played a key role in lifting the overall economic output. However, growth across other sectors was uneven, reflecting underlying weaknesses in domestic demand.
Commodity Currencies Trade in the Defensive
Markets
European stocks opened in red, ended in green. German yields added some 3-4 bps, launching the 10-yr yield to the highest level since the August meltdown. And the Japanese yen lagged global peers on currency markets. That’s about all there is to say about yesterday’s uneventful, US-missing trading day. Morning news today remains very limited though we do pick up on an article ran by Bloomberg. The financial news agency, citing people familiar with the matter, said that ECB rate cuts beyond 3% will be a lot more contentious. Rates at the current level of 3.75% are still restrictive, making the next two to three moves down a no-brainer given poor economic momentum. Views in the policy committee, however, increasingly differ on the price outlook and the neutral rate – a matter that Reuters also raised just yesterday. Estimates on the latter range between 2-3%, meaning that rates below 3% for some (hawks) risks halting or even reversing the ongoing disinflationary process. Euro area money markets expect the ECB to have cut rates to around 2% by 2026.
US bonds trade for the first time this week after having enjoyed a long weekend for Labor Day. They add around 1 bp across the curve in Asian dealings. Commodity currencies trade in the defensive with the likes of the Aussie dollar pressured by faltering iron ore prices (nearing the 2024 multiyear lows). JPY tops the leaderboard, snapping a four-day decline against the dollar. Bank of Japan governor Ueda reaffirmed – in a document submitted to a government panel – that more hikes are coming if the economy and inflation evolve in line with the central bank’s outlook. Today’s economic calendar serves as an appetizer. The US manufacturing ISM is expected to recover to 47.5 from last month’s unexpected and sharp decline to 46.8. Such would be the first improvement in four months. We think it’ll be relevant for intraday trading purposes only though with several other key data prints to be released later this week. The payrolls report on Friday more specifically will all but settle the debate on the size of the Fed’s inaugural cut on September 18. From a market point of view, we’re especially interested in case of an upward surprise in today’s and the other data outcomes now yields appear to have hit the bottom back in August. It could support core/US bond yields in their recovery away from these recent lows/technical support zones. First meaningful support (USD resistance) in EUR/USD is located around 1.098-1.10. 102.16/102.36 is the mirror image in DXY.
News & Views
Inflation in South Korea in August rose 2.0% from 2.6% in July, touching the target of level of the Bank of Korea and marking the slowest pace of yearly price growth since March 2021. Even so, the rise was partially due to favourable base effects. In a monthly perspective prices still rose 0.4% M/M, up from 0.3% in July. Core inflation excluding food and energy prices slowed to 2.1% from 2.2% in July. The Bank of Korea assessed that the data showed that inflation was stabilizing more quickly than in other major economies and sees prices holding a stable trend going forward. The inflation data are raising the chances for a 25 bps interest rate cut at the October meeting even as the BoK recently showed concerns on the financial stability risks of higher house prices and a high level of household debt. The Korean won, which profited from the broader USD decline in August, this morning eased modestly to USD/KRW 1341.5.
British Retail Consortium data this morning showed that UK retail sales still rose at a modest 1.0% Y/Y in August, even as recent eco data suggested a better performance of the UK economy in the second half of the year. On a same store basis, sales were 0.8% higher compared to the same period last year. However, the upswing probably was at least partially related due to better weather conditions last month. Three-months, year-over over year food sales accelerated to 2.9% from 2.6%, but non-food sales remained in negative territory 3M-Y/Y (-1.7%).
Graphs
GE 10y yield
The ECB cut policy rates by 25 bps in June. Stubborn inflation (core, services) warrants a cautious approach on follow-up moves. Markets nevertheless price in two to three more cuts for 2024 as disappointing US and unconvincing EMU activity data rolled in, dragging the long end of the curve down. Yields bottomed in the wake of the August market meltdown, preluding a technical correction higher.
US 10y yield
The Fed in its July meeting paved the way for a first cut in September. It turned attentive to risks to the both sides of its dual mandate as the economy is moving to a better in to balance. Markets juggle between 25 and a 50 bps lift-off. The pivot weakened the technical picture in US yields with another batch of weak eco data pushing the 10-yr sub 4%. Powell at Jackson Hole didn’t challenge markets’ positioning.
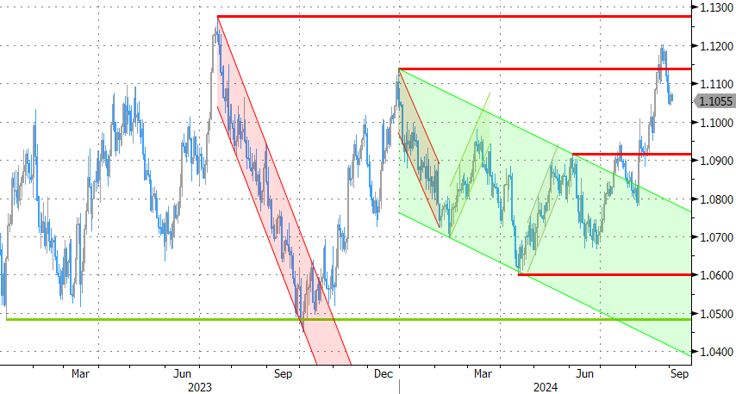
EUR/USD
EUR/USD moved above the 1.09 resistance area as the dollar lost interest rate support at stealth pace. US recession risks and bets on fast and large (50 bps) rate cuts trumped traditional safe haven flows into USD. EUR/USD 1.12 was tested but survived. A (technical) dollar comeback then kicked in.
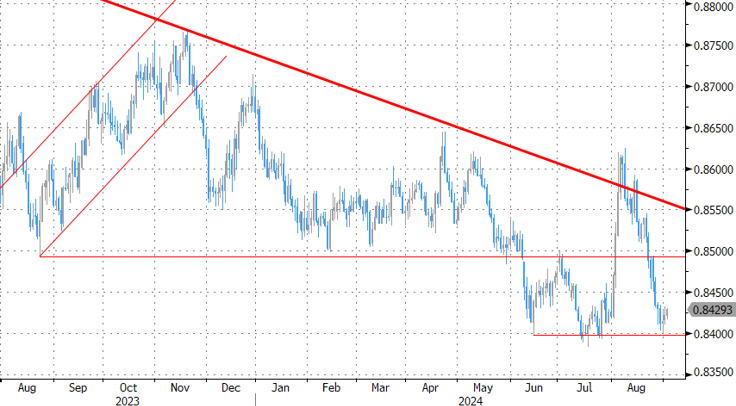
EUR/GBP
The BoE delivered a hawkish cut in August. Policy restrictiveness will be further unwound gradually on a pace determined by a broad range of data. The strategy similar to the ECB’s balances out EUR/GBP in a monetary perspective. Recent better UK activity data and a cautious assessment of BoE’s Bailey at Jackson Hole are pushing EUR/GBP lower in the 0.84/0.086 range.
Swiss CPI slows to 1.1% yoy in Aug, vs exp 1.2% yoy
Swiss CPI was flat mom in August, below expectation of 0.1% mom rise. Core CPI (excluding fresh and seasonal products, energy and fuel) rose 0.1% mom. Domestic products prices was flat while imported products prices fell -0.1% mom.
For the 12-month people, CPI slowed from 1.3% yoy to 1.1% yoy, below expectation of 1.2% yoy. Core CPI was unchanged at.10% yoy. Domestic product prices was unchanged at 2.0% yoy. Imported price prices fell from -1.0% yoy to -1.9% yoy.
Growth Expected to Pick Up Modestly Towards 2025 in Europe Including the Nordics
In focus today
This morning, we published our Nordic Outlook with updated economic forecasts. We expect growth to pick up modestly towards 2025 in Europe including the Nordics, with important variations between them. In the US, growth is still slowing, but from a stronger starting point, while we project the Chinese economy to continue muddling through amid the housing crisis and weak consumer spending. With inflation cooling, the road is paved for gradual and cautious interest rate cuts, where we now expect the Fed to cut rates at every meeting from September to June. Read more in Nordic Outlook - Normalising economies, with risks, 3 September.
The most important data release of the day will be the US ISM Manufacturing index for August. While hard production data has showed recovering growth over summer, the ISM index has remained in contractionary territory and the latest preliminary PMIs signalled further weakness ahead.
In Sweden, Riksbank governor Thedéen will give a speech about current monetary policy at CET 10:00. Thedéen, like other members of the Riksbank board, argues that larger cuts could be justified by an unexpectedly rapid economic slowdown or financial crisis, or otherwise something that significantly alters the inflation outlook. Most Riksbank members have called for 2-3 more rate cuts this year, with Thedéen leaning towards 3 cuts.
Economic and market news
What happened yesterday
Yesterday was muted in terms of market movements, as US markets were closed for Labor Day and data calendar lacked any major macro releases. A slew of PMIs - both preliminary and final - were released.
In the euro area, the final August manufacturing PMI was revised slightly upward to 45.8 from the flash release of 45.6, leaving the overall picture of the weak manufacturing sector unchanged. Notably, country revisions showed France's PMI improving from 42.1 to 43.9, while Italy's rose to 49.4 from 48.5, erasing the recent weakness in Italy. France, however, remained deeply in contractionary territory, like Germany. The divergence in growth between Southern Europe and Northern/Central Europe observed in the first half of the year appears to have continued into the third quarter.
In Scandinavia, Sweden's manufacturing PMI climbed up to 52.7 in August from 49.2, driven by improved orders and production. The Norwegian manufacturing PMI showed a drop to 52.1 from a positive revision of 59.8 (first estimate 56.9), driven by new orders and output. That said, the Norwegian manufacturing PMIs are notoriously volatile, making the reading tough to put too much emphasis on. Better indicators suggest that the petroleum-related parts of manufacturing continue to cushion Norway from weaker global impulses although aggregate growth remains weak.
Equities: Global equities were somewhat lacklustre yesterday, with the US markets closed for Labor Day, leading to directionless trading in Europe. The spread between cyclicals and defensives remained flat, despite some intriguing PMI data released yesterday. The best-performing sector yesterday was REITs, which should dispel any doubts about the implications of yield movements for sectors with high valuation and significant debt loads. After struggling for some years, REITs have emerged as the best-performing sector in the Stoxx 600 over the last six months. Interestingly, banks have been the best-performing industry, highlighting the impact of lower yields driven by improved growth prospects and a more benign inflation outlook. This morning, most Asian markets are lower, led by China, which faces challenges due to weaker-than-expected sales numbers in the housing sector. European futures are mixed, with US futures slightly lower.
FI: It was a quiet session in the European fixed income market as the US market was closed yesterday. 10Y German government bond yields rose almost 4bp, and the curve 2Y-10Y steepened modestly. However, the primary market is still very active with plenty of new issuance as issuers are coming to the market ahead of the central bank meetings in September as well as US election in early November.
FX: EUR/USD has had a quiet start to a very important week due to yesterday's Labor Day public holiday in the US, still hovering in the mid-1.10-1.11 range. CHF was off to a poor start to September ahead of the important release of Swiss CPI for August this morning at 8:30 CET. EUR/SEK and EUR/NOK had a fairly uneventful start to the week with all eyes focused on the US jobs report on Friday.
September Caution
The new week started with caution. The US and Canada were off, and news from Europe weren’t exceptional. The data released on Monday showed that the manufacturing PMI figures for August were slightly higher than expected, but numbers in major Eurozone countries remained below 50, in the contraction zone for another month. The German manufacturing PMI has been below 50 for at least two years, with no signs of improving whatsoever. Yesterday, Volkswagen announced factory closures in Germany to secure bigger cost cuts – the first factory closure in the iconic company’s 87-year history. It’s sad, isn’t it? Well not for investors. Volkswagen shares jumped more than 1% in Germany yesterday, the DAX and the Stoxx 600 index consolidated near their ATH levels. The EURUSD rebounded, probably helped by a softer US dollar across the board and some cautious and less dovish comments from some European Central Bank (ECB) members last week. But the single currency is under pressure this morning on a broadly stronger US dollar. Cable retreats and the franc is softer against the US dollar as well, before the release of growth and inflation figures this morning. The Canadian dollar is also offered against the greenback as the Bank of Canada (BoC) is expected lower its policy rate by 25bp when it meets on Wednesday this week.
Today, the US will return from its long weekend and we could start seeing some action in the markets. It felt yesterday that the absence of the American markets revived the worries that we might see a rebound in US jobs figures this week – a scenario which would derail the Federal Reserve (Fed) doves, reshuffle the Fed cut expectations and give way to a potentially sizeable price action across different asset classes. Hiring and wage growth may have accelerated in August, for example, if that’s the case, the 50bp cut rates from the Fed will simply fall off the bus. And stronger-than-expected figures should, in the first place, let the US dollar recover a part of the recent losses, throw a floor under the US yields, disappoint indices and sectors that rely on rate cuts but give support to others – like the tech – who don’t really need the support of the Fed to do well. The jobs data will start flowing in from tomorrow, but investors will have a look at the final ISM figures today.
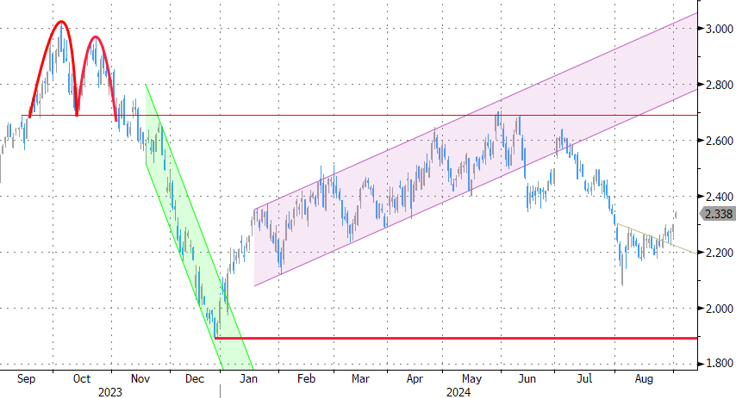
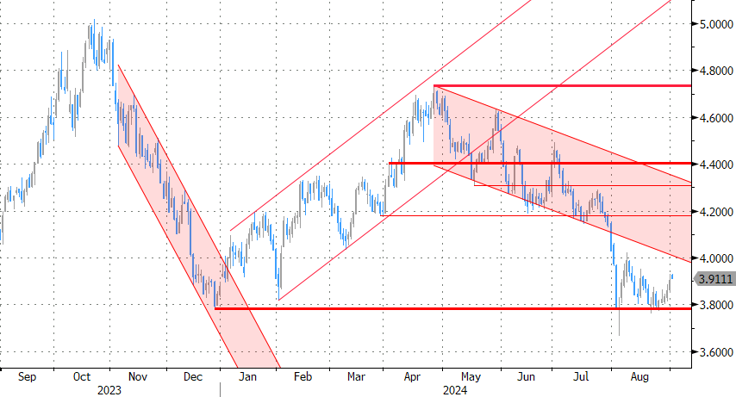
Gold consolidates a touch below the $2500 per ounce, and US crude struggles near the low range of summer trading. Besides the unideal European manufacturing figures, the week started with soft numbers from China, well. It’s almost impossible to cheer up the Chinese investors – whereas there were times – in the past – where soft data would revive the intervention bets and serve as a step to rebound. And today, even with the news that the Chinese government will put relatively big sums on the table to help the Chinese factories and housing sector rebound, there is not much enthusiasm.
And you can see the lack of enthusiasm in iron ore futures that dived to the lowest levels since November 2022. Copper futures also retreated at the start of this week. Down in Australia, which is one of China’s biggest trading partners and where the economy relies on export of commodities like iron ore, the AUDUSD is under a renewed pressure as all eyes are on the Q2 GDP figures due tomorrow. The Australian economy grew by a mere 0.1% in Q1, and while expectations for Q2 are slightly better, the challenges are far from over. Sluggish China, inflation, coupled with rising consumer debt, are keeping the Reserve Bank of Australia (RBA) on its toes as they prepare for their next policy meeting. The RBA is not as explicitly supportive of the doves, that’s also why we have seen the Aussie perform better across a broadly slashed US dollar. But China’s misery will likely keep the upside potential limited near the 70 cents mark.
And speaking of enthusiasm or the lack thereof, September is blamed to be a bad month for both equities and credit. And at the historically high levels, with a decent level of uncertainty regarding what the Fed should (and what the Fed will) do, the geopolitical tensions, war, energy crisis and so, there is little to make this September better than the others.
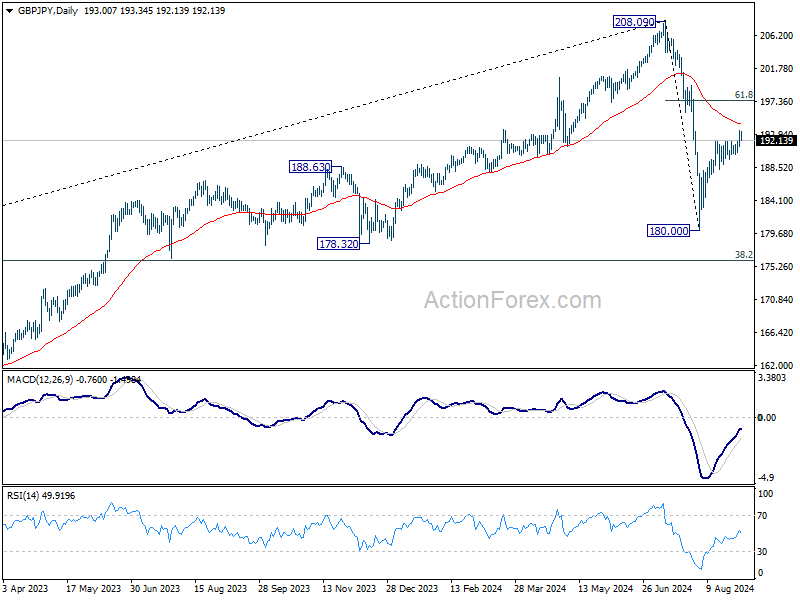
GBP/JPY Daily Outlook
Daily Pivots: (S1) 191.83; (P) 192.65; (R1) 193.98; More...
Intraday bias in GBP/JPY stays mildly on the upside as rebound from 180.00 is in progress. Further rally would be seen to 61.8% retracement of 208.09 to 180.00 at 197.35, as the second leg of the corrective pattern from 208.09. On the downside, however, firm break of 188.23 support will argue that rebound from 180.00 has completed, and turn bias back to the downside for retesting 180.00 instead.
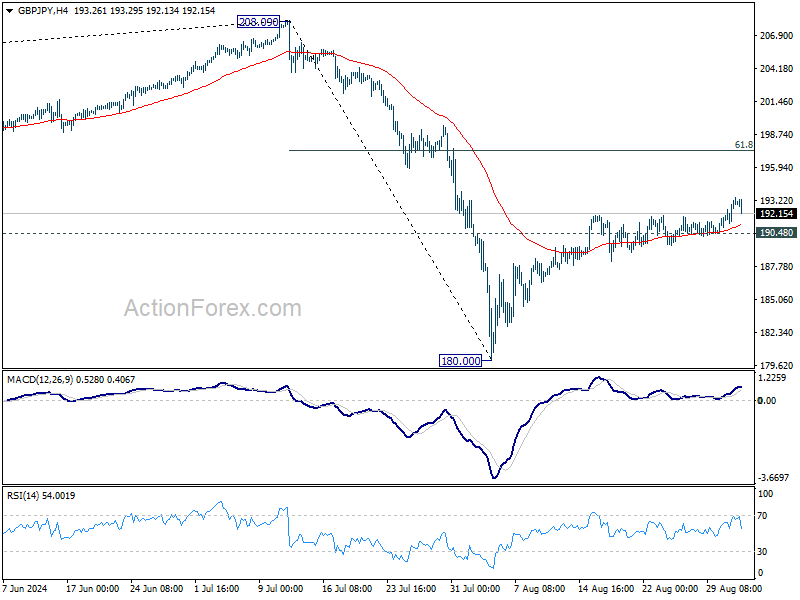
In the bigger picture, price actions from 208.09 are seen as a correction to whole rally from 123.94 (2020 low). Current development suggests that the first leg has completed and the range of medium term consolidation should be set between 38.2% retracement of 123.94 to 208.09 at 175.94 and 208.09.
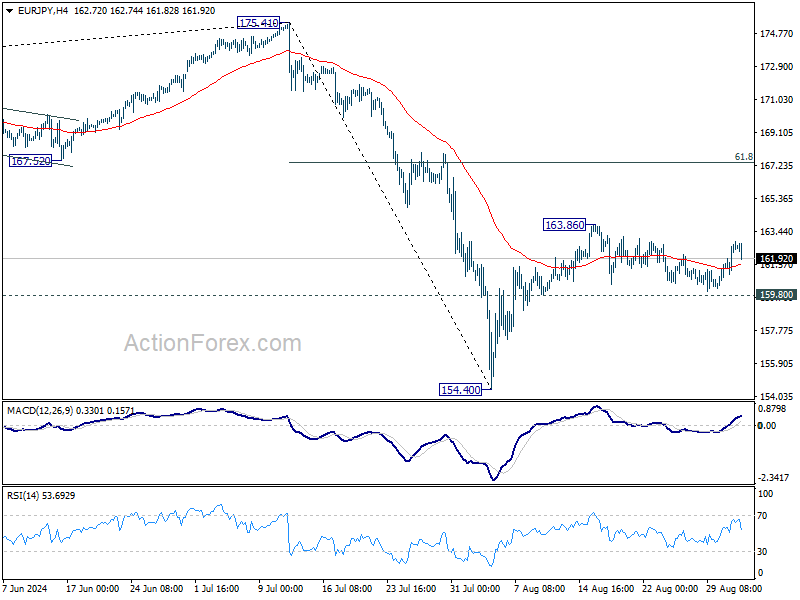
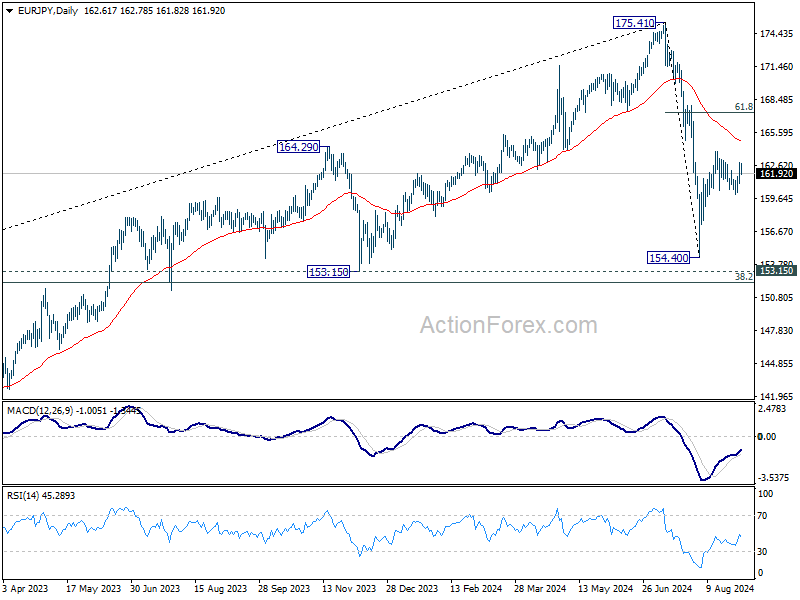
EUR/JPY Daily Outlook
Daily Pivots: (S1) 161.50; (P) 162.20; (R1) 163.36; More....
EUR/JPY is staying in range below 163.86 and intraday bias remains neutral. On the upside, break of 163.86 will target 61.8% retracement of 175.41 to 154.40 at 167.38, as the second leg of the corrective pattern from 175.41. On the downside, however, firm break of 159.80 support will suggest that the rebound from 154.40 has completed, and turn bias back to the downside for 154.40 instead.
In the bigger picture, price actions from 175.41 are seen as correction to rally from 114.42 (2020 low). Current development suggests that the first leg has completed. The range of consolidation should be seen between 38.2% retracement of 114.42 to 175.41 at 152.11 and 175.41 high.
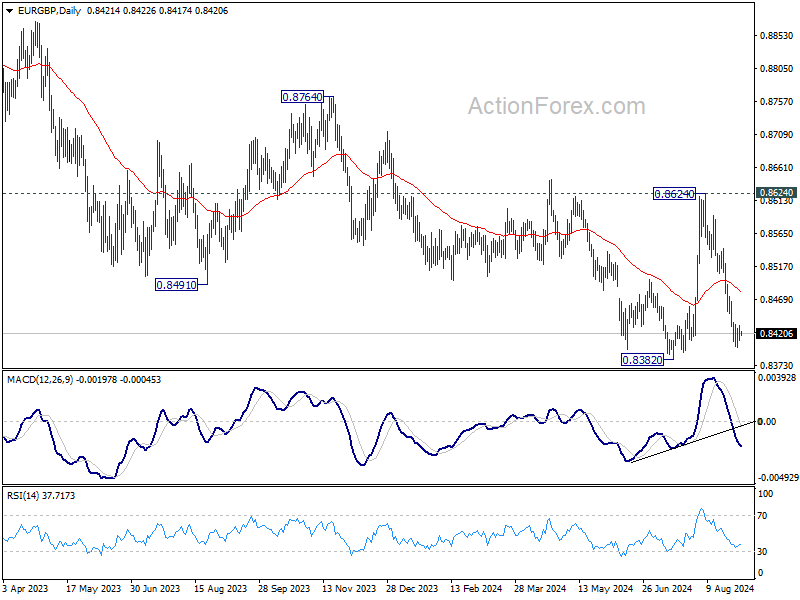
EUR/GBP Daily Outlook
Daily Pivots: (S1) 0.8411; (P) 0.8422; (R1) 0.8433; More....
Intraday bias in EUR/GBP remains neutral for the moment. Consolidations from 0.8399 would continue and stronger recovery might be seen. But further decline is expected as long as 0.8466 minor resistance holds. Below 0.8399 will resume the decline from 0.8624 and target 0.8382 support. Firm break there will resume larger down trend.
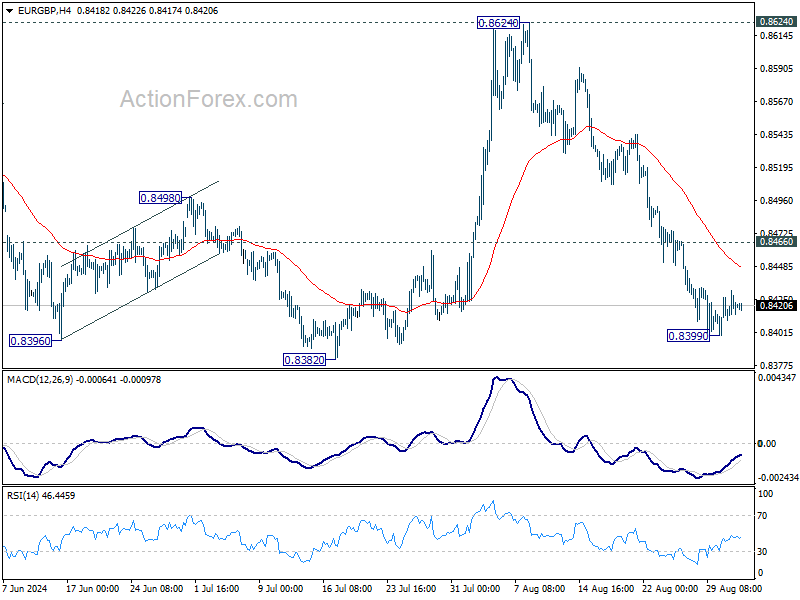
In the bigger picture, as long as 0.8624 resistance holds, down trend from 0.9267 is expected to continue. Firm break of 0.8382 will target 0.8201 (2022 low). However, decisive break of 0.8624 will indicate that such down trend has completed, and turn outlook bullish for 0.8764 resistance next.
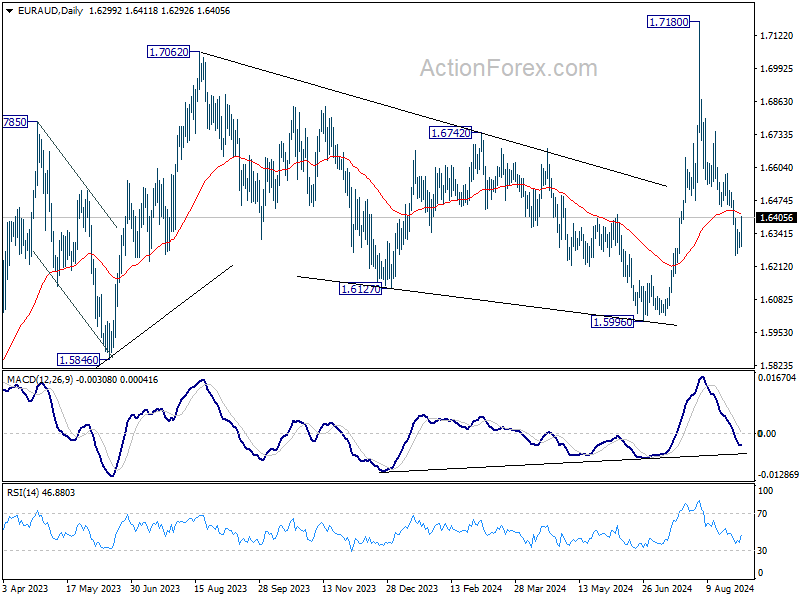
EUR/AUD Daily Outlook
Daily Pivots: (S1) 1.6281; (P) 1.6315; (R1) 1.6339; More...
Intraday bias in EUR/AUD remains neutral for the moment. While recovery from 1.6256 might extend, further decline is in favor as long as 1.6580 resistance holds. Break of 1.6256 will resume the fall from 1.7180, and target 1.5996 key support level next. However, decisive break of 1.6580 will turn bias back to the upside for stronger rebound.
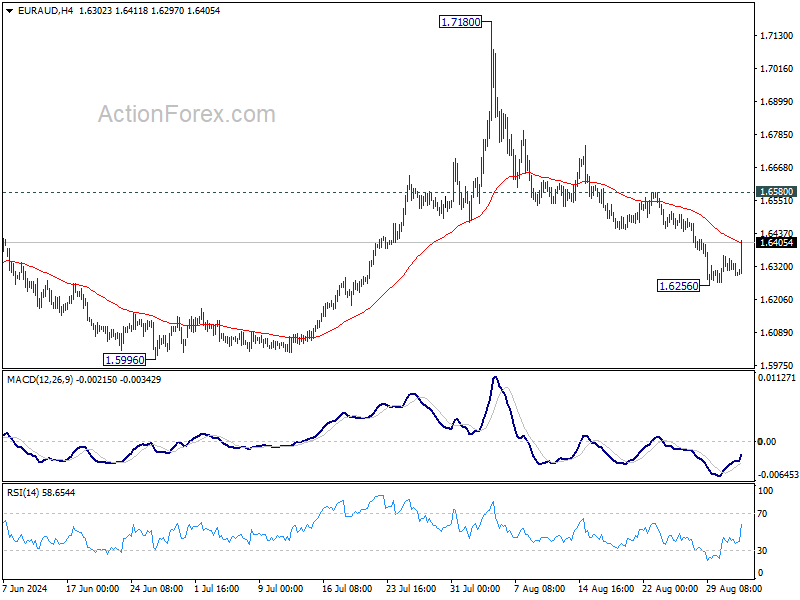
In the bigger picture, outlook is mixed up by the deeper than expected fall from 1.7180. Yet as long as 1.5996 support holds, up trend from 1.4281 (2022 low) is still expected to resume at a later stage. Firm break of 1.7180 will pave the way to 61.8% projection of 1.4281 to 1.7062 from 1.5996 at 1.7715.