
Sample Category Title
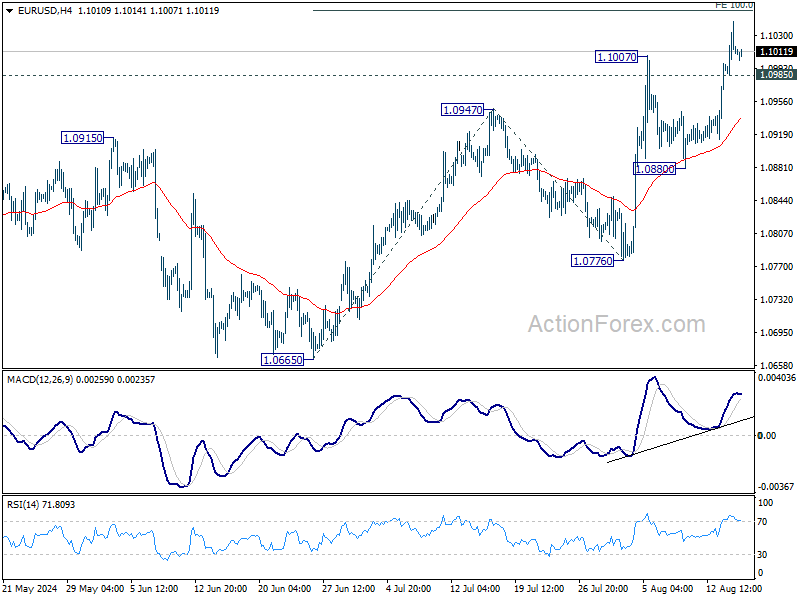
EUR/USD Daily Outlook
Daily Pivots: (S1) 1.0981; (P) 1.1014; (R1) 1.1046; More.....
Intraday bias in EUR/USD remains on the upside for the moment. Current rise from 1.0665 in in progress for 100% projection of 1.0665 to 1.0947 from 1.0776 at 1.1058. Decisive break there could prompt upside acceleration through 1.1138 resistance to 161.8% projection at 1.1232. On the downside, below 1.0985 minor support will turn intraday bias neutral first. But outlook will stay bullish as long as 1.0880 support holds.
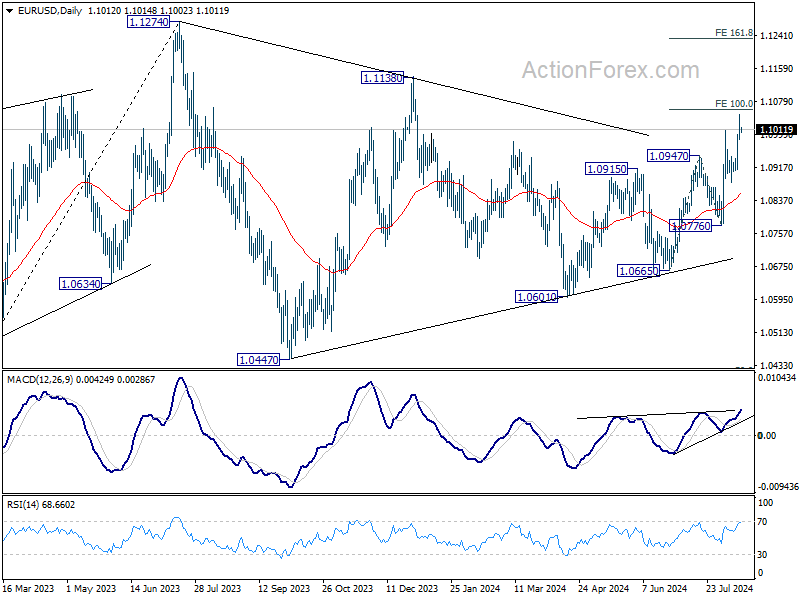
In the bigger picture, price actions from 1.1274 are viewed as a corrective pattern that's could still extend. Break of 1.1138 resistance will be the first signal that rise from 0.9534 (2022 low) is ready to resume through 1.1274 (2023 high). However, break of 1.0776 support will extend the correction with another falling leg back towards 1.0447 support.
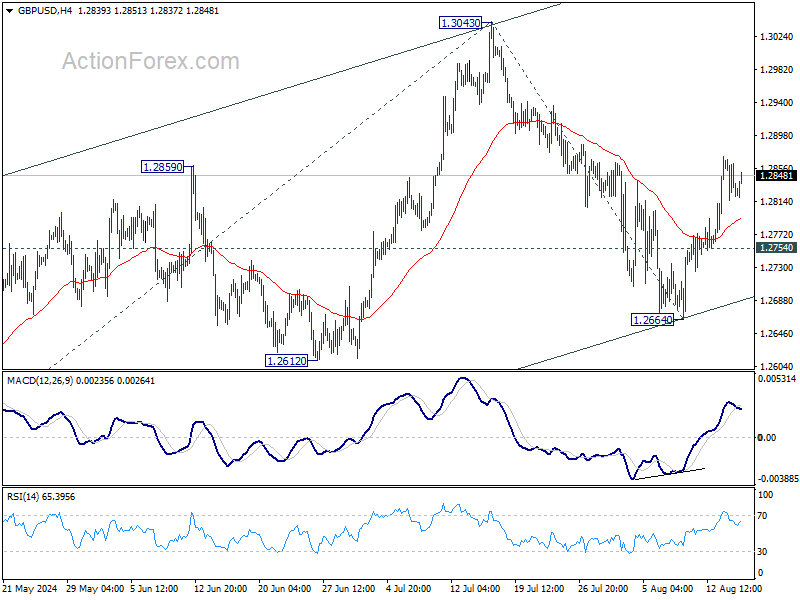
GBP/USD Daily Outlook
Daily Pivots: (S1) 1.2806; (P) 1.2838; (R1) 1.2857; More...
Intraday bias in GBP/USD remains on the upside for the moment. Pull back from 1.3043 could have completed at 1.2664 already. Further rise should be seen to retest 1.3043 resistance first. Firm break there will resume whole rally from 1.2998 to 61.8% projection of 1.2298 to 1.3043 from 1.2664 at 1.3124, which is close to 1.3141 high. On the downside, below 1.2754 minor support will turn intraday bias neutral first.
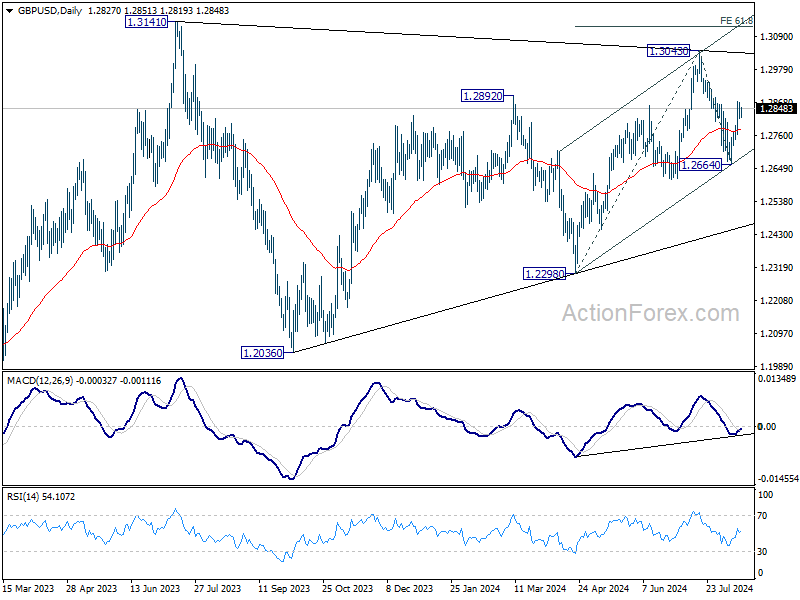
In the bigger picture, as long as 1.3141 resistance holds (2023 high), medium term corrective pattern from there could still extend with another falling leg. But even in that case, downside should be contained by 1.2036/2298 support zone. Meanwhile, decisive break of 1.3141 will confirm resumption of whole up trend from 1.0351 (2022 low).
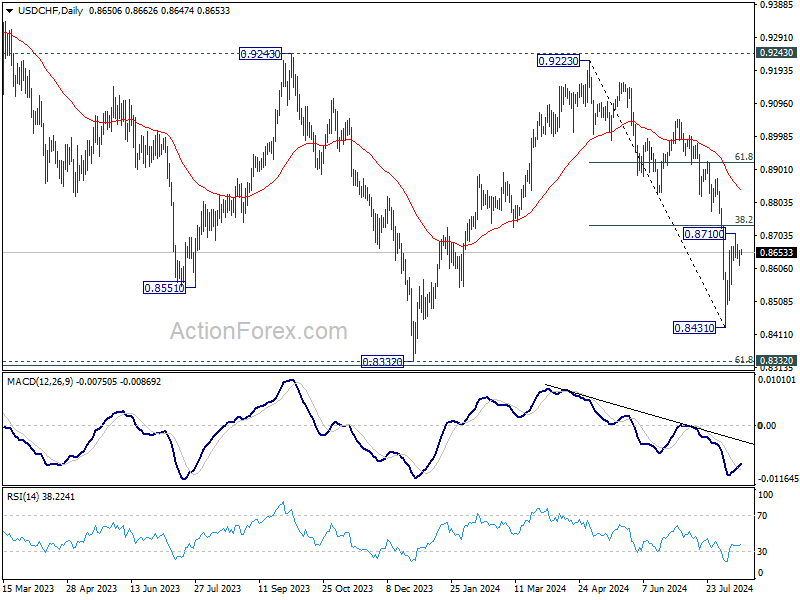
USD/CHF Daily Outlook
Daily Pivots: (S1) 0.8625; (P) 0.8643; (R1) 0.8669; More….
Intraday bias in USD/CHF is mildly on the downside at this point. Rebound from 0.8431 might have completed at 0.8701 already. Deeper fall would be seen back to retest 0.8431 low. On the upside, however, firm break of 38.2% retracement of 0.9223 to 0.8431 at 0.8734 will bring stronger rally to 61.8% retracement at 0.8920, even as a corrective move.
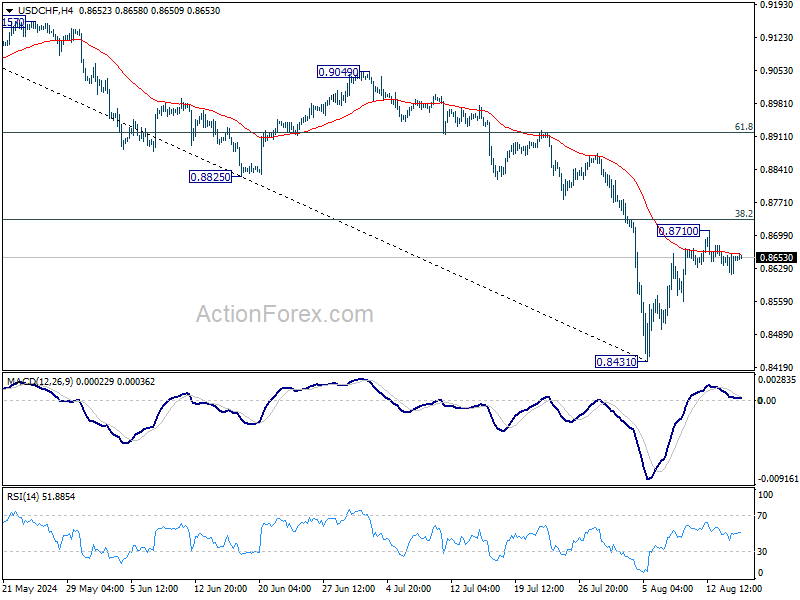
In the bigger picture, price actions from 0.8332 (2023 low) are currently seen as a medium term corrective pattern, with fall from 0.9223 as the second leg. Strong support could be seen from 0.8332 to bring rebound. Yet, overall outlook will continue to stay bearish as long as 0.9243 resistance holds. Firm break of 0.8332, however, will resume larger down trend from 1.0146 (2022 high).
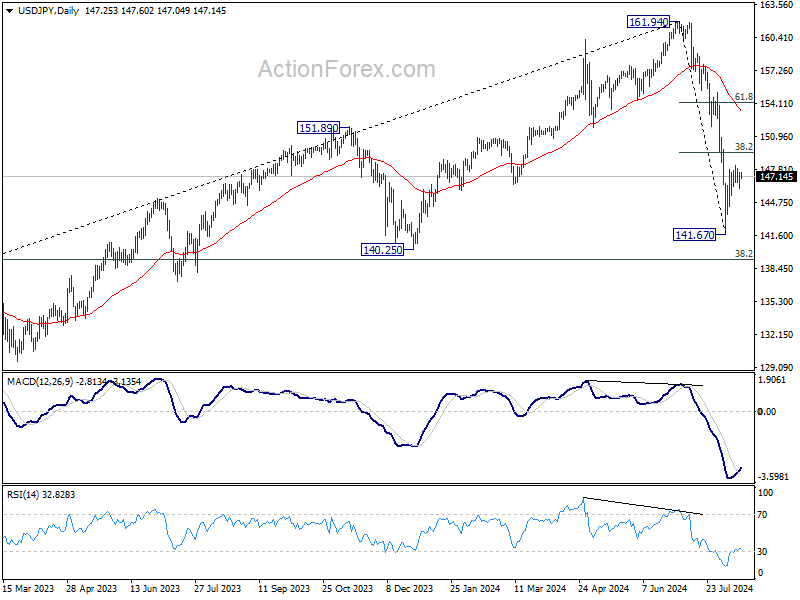
USD/JPY Daily Outlook
Daily Pivots: (S1) 146.40; (P) 147.00; (R1) 147.91; More...
Intraday bias in USD/JPY remains neutral for the moment. Outlook stays bearish with 38.2% retracement of 161.94 to 141.67 at 149.41 intact and intraday bias stays neutral. Below 145.42 minor support will turn bias to the downside for 141.67. Break there will resume the fall from 161.94 to 140.25 support next. Nevertheless, decisive break of 149.41 will bring stronger rally to 61.8% retracement at 154.19, even as a corrective move.
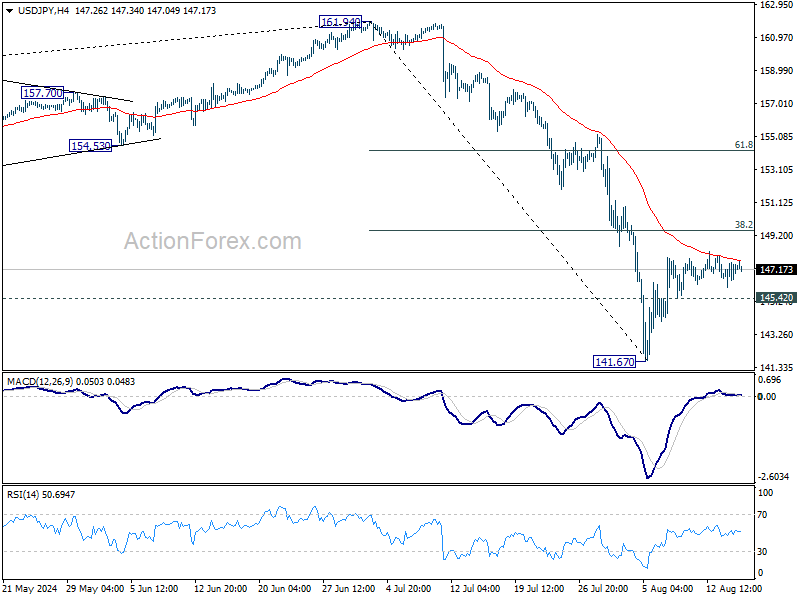
In the bigger picture, fall from 161.94 medium term is seen as correcting whole up trend from 102.58 (2021 low). Deeper decline could be seen to 38.2% retracement of 102.58 to 161.94 at 139.26, which is close to 140.25 support. In any case, risk will stay on the downside as long as 55 W EMA (now at 149.77) holds. Nevertheless, firm break of 55 W EMA will suggest that the range for medium term corrective pattern is already set.
USD/CAD Daily Outlook
Daily Pivots: (S1) 1.3694; (P) 1.3709; (R1) 1.3730; More...
Intraday bias in USD/CAD stays on the downside at this point despite weak downside momentum. Fall from 1.3946 would extend towards 1.3588 key support. On the upside, above 1.3674 minor resistance will turn bias back to the upside for stronger recovery.
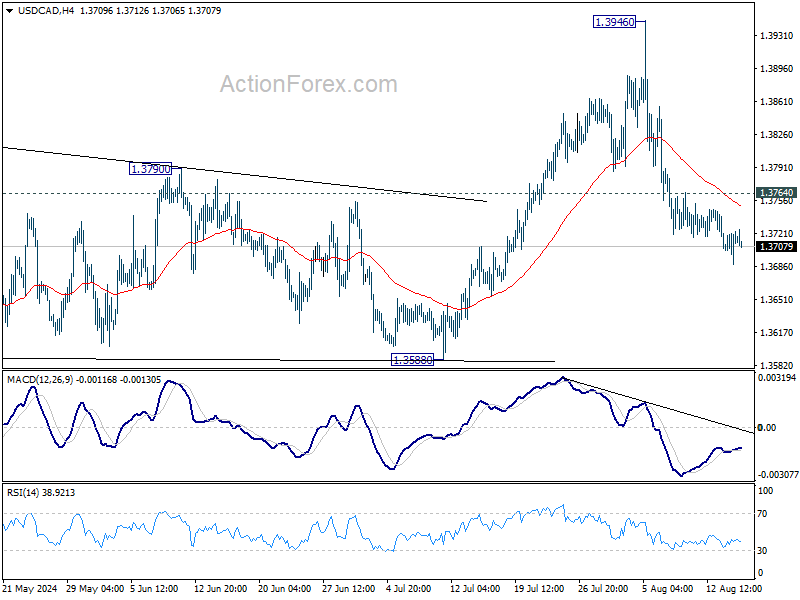
In the bigger picture, price actions from 1.3976 (2022 high) are viewed as a corrective pattern, that might have completed at 1.3176 (2023 low) already. Firm break of 1.3976 will confirm resumption of whole up trend from 1.2005 (2021 low). Next target is 61.8% projection of 1.2401 to 1.3976 from 1.3176 at 1.4149. This will be the favored case as long as 1.3588 support holds, in case of pullback.
We Expect Norges Bank on Hold
In focus today
Today's main event will be Norges Bank announcing their policy rate decision. We expect Norges Bank to keep the policy rate unchanged at 4.50%. Developments since June have gone slightly in both directions, so we do not expect Norges Bank to send any new policy signals, but the risk is tilted towards a more dovish statement. However, the recent sharp repricing of the monetary policy outlook leaves the bar for a disappointment low. The rate decision is announced at 10.00 CET.
In Sweden, we get the Prospera inflation expectations at 8.00 CET. As it is the monthly survey release it covers only money market participants' views, and it comes as a final piece of the puzzle ahead of the Riksbank policy meeting next week. The survey will most likely show inflation expectations close to target on all horizons, and as such not alter the market's pricing of gradual rate cuts ahead.
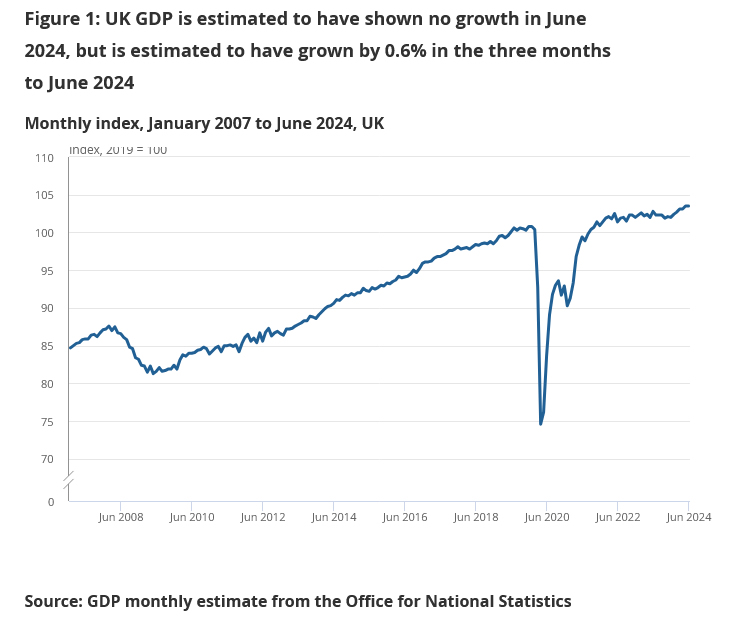
In the UK, we get GDP figures for both Q2 and June at 8.00 CET. Analysts expect growth of 0.6% q/q in Q2 (prior 0.7%), and 0.0% growth m/m in June (prior 0.4%).
At 14.30 CET we get the retail sales numbers out of the US. According to Reuters polls analysts expect headline retail sales to come in at 0.3% m/m (prior 0.0%), whereas core retail sales are expected to come in at 0.1% m/m (prior 0.4%).
Fed's Musalem (voting member) and Harker (not voting member) both speak at 15.10 CET and 19.10 CET, respectively.
Economic and market news
What happened yesterday
In the US, both headline and core CPI came in at 0.2% m/m seasonally adjusted in line with expectations. It marked the third consecutive month of core inflation standing at 0.2% m/m seasonally adjusted, hence the inflationary trend is on the right track in the US, despite still too high headline inflation.
In Sweden both the headline CPIF and CPIF excl. energy surprised to the upside compared with analysts' expectations. Headline CPIF rose to 1.7% y/y (prior 1.3% y/y) with especially hotels and restaurants contributing towards this. CPIF excl. energy fell to 2.2% y/y (prior 2.3% y/y). The Riksbank had forecast CPIF at 1.8% and CPIF excl. energy at 2.2%, hence this should justify a cut of 25bp at next week's policy meeting, something which both we and markets expect as it is also fully priced in.
In the UK CPI came in slightly lower than expected as headline CPI printed 3.4% y/y and core CPI printed 2.2% y/y both 0.1p.p. lower than consensus amongst analysts.
What happened overnight
China released their monthly batch of data overnight, which came in close to expectations but still paint a weak picture of the economy. Retail sales increased from 2.0% y/y to 2.7% y/y (consensus 2.6% y/y), which is still very weak spending by Chinese households. There are also few signs of improvement in the housing crisis. New home prices declined 0.65% m/m again in July after 0.67% m/m in June while home sales stayed around a level of 90m m2, still much below the pre-pandemic level of 160m m2. Industrial production dropped from 5.3% y/y to 5.1% y/y (consensus 5.2% y/y) and down from a level close to 7% during spring. In sum, the data confirms that China is still mired in a housing crisis, weak consumer spending and a loss of momentum in industrial activity in recent months. It calls for a new round of stimulus to reach the government's 5% target and we expect to see new stimulus announcements soon.
In Japan, GDP growth for Q2 this year came in at 0.8% q/q beating consensus amongst analysts of 0.5%. This follows three weak quarters. Most importantly, private consumption increased by 1%. Despite the renewed focus on the weak yen, a return to growth and private spending moving in the right direction were probably prerequisites for the Bank of Japan to move along with normalising policies. Equity markets have reacted positively to the data release with the Nikkei 225 up around 1.1% this morning.
UK GDP flat in June, up 0.6% qoq in Q2
UK GDP showed no growth in June, matched expectations. Services output fell by -0.1% mom after five consecutive monthly increases. Production grew by 0.8% mom. Construction grew by 0.5% mom.
For Q2, GDP grew 0.6% qoq, matched expectations. Services grew by 0.8% qoq. Production fell -0.1% qoq. Construction also fell -0.1% qoq.
US CPI Backs Fed Rate Cut Expectations
It's been two weeks since I left, and in that time, the markets plunged into chaos. Now that I'm back, things have finally returned to calm waters.
Quick thoughts on the August meltdown
The fact that the Japanese yen saw a heavy post-Bank of Japan (BoJ) reaction is of course due to the accumulation of a high amount of short yen positions over the past few years on the divergence between the BoJ and the other central bank policies. And the very-late normalization of the BoJ has given hope that the abnormally soft BoJ policy is over. But there is little chance we see the BoJ act again to normalize further anytime soon. This is the message that the BoJ members – which were apparently not expecting such a BIG reaction - have been trying to give to calm down the upset traders. The USDJPY almost hit the 140 level last week during a massive carry unwind. The pair has rebounded since then and is trading near the 147 level at the moment and could eventually return and stabilize around the 150 level until further notice.
And for the US, the weak jobs data of two weeks ago - that helped trigger a further mayhem across the global markets - doesn’t mean that the US economy will collapse by next month. And investors know that. The proof is how fast the prices in the S&P500 rebounded with the sight of the slightest good news from last week’s weekly jobless claims from the US- a data point which is very much volatile and normally doesn’t trigger a notable market reaction. All eyes are on the weekly claims today.
Good news from inflation data
Anyway, good news is that inflation numbers from the US and the UK came in softer-than-expected this week. Inflation in the UK inflation rebounded from 2% to 2.2% in July versus a rebound to 2.3% expected by analysts while core inflation eased from 3.5% to 3.3% - more than expected by analysts. Headline inflation in the US fell below the 3% mark.
More importantly, the services inflation - which is what made inflation numbers so sticky in the developed world - also showed a better cooling last month. Time will tell how much of the services disinflation was due to Taylor Swift but the latest figures hint that the Federal Reserve (Fed) could start cutting the rates in September and other major central banks like the European Central Bank (ECB) and the Bank of England (BoE) could continue lowering theirs to the year end. As such, in the aftermath of the latest data from the major economies, the BoE is expected to announce two more 25bp rate cuts by the end of the year, the ECB is seen cutting its rates by 65bp - say two more times this year and up to six times by the end of 2025. And the Fed is seen cutting its rates by a whooping 100bp this year. A possible 50bp cut in September followed by two 25bp cuts for the last two FOMC meetings of the year.
Activity on Fed funds futures gives around 63% chance for a 25bp cut and 37% chance for a 50bp cut next month. The suspense could last until the next jobs report which will give a clearer idea on how much of the weakness of the latest jobs data was due to Hurricane Beryl – meaning how much of it was a temporary slowdown. I believe that a 25bp is more plausible based on the current data. Therefore, the weakness of the US dollar will certainly get balanced out if the Fed cut expectations slow down. As such, I expect the USD index to see support near the ytd low levels and limited room for a further upside momentum in the EURUSD above the 1.10 mark.
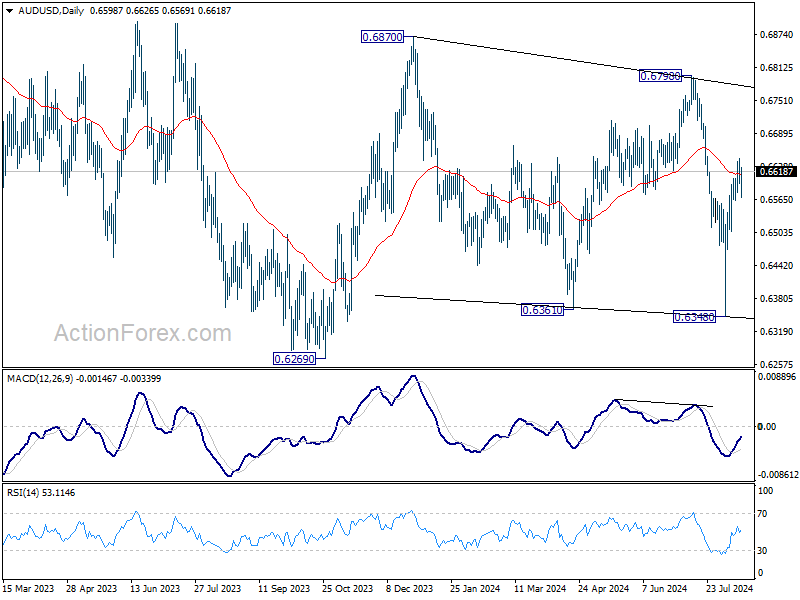
AUD/USD Daily Report
Daily Pivots: (S1) 0.6596; (P) 0.6617; (R1) 0.6655; More...
A temporary top should be in place at 0.6642 in AUD/USD with the current retreat and intraday bias is turned neutral for some consolidations. Further rally is expected as long as 0.6506 support holds. Above 0.6442 will extend the rebound from 0.6348 to 0.6798 resistance next.
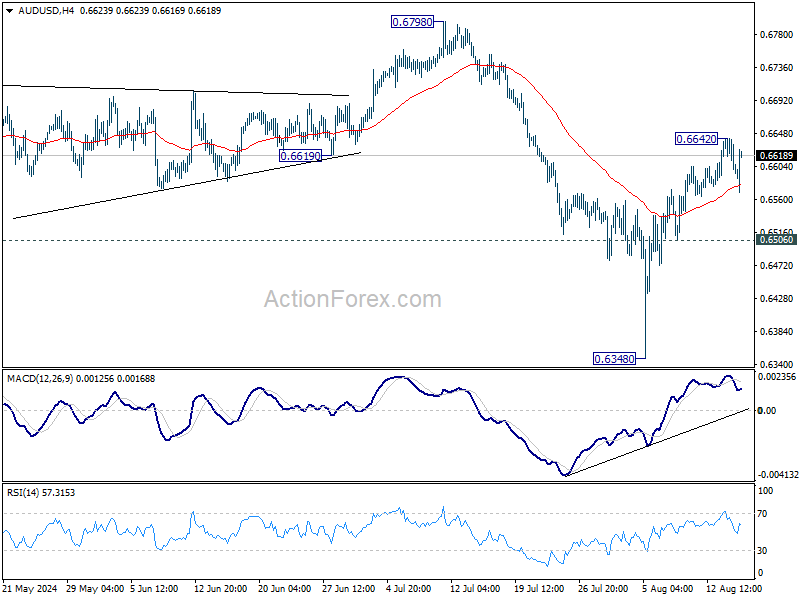
In the bigger picture, overall, price actions from 0.6169 (2022 low) are seen as a medium term corrective pattern, with fall from 0.6798 as another falling leg. Deeper fall could be seen to the lower side of the range between 0.6169/6361. But strong support should be seen there to contain downside. Meanwhile, break of 0.6798 will target upper side of the range at 0.7156.
Aussie Rises on Strong Job Growth, But Gains Limited
Australian Dollar strengthened during Asian session today, buoyed by stronger-than-expected employment growth data. This positive surprise offered some support to Aussie, though gains were limited, failing to push the currency above yesterday's high. The labor market report, which showed a modest increase in unemployment rate, suggests some loosening in employment conditions. While this development might be welcomed by RBA as a sign of easing pressures in the labor market, it is unlikely to influence the central bank's policy in the near term. RBA has been clear that it is not considering rate cuts this year and remains focused on monitoring disinflation before deciding on further rate hikes.
Looking at the currency market, the Euro has emerged as the strongest performer of the week so far, followed by Aussie, and then Sterling. Conversely, Japanese Yen is struggling, marking the weakest performance, despite Japan's stronger-than-expected GDP data. Swiss Franc also underperformed, likely due to improving risk sentiment, which tends to reduce demand for safe-haven assets. The US Dollar has similarly been on the back foot, positioning as the third weakest currency. Kiwi is having a mixed week, largely stabilizing despite RBNZ's surprising dovish rate cut. Canadian Dollar is also holding a middle ground.
British Pound is struggling to find a clear direction, caught between conflicting economic signals. While the strong jobs report initially provided support, this was counterbalanced by lower-than-expected inflation reading, muddied the outlook. The upcoming GDP data could be crucial in providing the Pound with a firmer sense of direction.
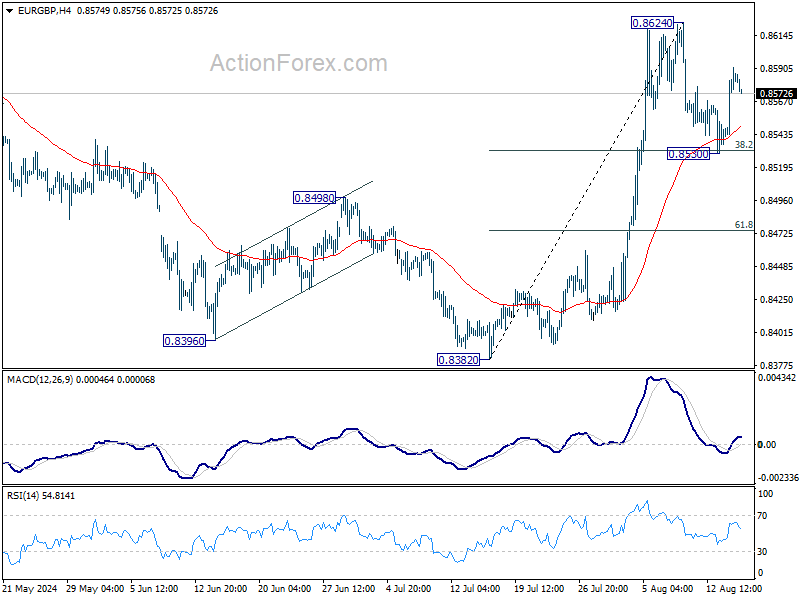
Technically, EUR/GBP's strong rebound from 38.2% retracement of 0.8382 to 0.8624 at 0.8532 keep its near term outlook bullish. Focus is now on whether EUR/GBP could break through 0.8624 to resume the rally from 0.8382.
In Asia, at the time of writing, Nikkei is up 0.60%. Hong Kong HSI is up 0.14%. China Shanghai SSE is up 0.83%. Singapore Strait Times is up 0.93%. Japan 10-year JGB yield is up 0.0231 at 0.837. Overnight, DOW rose 0.61%. S&P 500 rose 0.38%. NASDAQ rose 0.03%. 10-year yield fell -0.032 to 3.820.
Japan's Q2 GDP grows 0.8% qoq on strong consumption and capital spending
Japan's economy showed stronger-than-expected growth in Q2, with real GDP rising by 0.8% qoq, surpassing the anticipated 0.6% qoq increase. On an annualized basis, GDP surged by 3.1%, well above the expected 2.1%. This marks a significant rebound after the sharp contraction experienced in Q1, and it is the first increase in two quarters.
The recovery was largely driven by a notable rise in private consumption, which increased by 1.0%. This is particularly significant as it follows four consecutive quarters of decline, a losing streak not seen since the aftermath of the 2008 financial crisis. Additionally, capital spending grew by 0.9%, marking its first gain in two quarters.
On a nominal basis, GDP increased by 1.8% in Q2, translating to an annualized rate of 7.4%. This growth pushed Japan's GDP above JPY 600T for the first time, a milestone attributed to the ongoing inflationary pressures driven by the weakening Yen.
Australia's employment surges 58.2k while unemployment rate ticks up
Australia's labor market showed robust growth in July, with employment rising by 58.2k, significantly surpassing expectations of 26.5k. This increase was driven by a strong gain in full-time employment, which rose by 60.5k, while part-time employment saw a slight decline of -2.3k.
Unemployment rate ticked up from 4.1% to 4.2%, slightly higher than the expected 4.1% and marking the highest level since November 2021. This increase in the unemployment rate comes alongside a rise in the participation rate, which climbed from 66.9% to a record high of 67.1%. Additionally, the employment-to-population ratio edged up by 0.1% to 64.3%, just shy of the historical high of 64.4% set in November of last year. Monthly hours worked also increased by 0.4% mom.
Kate Lamb, ABS head of labour statistics, noted that while the unemployment rate has increased by 0.1 percentage point in each of the past two months, the record high participation rate and near-record employment-to-population ratio indicate that "there continues to be a high number of people in jobs, and looking for and finding jobs."
RBNZ's Orr signals careful and measured rate reductions
RBNZ Governor Adrian Orr outlined the central bank's approach to its recent monetary policy shift in an interview with Bloomberg TV today. Following the unexpected rate cut that initiated the easing cycle yesterday, Orr emphasized that RBNZ intends to lower interest rates toward a more neutral setting at a "careful and measured pace." This strategy is aimed at ensuring that inflation expectations remain firmly anchored at the 2% target, which Orr stated is the central bank's "single focus."
Orr expressed confidence in the central bank's course of action, noting that key indicators of inflation pressures are moving in the right direction. RBNZ has been closely monitoring "price-setting behavior," "inflation expectations," and "domestic homegrown inflation components." According to Orr, all these factors are now aligned with the goal of restoring "low and stable inflation" over the next couple of years.
Furthermore, Orr highlighted that various economic indicators are pointing toward a positive outlook for growth. "We see positive economic growth coming and we can be easing interest rates," he said, expressing optimism that New Zealand could achieve "growth without the inflation."
China's industrial production slows while retail sales beat expectations
China's economic data for July revealed a mixed picture, with industrial production growth continuing to decelerate while retail sales showed unexpected strength. Industrial production rose by 5.1% yoy, down from 5.3% in June and missing the expected 5.2%. This also marks the third consecutive month of slowing growth.
On a more positive note, retail sales increased by 2.7% yoy, accelerating from the previous month's 2.0% and exceeding expectations of 2.6%.
However, fixed asset investment growth also disappointed, rising by 3.6% year-to-date compared to the same period last year, below the anticipated 3.9%.
Looking ahead
UK will release GDP, production and trade balance in European session. Swiss will publish PPI. Later in the day, a slew of economic data from the US will be featured, including jobless claims, retail sales, Empire state manufacturing, Philly Fed manufacturing, import prices, industrial production, business inventories and NAHB housing index.
AUD/USD Daily Report
Daily Pivots: (S1) 0.6596; (P) 0.6617; (R1) 0.6655; More...
A temporary top should be in place at 0.6642 in AUD/USD with the current retreat and intraday bias is turned neutral for some consolidations. Further rally is expected as long as 0.6506 support holds. Above 0.6442 will extend the rebound from 0.6348 to 0.6798 resistance next.
In the bigger picture, overall, price actions from 0.6169 (2022 low) are seen as a medium term corrective pattern, with fall from 0.6798 as another falling leg. Deeper fall could be seen to the lower side of the range between 0.6169/6361. But strong support should be seen there to contain downside. Meanwhile, break of 0.6798 will target upper side of the range at 0.7156.
Economic Indicators Update
| GMT | Ccy | Events | Actual | Forecast | Previous | Revised |
|---|---|---|---|---|---|---|
| 23:50 | JPY | GDP Q/Q Q2 P | 0.80% | 0.60% | -0.50% | |
| 23:50 | JPY | GDP Deflator Y/Y Q2 P | 3.00% | 2.60% | 3.40% | |
| 01:00 | AUD | Consumer Inflation Expectations Aug | 4.50% | 4.30% | ||
| 01:30 | AUD | Employment Change Jul | 58.2K | 26.5K | 50.2K | 52.3K |
| 01:30 | AUD | Unemployment Rate Jul | 4.20% | 4.10% | 4.10% | |
| 02:00 | CNY | Industrial Production Y/Y Jul | 5.10% | 5.20% | 5.30% | |
| 02:00 | CNY | Retail Sales Y/Y Jul | 2.70% | 2.60% | 2.00% | |
| 02:00 | CNY | Fixed Asset Investment YTD Y/Y Jul | 3.60% | 3.90% | 3.90% | |
| 04:30 | JPY | Industrial Production M/M Jun F | -3.60% | -3.60% | ||
| 06:00 | GBP | GDP M/M Jun | 0.10% | 0.40% | ||
| 06:00 | GBP | GDP Q/Q Q2 P | 0.60% | 0.70% | ||
| 06:00 | GBP | Industrial Production M/M Jun | 0.10% | 0.20% | ||
| 06:00 | GBP | Industrial Production Y/Y Jun | -2.10% | 0.40% | ||
| 06:00 | GBP | Manufacturing Production M/M Jun | 0.10% | 0.40% | ||
| 06:00 | GBP | Manufacturing Production Y/Y Jun | -2.40% | 0.60% | ||
| 06:00 | GBP | Goods Trade Balance (GBP) Jun | -16.0B | -17.9B | ||
| 06:30 | CHF | Producer and Import Prices M/M Jul | 0.20% | 0.00% | ||
| 06:30 | CHF | Producer and Import Prices Y/Y Jul | -1.70% | -1.90% | ||
| 12:30 | CAD | Wholesale Sales M/M Jun | -0.60% | -0.80% | ||
| 12:30 | USD | Initial Jobless Claims (Aug 9) | 239K | 233K | ||
| 12:30 | USD | Retail Sales M/M Jul | 0.30% | 0.00% | ||
| 12:30 | USD | Retail Sales ex Autos M/M Jul | 0.10% | 0.40% | ||
| 12:30 | USD | Import Price Index M/M Jul | 0% | 0% | ||
| 12:30 | USD | Empire State Manufacturing Index Aug | -5.9 | -6.6 | ||
| 12:30 | USD | Philadelphia Fed Survey Aug | 6.6 | 13.9 | ||
| 13:15 | USD | Industrial Production M/M Jul | 0.10% | 0.60% | ||
| 13:15 | USD | Capacity Utilization Jul | 78.60% | 78.80% | ||
| 14:00 | USD | Business Inventories Jun | 0.30% | 0.50% | ||
| 14:00 | USD | NAHB Housing Market Index Aug | 43 | 42 | ||
| 14:30 | USD | Natural Gas Storage | 43B | 21B |