Sample Category Title
Reserve Bank of New Zealand Pivots to Rate Cuts
Summary
- The Reserve Bank of New Zealand (RBNZ) kicked off its rate cut cycle at this week's meeting, lowering its policy interest rate by 25 bps to 5.25%. The decision was a mild surprise, with an overall majority of analysts (including ourselves) expecting the central bank would remain on hold.
- Several factors contributed to the pivot to monetary easing. The RBNZ cited slowing inflation and declining inflation expectations. Moreover, weak sentiment surveys and mixed labor market figures suggest spare capacity in the economy is likely to continue building, giving the central bank greater confidence that inflation will return to the target range in a timely fashion.
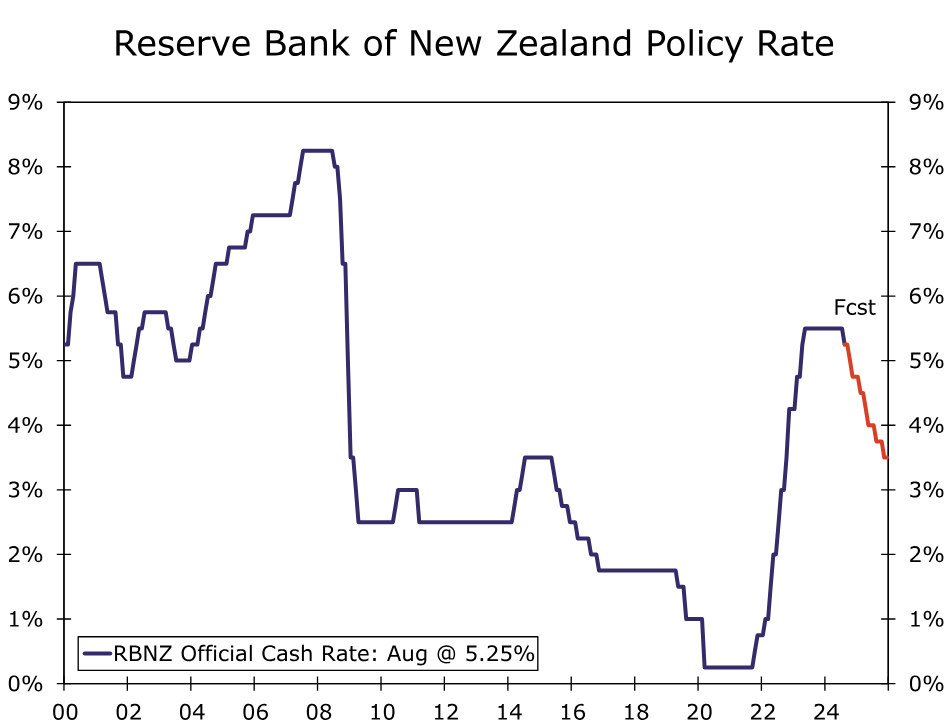
- In addition to reducing interest rates at this week's meeting, the RBNZ revised its projection for its policy interest rates to reflecting a faster pace of easing, reaching 3.85% by Q4-2025. Given the central bank's evident comfort in lowering interest rates this week (ahead of updated inflation figures), we see no significant impediments to further near-term rate cuts. We expect 25 bps rate cuts at each and every meeting through May 2025, as well as 25 bps rate cuts in August and November of next year. That would see the policy rate end 2024 at 4.75%, and end 2025 at 3.50%.
- A weak New Zealand economy and pronounced period of RBNZ monetary easing means we expect the New Zealand dollar to be an underperformer among the G10 currencies over the medium-term. We expect, at best, only modest gains in the NZ currency versus the greenback through the end of 2025.
Reserve Bank of New Zealand Kicks Off Its Rate Cut Cycle
The Reserve Bank of New Zealand (RBNZ) sprung a mild surprise at this week's monetary policy announcement, delivering a 25 bps policy rate cut to 5.25%. The consensus forecast from analysts had been for the central bank to hold rates steady, although a sizable minority had expected the RBNZ to move at this week's meeting. The RBNZ's decision also represents a relative rapid pivot from the central bank—while the RBNZ's July announcement was reasonably balanced, as recently as May the central bank had delivered a hawkish statement, including an upward revision to it projected policy rate path, suggesting at that time there was still at least some risk the central bank could hike rates further.
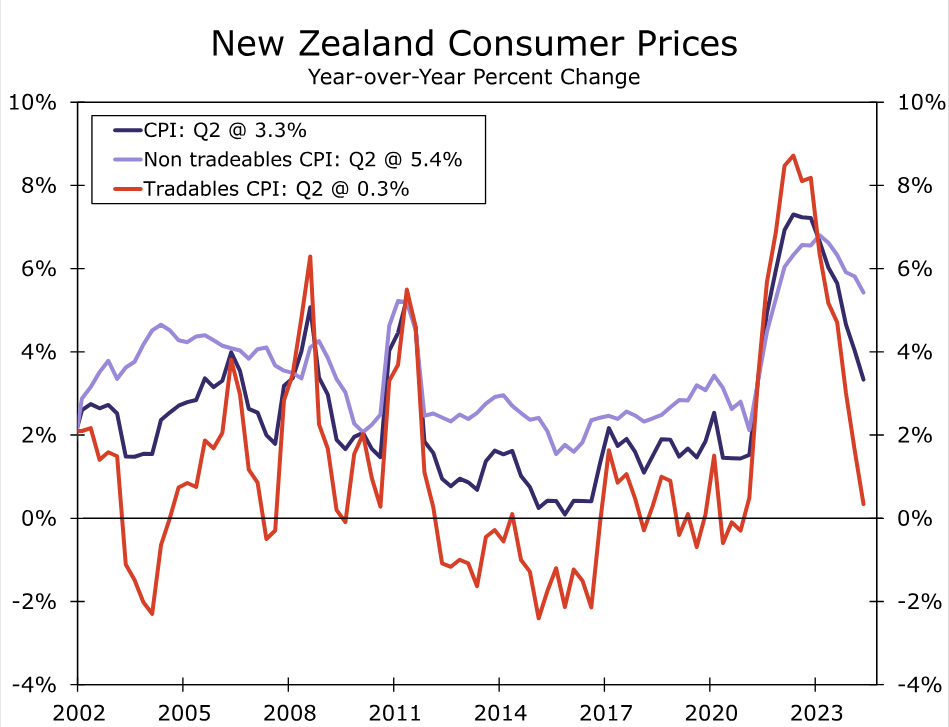
What then has changed between May and August for the RBNZ to lower its policy rate this week? On the price front, Q2 inflation surprised slightly to the downside, slowing to 3.3% year-over-year. To be sure, much of the deceleration was driven by tradables inflation, with non-tradables inflation showing a more gradual deceleration. Importantly, survey-based measures have also shown declining inflation expectations, while the Q2 Quarterly Survey of Business Opinion also showed a net 23% of firms increasing prices during the quarter, down from a net 35% that raised prices in Q1.
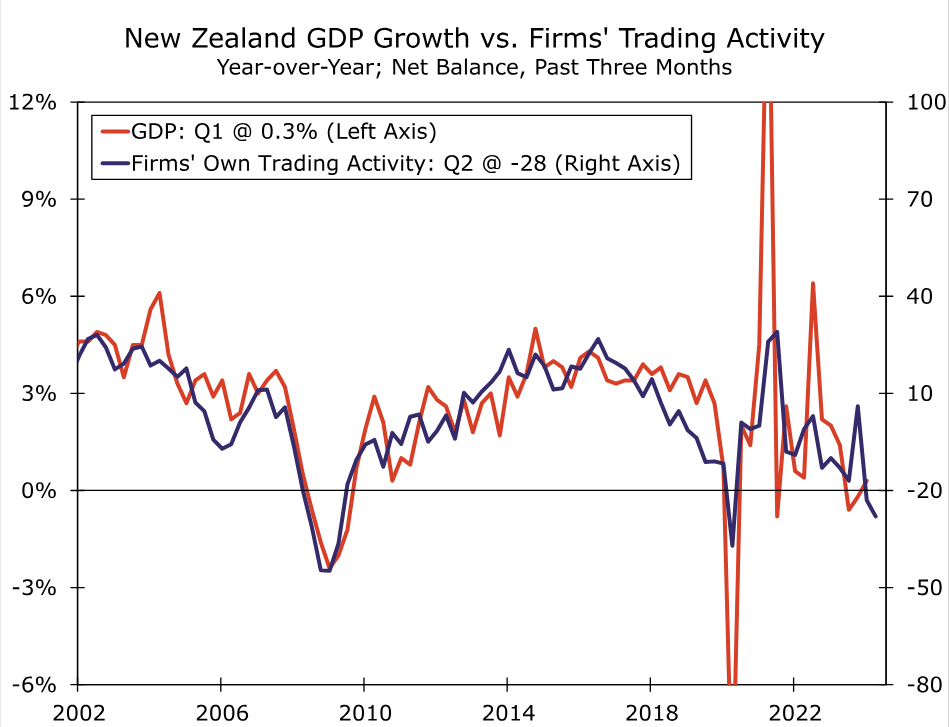
The most recent indicators on economic activity suggest the growth environment remains very weak, supporting the notion that lessening demand and increasing spare capacity should continue to see inflationary pressures abate in the quarters ahead. Although Q1 GDP rose a modest 0.2% quarter-over-quarter, a wide range of survey data point to an underwhelming economy through Q2 and into Q3. The Quarterly Survey of Business Opinion showed an increase in net pessimism to 44% in Q2, from 25% in Q1. Meanwhile, a net 28% of businesses reported a decline in their own trading activity in Q2, compared to a net 23% that reported a decline in Q1. This latter metric is particularly significant, given that firms' assessment of their own trading activity has often proved to be a reliable indicator of overall GDP growth. Other recent survey data also include a decline in the June manufacturing PMI to 41.1 and a fall in the June services PMI to 40.2. Finally, we interpret the Q2 labor market report as relatively weak overall, including a drop in full-time employment and hours worked, as well as a rise in the unemployment rate.
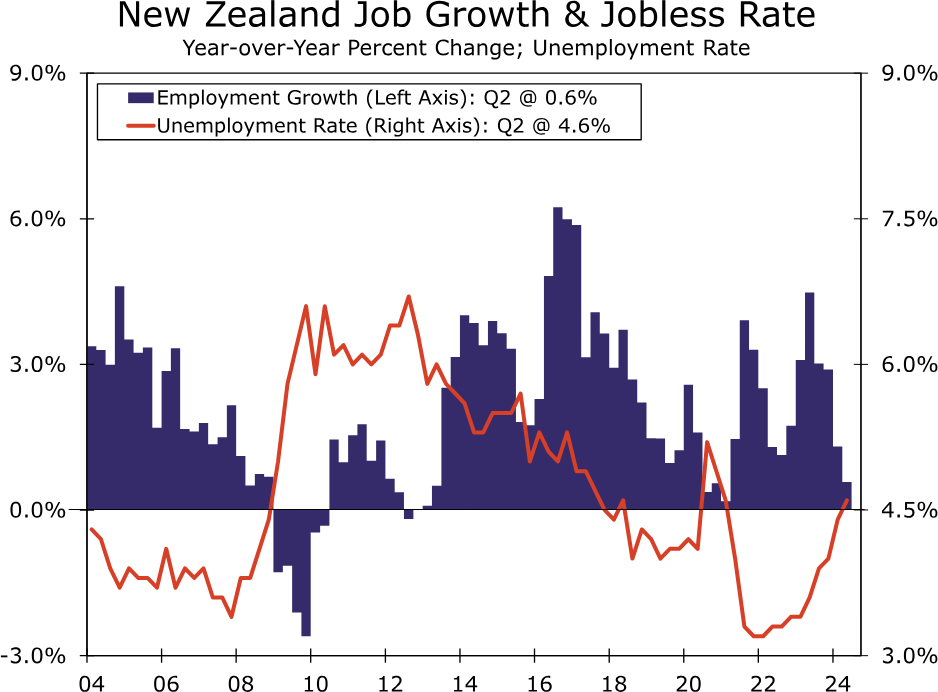
Against this backdrop, the RBNZ lowered its near-term GDP outlook, and now forecasts negative GDP growth in both Q2 and Q3. The central bank also see a higher peak in the unemployment rate than previously, reaching 5.4% by early next year. It is this larger buildup of spare economic capacity that gives the RBNZ some greater confidence that inflation is heading sustainably towards its inflation target range (indeed, the central bank sees headline inflation slowing sharply to 2.3% year-over-year in Q3-2024).
Overall, the combination of slowing inflation and weak growth saw the RBNZ offer several important perspectives as part of its August monetary policy deliberations:
- The weakening in domestic economic activity has become more pronounced and broad-based, and that a broad range of high-frequency indicators point to a material weakening in domestic economic activity in recent months.
- Signs of slower inflation and reducing inflation expectations, combined with the weaker high-frequency indicators of economic activity, provide more confidence that headline inflation is returning to the target band in the September 2024 quarter.
- The downside risks to output and employment previously highlighted by central bank policymakers have become more apparent.
- Recent indicators give confidence that inflation will return sustainably to target within a reasonable time frame. With headline CPI inflation expected to return to the target band in the September quarter and growing excess capacity expected to support a continued decline in domestic inflation, the Committee agreed there was scope to temper the extent of monetary policy restraint.
Not only did the RBNZ lower interest rates at this week's meeting, but revised its projections for the policy interest rate path lower, signaling the likelihood of a series of rate cuts in the quarters ahead. The central bank projected an average policy rate of 4.92% for Q4-2024, falling to 3.85% by Q4-2025 and 3.13% by Q4-2026. Given the central bank's evident comfort in lowering interest rates this week (ahead of the Q3 inflation figures), we see no significant impediments to further near-term rate cuts, and now forecast 25 bps rate cuts at the October and November meetings. Beyond that the cadence of RBNZ's easing (either a pause, or a step up to 50 bps increments) will likely depend on the degree of progress of disinflation. So long as inflation trends continue to moderate, our base case is also for 25 bps rate reductions in February, April and May next year. By the second half of next year and as the central bank moves closer to a more neutral policy interest rate, we expect a more gradual quarterly frequency of policy moves and anticipate rate cuts at the August and November 2025 meetings, which would see the RBNZ's policy rate end next year at 3.50%. A weak New Zealand economy and pronounced period of RBNZ monetary easing means we expect the New Zealand dollar to be an underperformer among the G10 currencies over the medium-term. We expect, at best, only modest gains in the NZ currency versus the greenback through the end of 2025.
China’s industrial production slows while retail sales beat expectations
China's economic data for July revealed a mixed picture, with industrial production growth continuing to decelerate while retail sales showed unexpected strength. Industrial production rose by 5.1% yoy, down from 5.3% in June and missing the expected 5.2%. This also marks the third consecutive month of slowing growth.
On a more positive note, retail sales increased by 2.7% yoy, accelerating from the previous month's 2.0% and exceeding expectations of 2.6%.
However, fixed asset investment growth also disappointed, rising by 3.6% year-to-date compared to the same period last year, below the anticipated 3.9%.
Australia’s employment surges 58.2k while unemployment rate ticks up
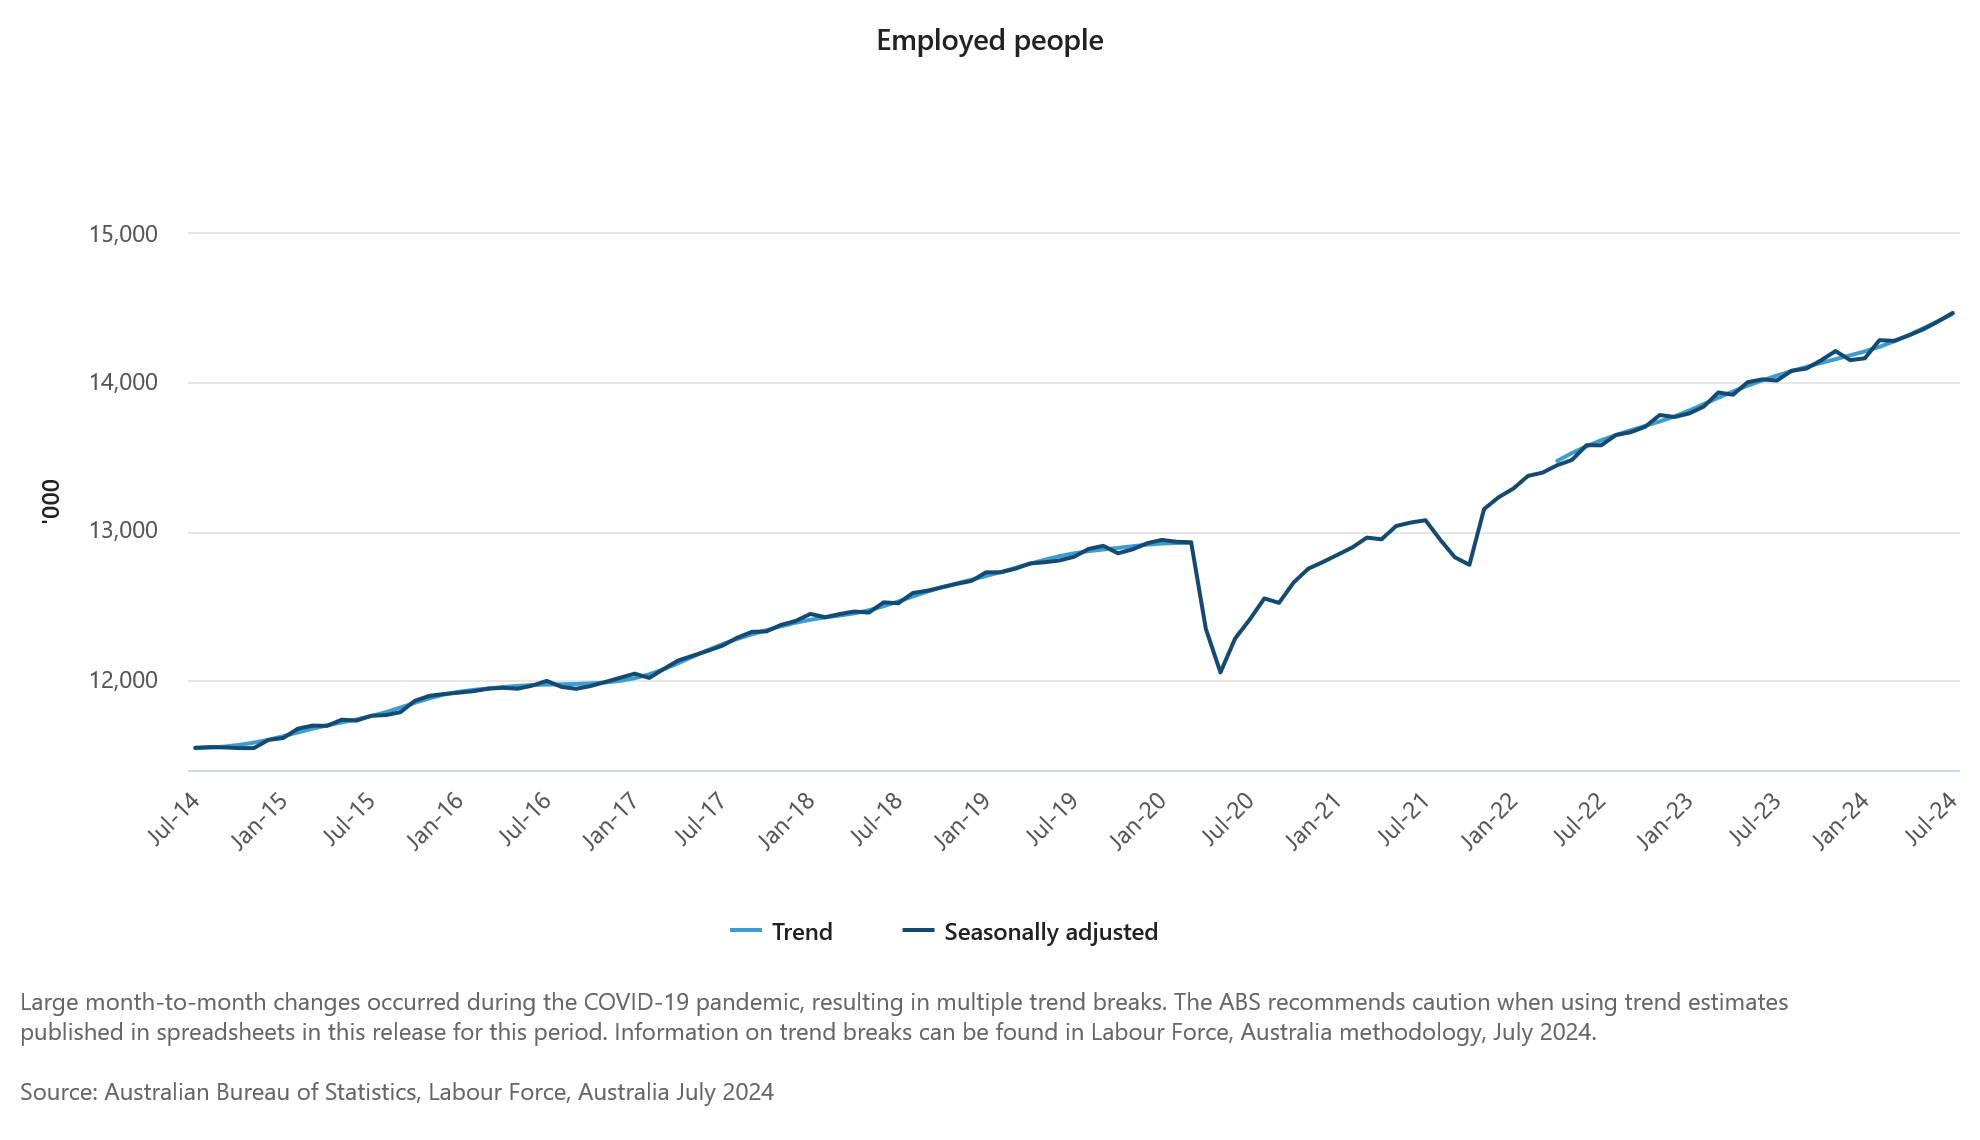
Australia's labor market showed robust growth in July, with employment rising by 58.2k, significantly surpassing expectations of 26.5k. This increase was driven by a strong gain in full-time employment, which rose by 60.5k, while part-time employment saw a slight decline of -2.3k.
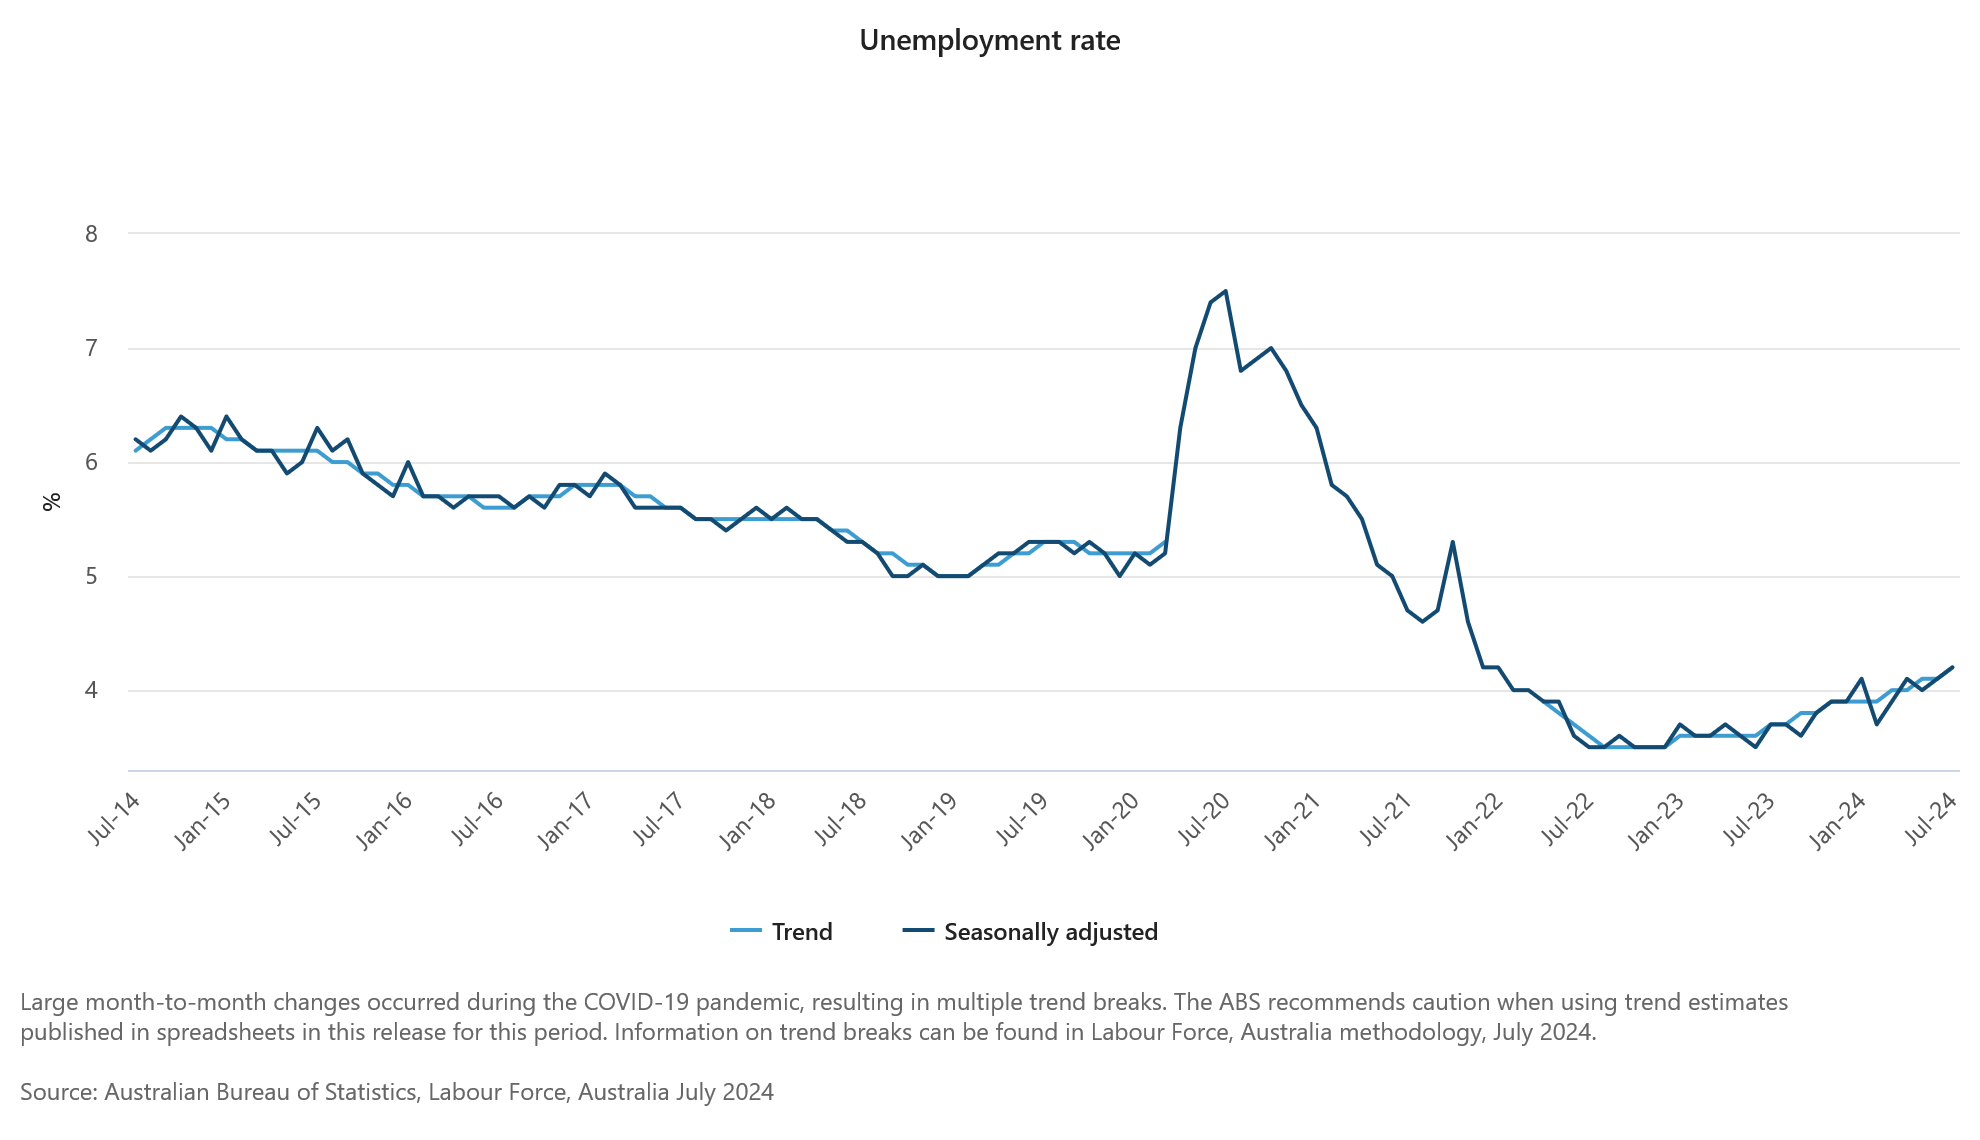
Unemployment rate ticked up from 4.1% to 4.2%, slightly higher than the expected 4.1% and marking the highest level since November 2021. This increase in the unemployment rate comes alongside a rise in the participation rate, which climbed from 66.9% to a record high of 67.1%. Additionally, the employment-to-population ratio edged up by 0.1% to 64.3%, just shy of the historical high of 64.4% set in November of last year. Monthly hours worked also increased by 0.4% mom.
Kate Lamb, ABS head of labour statistics, noted that while the unemployment rate has increased by 0.1 percentage point in each of the past two months, the record high participation rate and near-record employment-to-population ratio indicate that "there continues to be a high number of people in jobs, and looking for and finding jobs."
Japan’s Q2 GDP grows 0.8% qoq on strong consumption and capital spending
Japan's economy showed stronger-than-expected growth in Q2, with real GDP rising by 0.8% qoq, surpassing the anticipated 0.6% qoq increase. On an annualized basis, GDP surged by 3.1%, well above the expected 2.1%. This marks a significant rebound after the sharp contraction experienced in Q1, and it is the first increase in two quarters.
The recovery was largely driven by a notable rise in private consumption, which increased by 1.0%. This is particularly significant as it follows four consecutive quarters of decline, a losing streak not seen since the aftermath of the 2008 financial crisis. Additionally, capital spending grew by 0.9%, marking its first gain in two quarters.
On a nominal basis, GDP increased by 1.8% in Q2, translating to an annualized rate of 7.4%. This growth pushed Japan's GDP above JPY 600T for the first time, a milestone attributed to the ongoing inflationary pressures driven by a weakening yen.
RBNZ’s Orr signals careful and measured rate reductions
RBNZ Governor Adrian Orr outlined the central bank's approach to its recent monetary policy shift in an interview with Bloomberg TV today. Following the unexpected rate cut that initiated the easing cycle yesterday, Orr emphasized that RBNZ intends to lower interest rates toward a more neutral setting at a "careful and measured pace." This strategy is aimed at ensuring that inflation expectations remain firmly anchored at the 2% target, which Orr stated is the central bank's "single focus."
Orr expressed confidence in the central bank's course of action, noting that key indicators of inflation pressures are moving in the right direction. RBNZ has been closely monitoring "price-setting behavior," "inflation expectations," and "domestic homegrown inflation components." According to Orr, all these factors are now aligned with the goal of restoring "low and stable inflation" over the next couple of years.
Furthermore, Orr highlighted that various economic indicators are pointing toward a positive outlook for growth. "We see positive economic growth coming and we can be easing interest rates," he said, expressing optimism that New Zealand could achieve "growth without the inflation."
Crude Oil Prices Vulnerable: Is a Fresh Decline on the Horizon?
Key Highlights
- Crude oil prices struggled to clear the $80.00 resistance zone.
- A connecting bullish trend line is forming with support at $76.15 on the 4-hour chart.
- EUR/USD rallied and surpassed the 1.1020 resistance.
- Bitcoin seems to be facing hurdles near the $61,500 level.
Crude Oil Price Technical Analysis
Crude oil prices recovered above the $78.00 and $78.80 levels. It even spiked above $80.00 before the bears appeared and pushed prices lower.
Looking at the 4-hour chart of XTI/USD, the price started a fresh decline from the 80.26 level. It traded below the $78.80 and $78.00 levels. There was a test of the 38.2% Fib retracement level of the upward move from the $72.04 swing low to the $78.26 high.

The price is now testing the 100 simple moving average (red, 4-hour) and is now well below the 200 simple moving average (green, 4-hour).
Immediate resistance on the upside is near the $78.00 level. The next major resistance is near the $78.80 zone, above which the price may perhaps accelerate higher. In the stated case, it could even visit the $80.00 resistance.
If not, the price might start another decline. The first major support on the downside is near the $76.20 level or the 50% Fib retracement level of the upward move from the $72.04 swing low to the $78.26 high.
There is also a connecting bullish trend line forming with support at $76.15 on the same chart. The next major support is $75.00. Any more losses might send oil prices toward $72.00 in the coming sessions.
Looking at Bitcoin, the price started a recovery wave above the $60,000 level but the bears are protecting gains above the $61,500 level.
Economic Releases to Watch Today
- US Initial Jobless Claims - Forecast 235K, versus 233K previous.
- US Retail Sales for July 2024 (MoM) – Forecast +0.3%, versus 0% previous.
Gold Wave Analysis
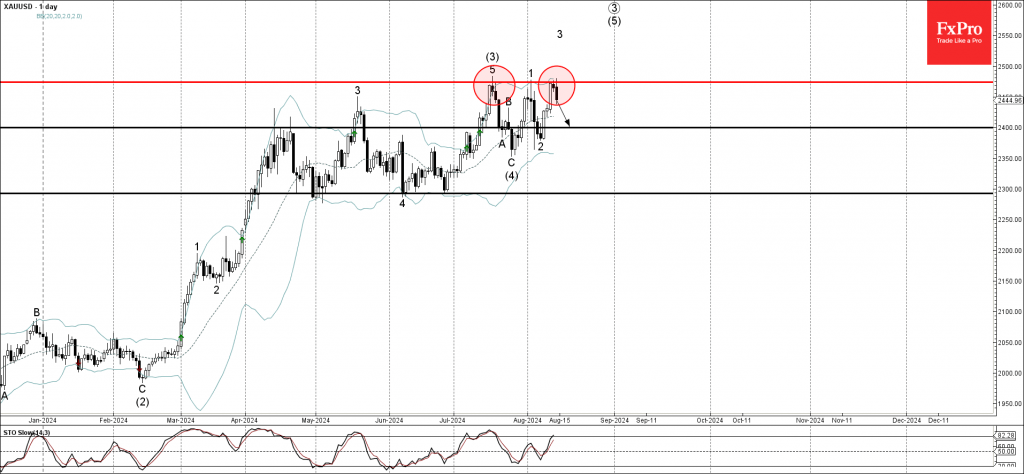
- Gold reversed from resistance zone
- Likely to fall to support level 2400.00
Gold recently reversed down from the resistance area located between the strong resistance level 2475.00 (which stopped the previous impulse waves (3) and 1) and the upper daily Bollinger Band.
The downward reversal from the resistance level 2475.00 stopped the previous impulse waves 3 and (5).
Given overbought daily Stochastic, Gold can be expected to fall further toward the next support level 2400.00.
Soft-Landing, or No Soft-Landing, That Is the Question: Part II
Part II: Quantifying Episodes of Soft-Landing, Stagflation and Recessions
Summary
- In the second part of the series, we quantify episodes of soft-landings, stagflation and recessions during the post-1950 period.
- To the best of our knowledge, we are the first to present a framework to quantify periods of soft-landing for the U.S. economy.
- Our work estimates that there are 13 episodes of stagflation and 13 episodes of soft-landings in the post-1950 era.
- According to the NBER, there are 11 recessions during the same period.
- In the next installment of the series, we'll introduce a probit framework to generate four-quarter-out probabilities of the three scenarios. These probabilities would be helpful to determine the magnitude and duration of upcoming policies, as monetary policy decisions are influenced by the near future economic outlook.
Soft-Landing, Stagflation and Recessions: The Three Potential Drivers of Monetary Policy Stances
The first part of the series introduced our framework to characterize the U.S. economic outlook into three regimes: recession, soft-landing and stagflation. As we discussed in Part I, we divide the economy into three regimes because they are structurally different and thus lead to different monetary policy stances, all else equal. For example, a recession forecast would dictate an accommodative policy stance (as seen in the past four recessions), while a stagflation prediction would require policy tightening, seen in the 1980s recessions.
To the best of our knowledge, we are the first to develop a framework to quantify periods of soft-landings for the U.S. economy. In a series published earlier this year, we estimated that there were 13 episodes of stagflation taking place in the post-1950 period, five of which were mild, four that were moderate and four that were severe. According to the National Bureau of Economic Research (NBER), there have been 11 recessions since 1950. Using these historical episodes, an analyst can build a framework to generate the probability of each scenario occurring in the near-term. Knowing these probabilities could help shine light on the potential path of monetary policy.
Quantifying Episodes of Soft-Landings: A New Approach
In our approach, we assume that a period of weak economic growth would ask for accommodative monetary policy to jump-start the economy, while strong growth may require contractionary policy to avoid overheating, all else equal. A trend-like growth period (a Goldilocks economy, for example) may be neutral ground for monetary policy. Thus, we define a soft-landing as a trend-like growth period.
We utilize Congressional Budget Office's (CBO) potential real GDP series for the U.S. economy (Figure 1) as a benchmark to identify periods of soft-landings. Additionally, we use the real GDP growth rate as a measure of the economy's output (Figure 2). In our approach, we compare the magnitude and duration of actual output growth with CBO's projections of real GDP.
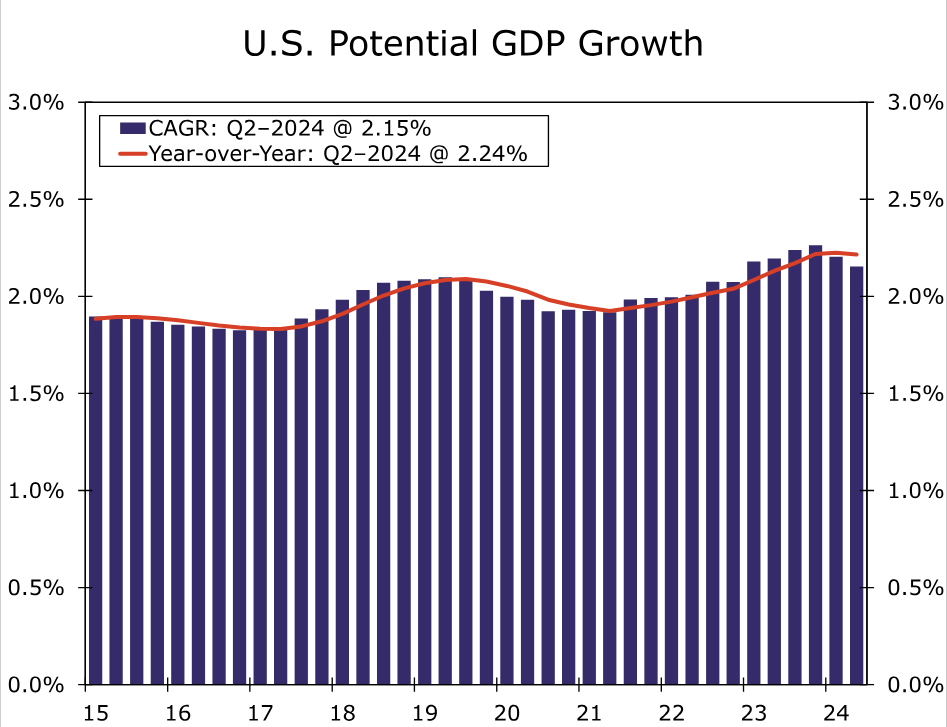
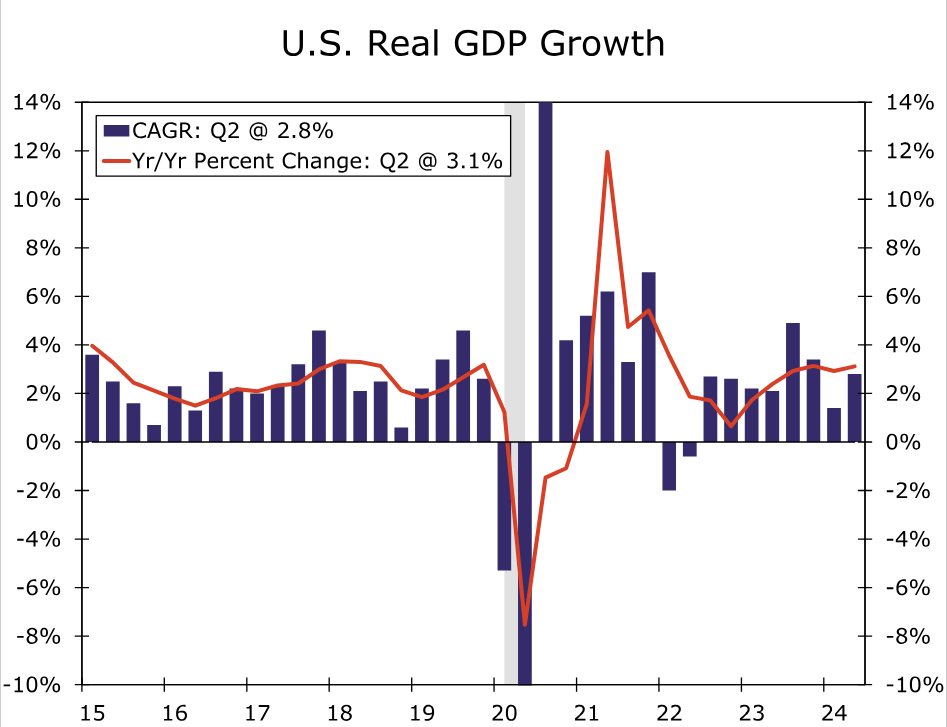
We employ a time-varying approach to capture the evolving nature of the economy. In the first stage, we utilize NBER business cycle dates to divide CBO's potential real GDP growth rates into periods of recession and expansion. In the second stage, we characterize each expansion period into episodes of weak or strong soft-landings using the mean and standard deviation of the previous expansion as a baseline. In a real-time analysis, we would only know the past and present data, so we compare the current period's growth rate with the previous business cycle expansion's average value to judge whether it is a weak or strong soft-landing.
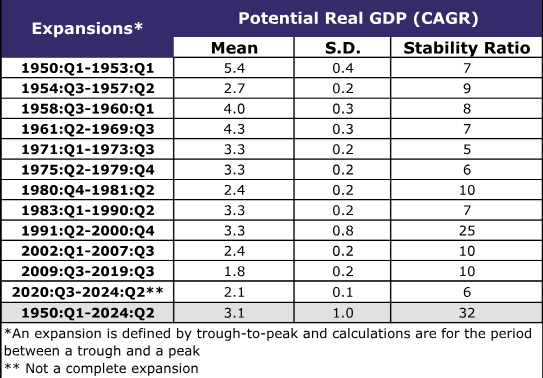
There are 12 expansions in our sample of the post-1950 period. We calculated the average growth rates along with the standard deviations and stability ratios (the standard deviation as a percent of the mean) for each of those 12 expansions. The results are displayed in Table 1.1 The expansion following the 1948–1949 recession had the strongest average potential growth rate, with a value of 5.4%. The weakest expansion in our analysis was the expansion following the Great Recession, with a 1.8% average potential growth rate.
To determine whether the expansion was a weak or strong soft-landing, we multiplied the standard deviation of the previous expansion by two and then added and subtracted that from the previous expansion's average growth rate to determine a threshold. For example, when determining the threshold for the expansionary period after the pandemic, we multiplied the standard deviation of the post-Great Recession expansionary period by two and added and subtracted that by its average potential growth rate. The calculated range would therefore be 1.4%–2.2%. So, if real GDP growth in the post-pandemic recessionary period stayed in between 1.4% and 2.2%, it would be considered trend-like growth. If it exceeded the upper limit of 2.2%, it would be characterized as strong growth. Likewise, if it fell under the lower limit of 1.4%, it would be characterized as weak growth.2 (Table 1)
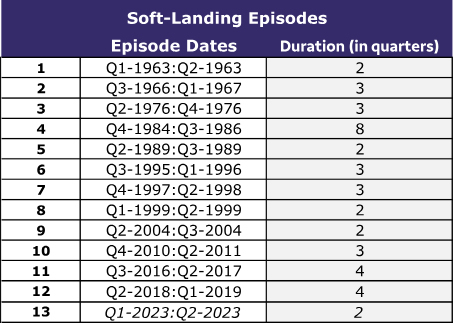
To determine the duration component of our approach, we followed the “technical recession” definition of two consecutive quarters of negative real GDP growth and set a minimum duration of two consecutive quarters of real GDP growth rates that stay within the threshold (i.e., the mean +/- two standard deviations) to classify an episode of soft-landing. Sticking with two consecutive quarters as a minimum threshold helps to remove noise from the data and provides more useful signals, in our view. For example, in our analysis, the first episode of soft-landing is for the Q1:1963–Q2:1963 period, as two consecutive quarters of real GDP growth rates stayed within the range of 3.4%–4.6% (the GDP growth rates were 3.6% and 3.8% for Q1 and Q2 1963, respectively).
Based on these criteria, our framework estimated that there are 13 episodes of soft-landings in the post-1950 era (Table 2). The longest duration of any soft-landing period was eight quarters, which occurred during Q4:1984–Q3:1986, and five episodes shared the shortest duration of two quarters. According to our analysis, the last episode of soft-landing lasted only two quarters and ended in Q2–2023. Since the last episode of soft-landing, GDP growth rates have stayed above the upper-limit of the threshold most of the time (Appendix).
Testing, Not Assuming, Would Be a Better Way To Project the Near-Term Policy Path
Rather than assuming that the FOMC may repeat the past easing cycle's behavior, we suggest that predicting the potential growth scenarios is a better path, as it is more consistent with the FOMC's mantra of “data-dependent decision-making.”
We believe NBER’s recession dates methodology and our approach of soft-landing episodes are valuable inputs to policy decisions, as they capture the recession risk and the soft-landing scenario. Including our stagflation work in the mix would complete the three major economic scenarios for monetary policy decision-making. In the next installment of the series, we'll introduce a probit framework to generate four-quarter-out probabilities of the three scenarios. By predicting the near-term likely growth scenario, the probit framework could be a valuable input to project the possible path of the upcoming easing cycle.
Endnotes
1 – We employ the compound annual growth rate (CAGR) of both potential and actual real GDP. The CAGR form is a widely utilized gauge of the current run-rate of the economy. For example, when NBER determines U.S. business cycle dates, it uses the CAGR transformation of real GDP, in addition to other variables, to determine a given recession’s peak and trough.
2 – We employed two S.D. plus/minus the mean to establish upper and lower limits of our threshold to determine periods of soft-landings. We followed the so-called “Three-Sigma” rule where mean plus and minus two S.D. would capture about 95% of the data series—i.e. the statistical confidence level would be 95%. For more detail about the Three-Sigma rule, see Huber, Franz. 2018. A Logical Introduction to Probability and Induction. New York: Oxford University Press, 2018.
Appendix
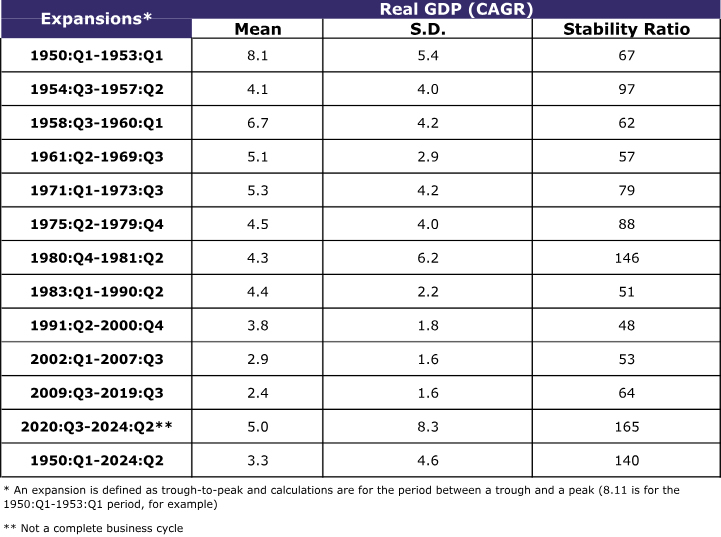
As a robustness check to our proposed framework, we explore alternatives to our employed benchmark of CBO’s potential real GDP series. One alternative could be the real GDP growth rate akin to NBER’s recession approach that heavily relies on real GDP in addition to several other variables. We provide mean, standard deviation and stability ratios based on real GDP (CAGR) for each expansion since 1950, like in Table 1. The largest mean is 8.1% for the 1950–1953 expansion, and the lowest average value of 2.4% is associated with the post-Great Recession era. The stability ratio column indicates that the series is very volatile, as the smallest value is 48 (the S.D. is about half of the average value) for the 1991–2000 expansion. Moreover, the two S.D. rule would be misleading, as the smallest two S.D. is 3.2% (for the post-Great Recession era), which would create a wide range of -0.8% and +5.6% and declare the entire post-Great Recession era as a soft-landing. Therefore, we stick to CBO’s potential real GDP as a benchmark to identify soft-landing episodes.
Sunset Market Commentary
Markets
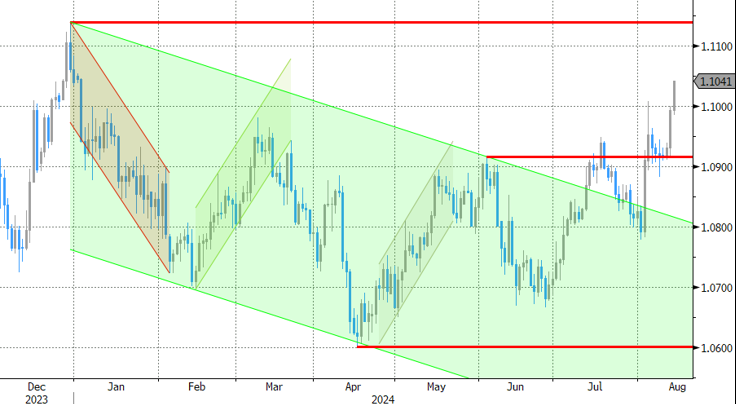
July US CPI inflation figures printed very close to consensus. Monthly inflation accelerated both on a headline and on a core level to 0.2% M/M. Details showed food prices rising by 0.2% M/M, energy prices flat, and services (ex. energy) rising by 0.3% M/M. The main disinflationary impact came again from used cars and trucks where prices dropped by 2.3%. Shelter costs remain sticky at 0.4% M/M. Y/Y-inflation nudged slightly lower on the top (2.9% from 3%) and on the underlying level (3.2% from 3.3%). Supercore services inflation (stripping out food, energy, goods and shelter costs) accelerated to 0.2% M/M after two months of decline (4.5% Y/Y). Today’s dull set of data strengthens Powell’s case to start cutting the policy rate at the September meeting, but doesn’t settle the debate on the magnitude of such first cut. US money markets take some chips off the table after pushing the probability of a 50 bps move to over 60% in the wake of yesterday’s benign CPI’s. The next reference is next week’s Jackson Hole Fed symposium (Thursday – Friday). Based on data published since the July 31st FOMC meeting, we don’t expect Powell to already pre-commit to one thing or the other. Early September activity and labour market data are the ones to watch in this respect. US yields today rebound up to 4 bps at the front end of the curve (2-yr). The slight underperformance against Germany (+2 bps) doesn’t really help out the dollar. EUR/USD pierced the psychologic 1.10 barrier already early today and at 1.1035 sticks with its gains. The December 2023 top at EUR/USD 1.1139 remains the next reference with the dollar unable to comeback as long as the market plays with 50 bps Fed rate cut idea. US stock markets open marginally positive (+0.2%).
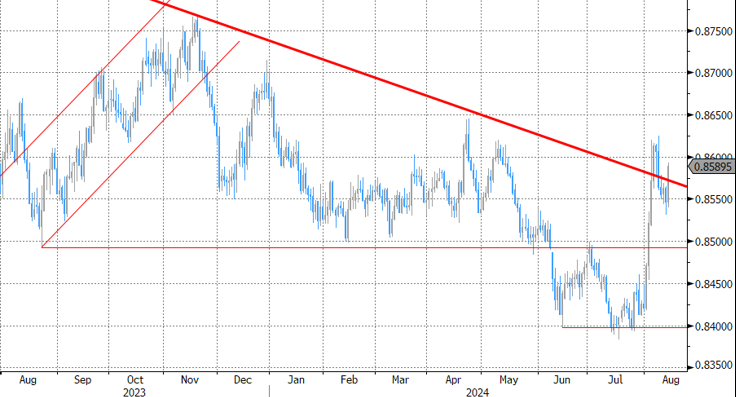
Headline UK CPI fell by 0.2% M/M (vs -0.1% M/M) with the annual figure rising to 2.2% from 2% (vs 2.3% forecast). Core CPI slowed to 0.1% M/M and 3.3% Y/Y (from 3.5% Y/Y). The more benign inflation print suggests the BoE’s close call to cut its policy rate by 25 bps early August was the right one with follow-up action becoming very likely. UK Gilts outperform with the belly of the curve dropping over 6 bps. EUR/GBP spikes from 0.8540 to 0.8590.
News & Views
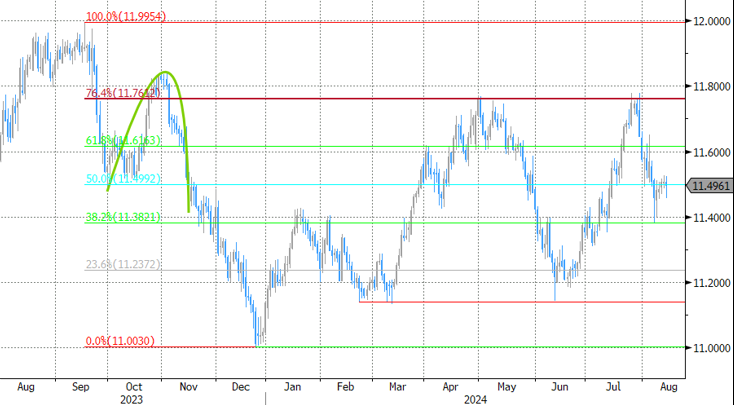
Swedish headline inflation rose by 0.1% M/M in July on the headline level with the Y/Y-figure stabilizing at 2.6%. Housing costs continue to be the largest contributor as well as rising fees for rented and tenant-owned appartments. The higher housing costs were partly offset by lower electricity prices. The inflation rate according to the Swedish Riksbank’s preferred CPIF (Consumer Price Index with fixed interest rate) was 1.7% Y/Y (+0.1% M/M), up from 1.3% in June. That’s below the central bank’s 1.8% forecast and suggests that they will able to put their words (two to three extra rate cuts by year-end) into action. They meet next on August 20 with money markets completely discounting a 25 bps rate cut and even contemplating the possibility of a larger (50 bps) cut. The Swedish krone didn’t respond to today’s data which were broadly in line with consensus. EUR/SEK currently changes hands just below 11.50.
The chairman of the world’s largest steel company, Baowu Steel Group, said the sector now faced a crisis more acute than the downturns of 2008 and 2015, likening the conditions to a “severe winter” and highlighting a need to preserve cash. A weakening of China’s property sector, fading hope on significant stimulus and the treat of a US recession all have their impact. YTD output lags last year’s pace at Chinese mills with key product prices collapsing. Iron ore futures fell to $95.2 a ton, the lowest level since May last year.
Graphs
EUR/USD: heading to 1.1139 resistance
EUR/GBP: benign CPI print triggers Gilt outperformance and pullback in sterling
EUR/SEK: Swedish krone unmoved by CPI data
US 2-yr yield: no additional 50 bps rate cut bets after “dull” US CPI print