Sample Category Title
Bitcoin (BTC/USD) Soars Amidst Surging ETF Inflows
- Increased investor confidence fueled by a $1.04 billion inflow into Bitcoin Spot ETFs.
- Bitcoin miners, particularly in the US, are accumulating Bitcoin in anticipation of another potential rally, with Marathon Digital Holdings aiming to significantly increase its hashrate.
- Technically, Bitcoin’s breakout above a long-term descending trendline suggests further upside potential.
Bitcoin prices enjoyed somewhat of a renaissance over the weekend bursting back above the 60k mark and taking out some key technical hurdles in the process.
Bitcoin Spot ETF Net Inflow (USD) data reveals an inflow of $1.04 billion last week, indicating rising investor confidence and potentially suggesting a short-term increase in Bitcoin’s price. Market participants are also hoping that an approval of the ETH ETF may lead to further inflows in the days and weeks ahead as market participants diversify their crypto holdings.
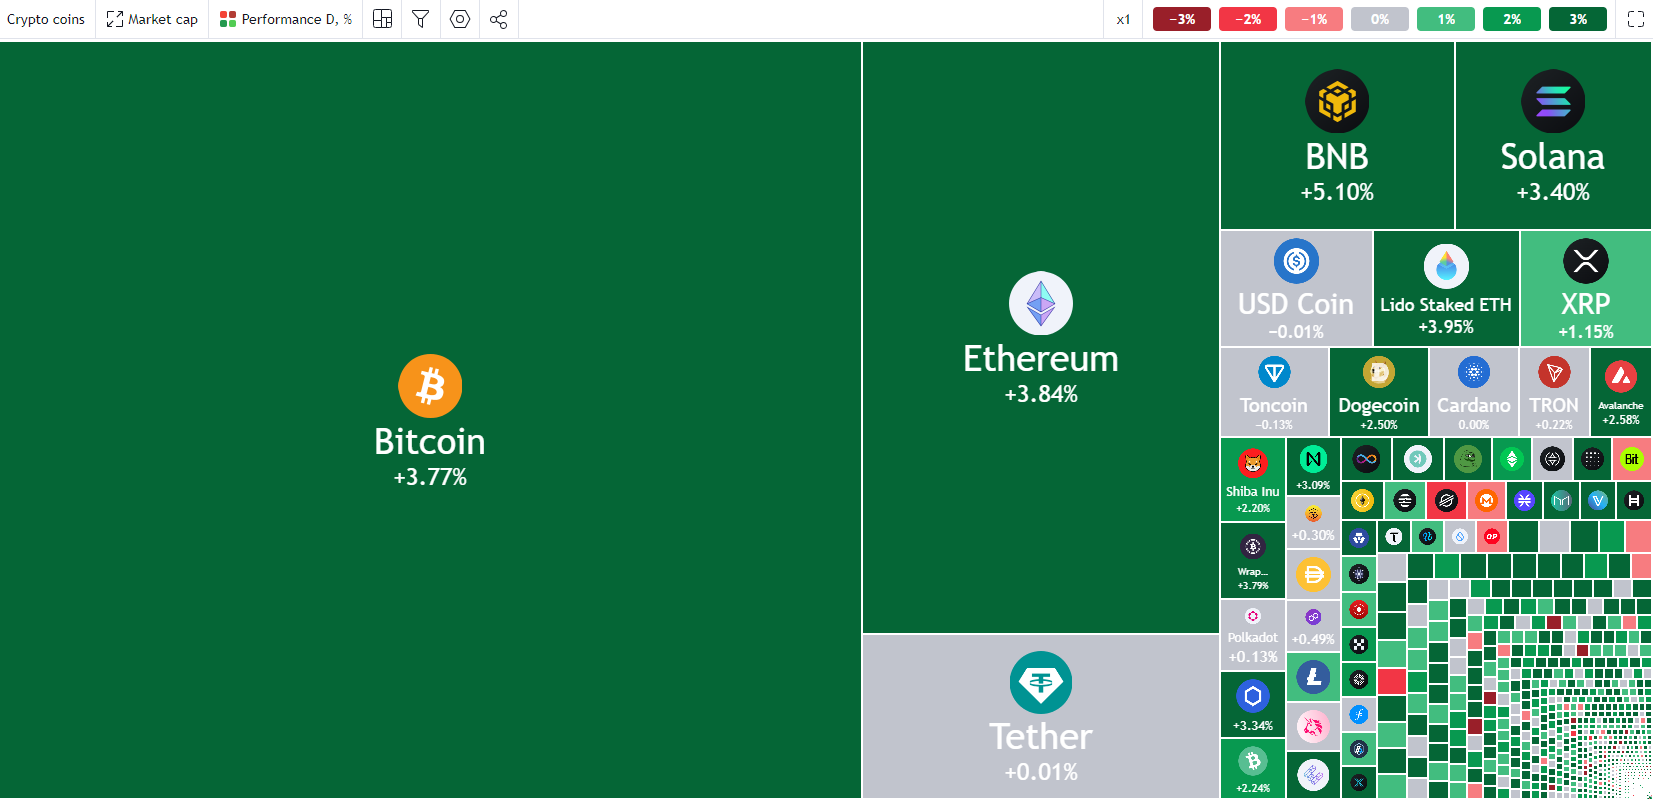
Source: TradingView.com (click to enlarge)
The conclusion of the German Government’s Bitcoin sales provided some relief, but ongoing uncertainty regarding Mt.Gox repayments might still pose challenges for bullish investors.
The attack on US Presidential Candidate Donald Trump further fueled the Bitcoin recovery. Trump has vowed to allow miners to remain active while also confirming that he will ensure every American has the right to self-custody of their digital assets and transact free from Government control. Given the probability of a Trump election rising it is no surprise that sentiment in the crypto space received a significant boost. Marathon holds 18,536 Bitcoin worth over $1 billion, up 48% from 2023’s total of 12,538.
Bitcoin miners are also in a race against time and their own competition when it comes to upping Bitcoin mining capacity. Companies such as Marathon and CleanSpark are looking to up their hashrate to improve their mining output.
Miners Opt to Accumulate Bitcoin
Bitcoin miners in the US are accumulating Bitcoin as market participants eye another rally. There are big names on the list like Marathon Digital Holdings whose CFO mentioned that Bitcoin is different from other asset classes when it comes down to what to consider. Marathon is targeting a hashrate of 50 (EH/s) by the end of 2024, up from a 31.5 (EH/s).
Bitcoin advocate and influencer Michael Saylor returned to the spotlight as Bitcoin began its latest move. The co-founder and the Executive Chairman of business intelligence giant MicroStrategy has taken to his account on the X platform to comment on the Bitcoin price increase that began on Sunday.

A simple message but clearly Saylor sees more upside ahead for BTC/USD.
Technical Analysis BTC/USD
From a technical standpoint, Bitcoin has surged above the long-term descending trendline, suggesting further upward potential. However, the rally faces strong resistance just below the crucial 65k level, where both the 50-day and 100-day moving averages (MAs) are positioned.
If the MAs reject the price, Bitcoin could retrace to the support levels at 61,750 or 59,300, aligning with the 200-day MA. This would also involve a retest of the trendline, which did not occur after the breakout.
Should Bitcoin surpass the 65,000 mark, the next key levels on the upside would be the 70,000 and 71,900 handles.
Support
- 61750
- 59311 (200-day MA)
- 56561
Resistance
- 64030
- 65000
- 70000 (psychological level)
- 71935
Bitcoin (BTC/USD) Daily Chart, July 15, 2024
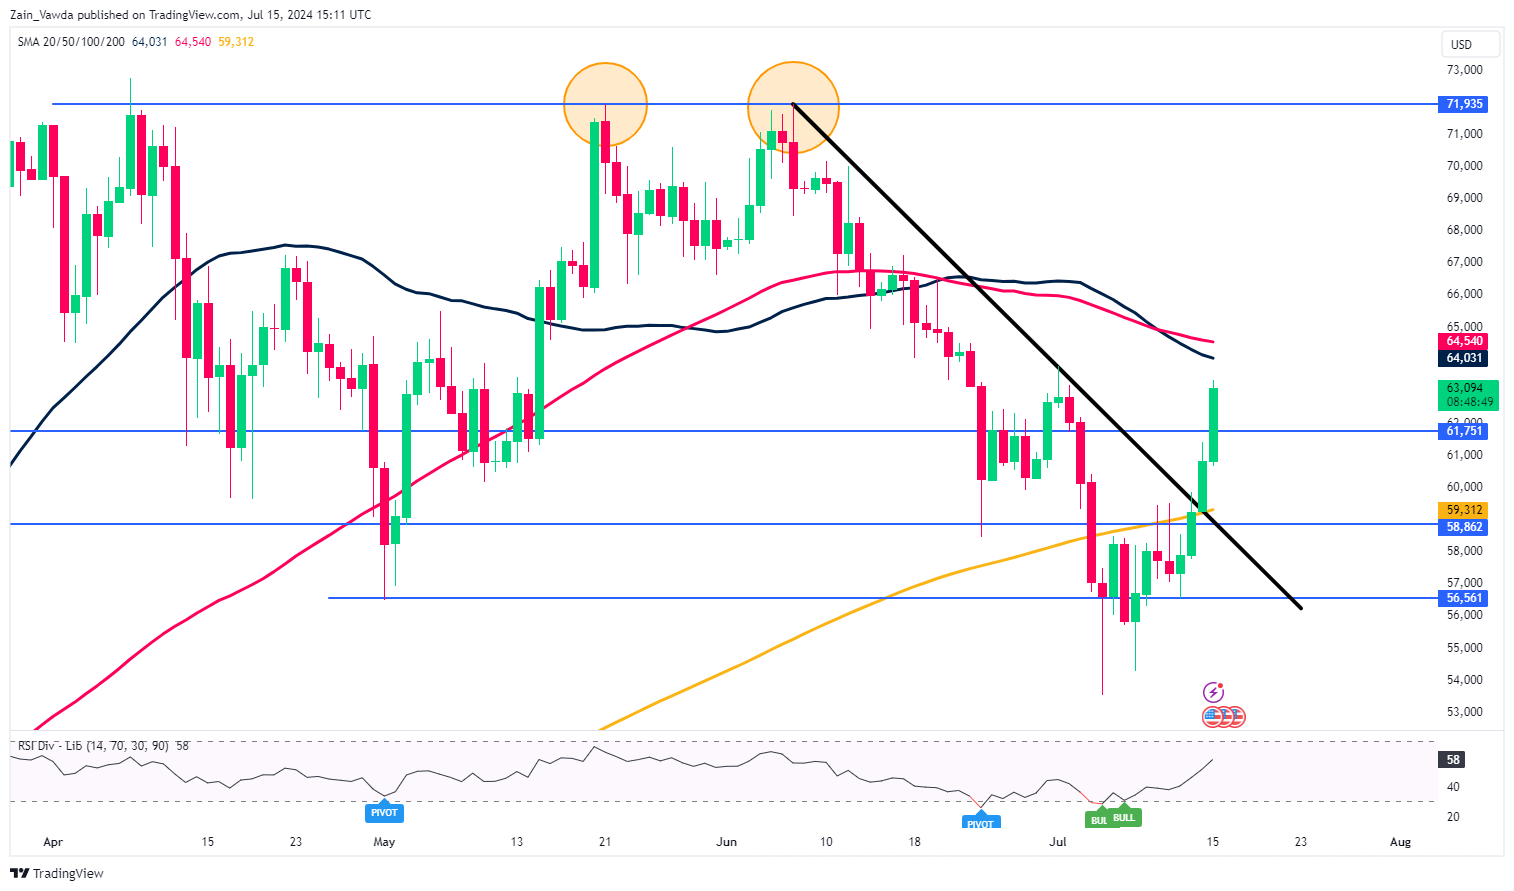
Source: TradingView.com (click to enlarge)
Natural Gas Wave Analysis
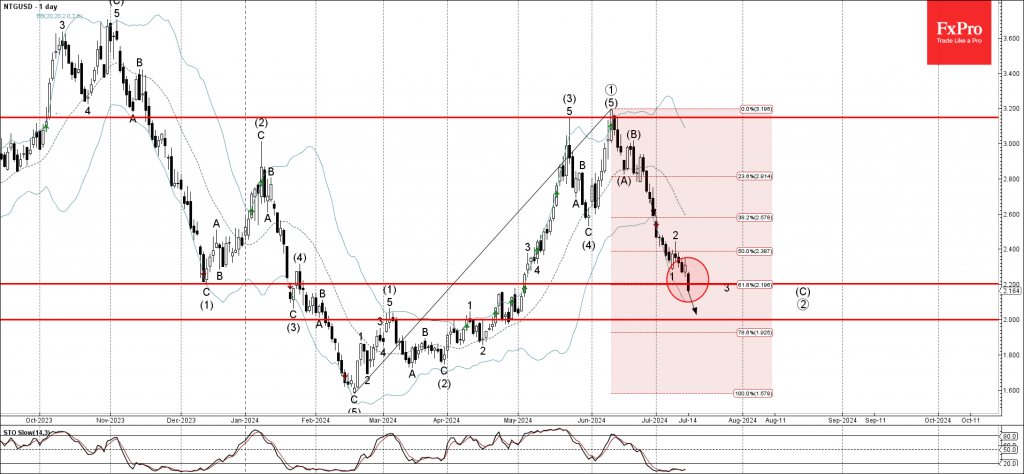
- Natural gas broke key support level 2.200
- Likely to fall to support level 2.00
Natural gas recently broke the key support level 2.200, intersecting with the 61.8% Fibonacci correction of the sharp upward impulse from February.
The breakout of the support level 2.200 accelerated the active impulse wave 3 of the sharp downward impulse wave (C) from the end of June.
Given the clear daily downtrend, Natural gas can be expected to fall further to the next round support level 2.00 (former minor support from April).
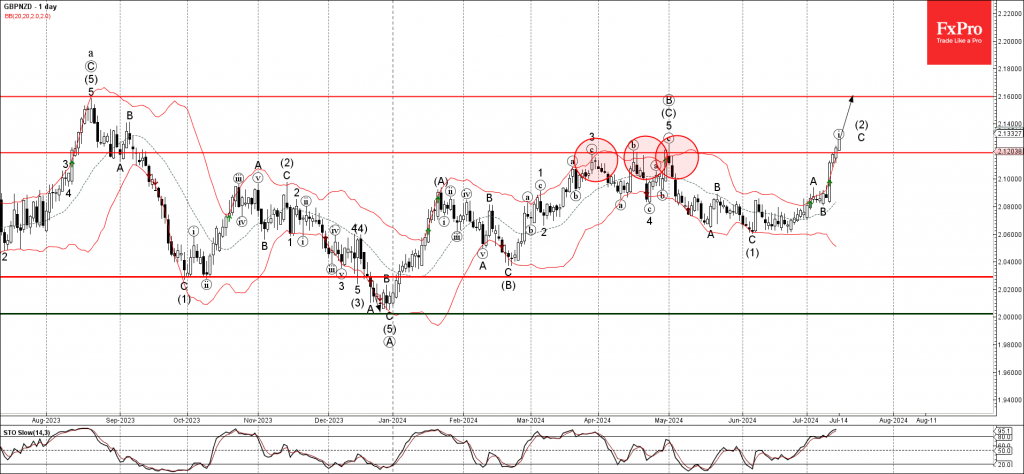
GBPNZD Wave Analysis
- GBPNZD broke pivotal resistance level 2.1190
- Likely to fall to support level 2.00
GBPNZD recently broke above the pivotal resistance level 2.1190, which reversed the price multiple times from March to May.
The breakout of the resistance level 2.1190 accelerated the active impulse wave C of the intermediate ABC corrective wave (2) from the start of June.
Given the clear uptrend and the strongly bullish sterling sentiment, GBPNZD can be expected to rise further to the next resistance level 2.1600 (former multi-month high from August and the target for the completion of the active wave C).
BoC BoS: Business and Consumer Sentiment Remained Downbeat in the Second Quarter
According to the Bank of Canada Business Outlook Survey (BOS), Canadian business sentiment remained unchanged and somewhat downbeat in the second quarter of 2024. The BOS indicator, a statistical summary of survey results, was -2.90 in 2024 Q2 (vs. -2.39% in 2024 Q1).
Meanwhile, the share of firms preparing for a potential recession in the coming year declined to 20% (from 27%) with uncertainty around domestic factors, such as weaker demand, economic performance, cost and tax policy outweighing concerns about labour shortages and supply chains.
Firms’ indicators of future sales remained weak relative to its historical average and suggests that economic growth will remain sluggish. Expectations of weak demand are especially notable when observed through the lens of firms whose sales are tied to discretionary spending – roughly one-third of firms in this category expect sales to decline in the next 12 months. In contrast, firms whose sales depend on consumers’ essential spending and residential real estate expect higher sales alongside still strong population growth and lower interest rates.
Weak consumer demand and strong immigration are contributing to continuous easing in the labour market conditions, driving lower expectations for wage growth. In turn, slowing wage pressures combined with increased competition driven by weak demand continue to limit firms' plans for abnormal price increases, helping to normalize pricing behavior. This should support disinflationary pressures, keeping inflation expectations inside the Bank’s inflation-control range.
According to the parallel Canadian Survey of Consumer Expectations (CSCE), consumers' sentiment also remained subdued and broadly unchanged from the previous quarter.
The two major drivers of pessimism remain high inflation and high interest rates. As in the previous survey, households are planning to reduce or postpone purchases, with the share of consumers expecting to cut spending and save more remaining near survey-high levels.
While consumers' perception of current inflation remained high, expectations for inflation one year ahead showed a sizeable improvement from 4.9% to 4.1%. As noted by the Bank of Canada, consumer perceptions of inflation continue to be higher than actual consumer price index inflation, with consumers citing high government spending and elevated housing costs as major causes of high inflation. Meanwhile, longer-term (2- and 5- year) inflation remained mainly unchanged and well-anchored.
Key Implications
Both business and consumers remain pessimistic about future economic prospects. The good news is that businesses are expecting some easing in wage and price pressures, while consumers are also adjusting their near-term inflation expectations. Nevertheless, households continue to be concerned about elevated prices and high interest costs, and are planning to reduce spending in the coming year. Weaker consumer demand remains widespread and is acutely felt by businesses, which are increasingly affected by competitive market pressures.
The overall tone of the surveys released a week before the Bank of Canada's next monetary policy decision, builds a solid case for another rate cut. In the absence of Q2 data from the National Income and Expenditure Accounts, the collective signals from indicators point to easing inflation expectations, moderating wage pressures and a softening economic backdrop. Should June's CPI data (released on Tuesday) indicate an easing of inflationary pressures, the Bank of Canada will have more reason for another rate cut. Markets are currently attaching at 78% probability to a July rate cut.
A Clearer Shape of a Long-Term Dollar Decline
While Trump’s rise to power is widely seen as a positive for the dollar, the dollar index hit a one-month low on Monday as it continues to rebound from the Fed’s latest softening tone and inflation slowdown.
The impact of Trump’s policies on the dollar is largely based on the experience of his previous presidential term. As president, he imposed tariffs on imports and cut corporate taxes. Both elements are on his economic agenda again. Tariffs potentially reduce imports to curb trade deficits. Tax cuts encourage capital inflows.
However, both factors began to affect the dollar only after these policies kicked in. In addition, lawmakers effectively blocked these changes in the early months, making an early bet on the fundamental trend counterproductive.
Among the fundamentals, speculation around expectations for a Fed rate cut is now more influential. By the end of last week, markets were factoring in 3 consecutive cuts this year, starting in September, as the most likely scenario. Quite a bearish turn for the dollar, as only a couple of months ago, one of the working scenarios was ‘no cuts’ until the end of 2024.
Technical factors are as much a determinant of the dollar’s momentum as anything else, in our view. This July, the dollar index has been under a sell-off, falling out of an upward corridor from the lows of late last year. The downward impulses came on important news: NFP pushed the dollar index through support; Powell’s speech broke it under the 50-day MA; reaction on the CPI resulted in a dive below the 200-day MA.
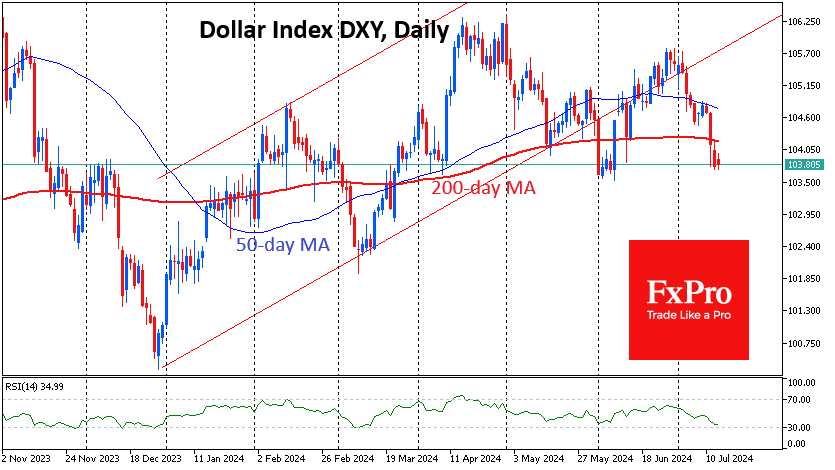
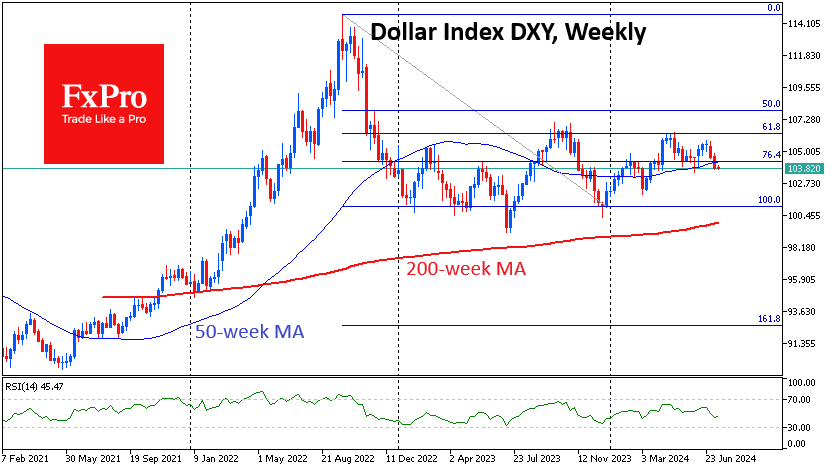
The most cautious bears may wait for a failure under 103.70, where the DXY has found support in early June and April. This opens the way for the index to 100, close to the area of last year’s lows. A leg below would activate a deeper dollar decline scenario with a potential target at 90-92.50, where the lower boundary is the area of 2018 and 2021 lows, and the upper one is 161.8% of the downside momentum from the September 2022 peak to the 2023 support area.
Bullish Pound Eyes $1.30 Ahead of UK Inflation Test
- June CPI numbers the highlight of this week’s UK data flurry
- Could the Bank of England cut interest rates next month?
- Pound undeterred as it extends July gains
- Job stats and retail sales to follow Wednesday’s CPI report (06:00 GMT)
On target
Inflation in the UK peaked much higher than in other major economies during the height of the energy crisis in 2022. Logic would therefore dictate that it would take longer to come down, and that is exactly what happened in 2023, to the frustration of Bank of England policymakers. However, 2024 is looking a lot more encouraging for the UK inflation landscape, as the consumer price index (CPI) hit the BoE’s 2.0% target in May, much to the envy of other central banks such as the Fed and ECB, who have yet to achieve their respective targets.
For June, it’s likely to be more of a mixed report. The annual rate of CPI is forecast to hold steady at 2.0%, with the month-on-month rate easing from 0.3% to 0.1%. But core CPI is expected to stay unchanged at 3.5% y/y, while services CPI is projected to moderate only marginally from 5.7% in May to 5.6% y/y in June.
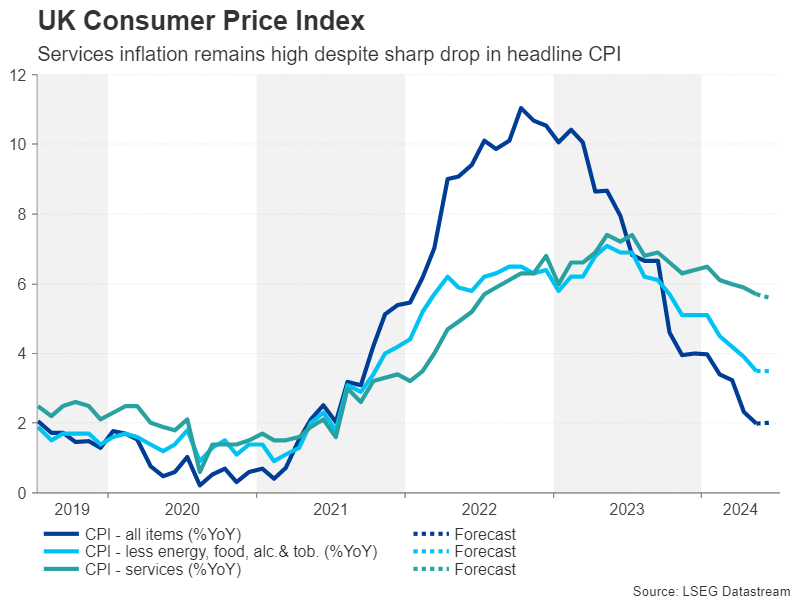
Those two underlying measures haven’t been declining as fast as the BoE would have hoped, particularly services inflation, which has some correlation with wage growth. Just as is the case with the Fed and ECB, BoE policymakers would need to see more convincing signs that both services CPI and wage pressures are subsiding in a sustainable manner.
Wages could hold rate cut key
For that reason, Thursday’s labour market data will be closely watched too. Employment is expected to have risen by 18k in the three months to May, after falling by 140k in the prior three months. The unemployment rate, meanwhile, is forecast to remain unchanged at 4.4%, having slowly edged up from the post-pandemic low of 3.5% in August 2022.
More importantly, average weekly earnings growth is projected to have slowed from 5.9% to 5.7% y/y in the three months to May, and the same reading is also expected for wage growth that excludes bonuses.
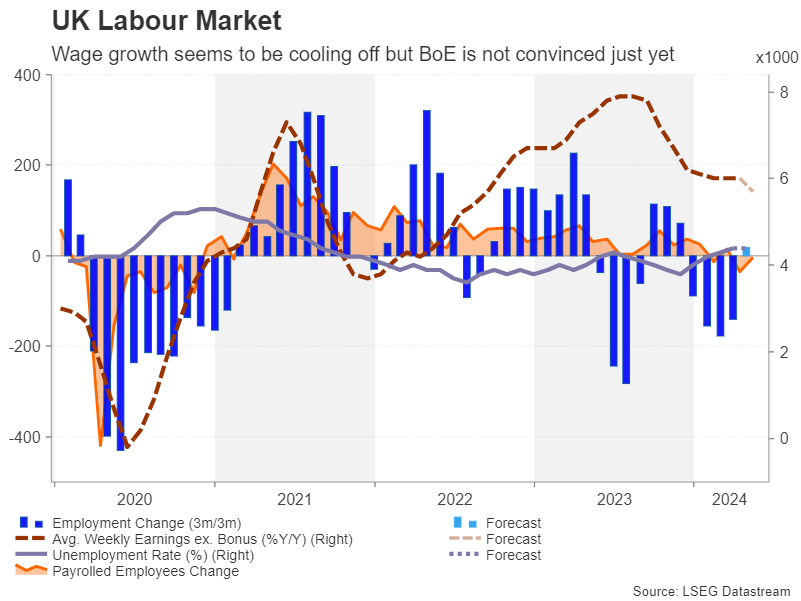
Roaring back
Although a slowdown in wage growth would be a positive development in the fight against inflation, the Bank of England is unlikely to drop its caution anytime soon and recent commentary from officials confirms this. Another reason for the BoE not to be in a rush to start cutting rates is that the economy seems to be recovering faster than expected from the shallow recession in the second half of last year. GDP grew by a solid 0.7% q/q in Q1, and second quarter growth could be just as strong.
Friday’s retail sales figures will be a good indication of how consumer spending fared at the end of Q2. After rebounding sharply by 2.9% m/m in May, retail sales likely fell back by 0.4% in June.
Pound surges despite rate cut bets
With the Bank of England’s next policy decision fast approaching on August 1, investors have assigned around a 50% probability of a 25-basis-point rate cut. This isn’t surprising considering that there doesn’t seem to be a consensus within the Monetary Policy Committee, and whatever the outcome of the August meeting, the one certainty is that it the vote will be split.
If the incoming data supports the case for an August rate cut, the pound, which has rallied more than 2.5% in July, will likely retreat from the $1.3000 area. It could potentially slip all the way down to $1.2800, which has been a frequent resistance zone over the past year and could now turn into a support level.
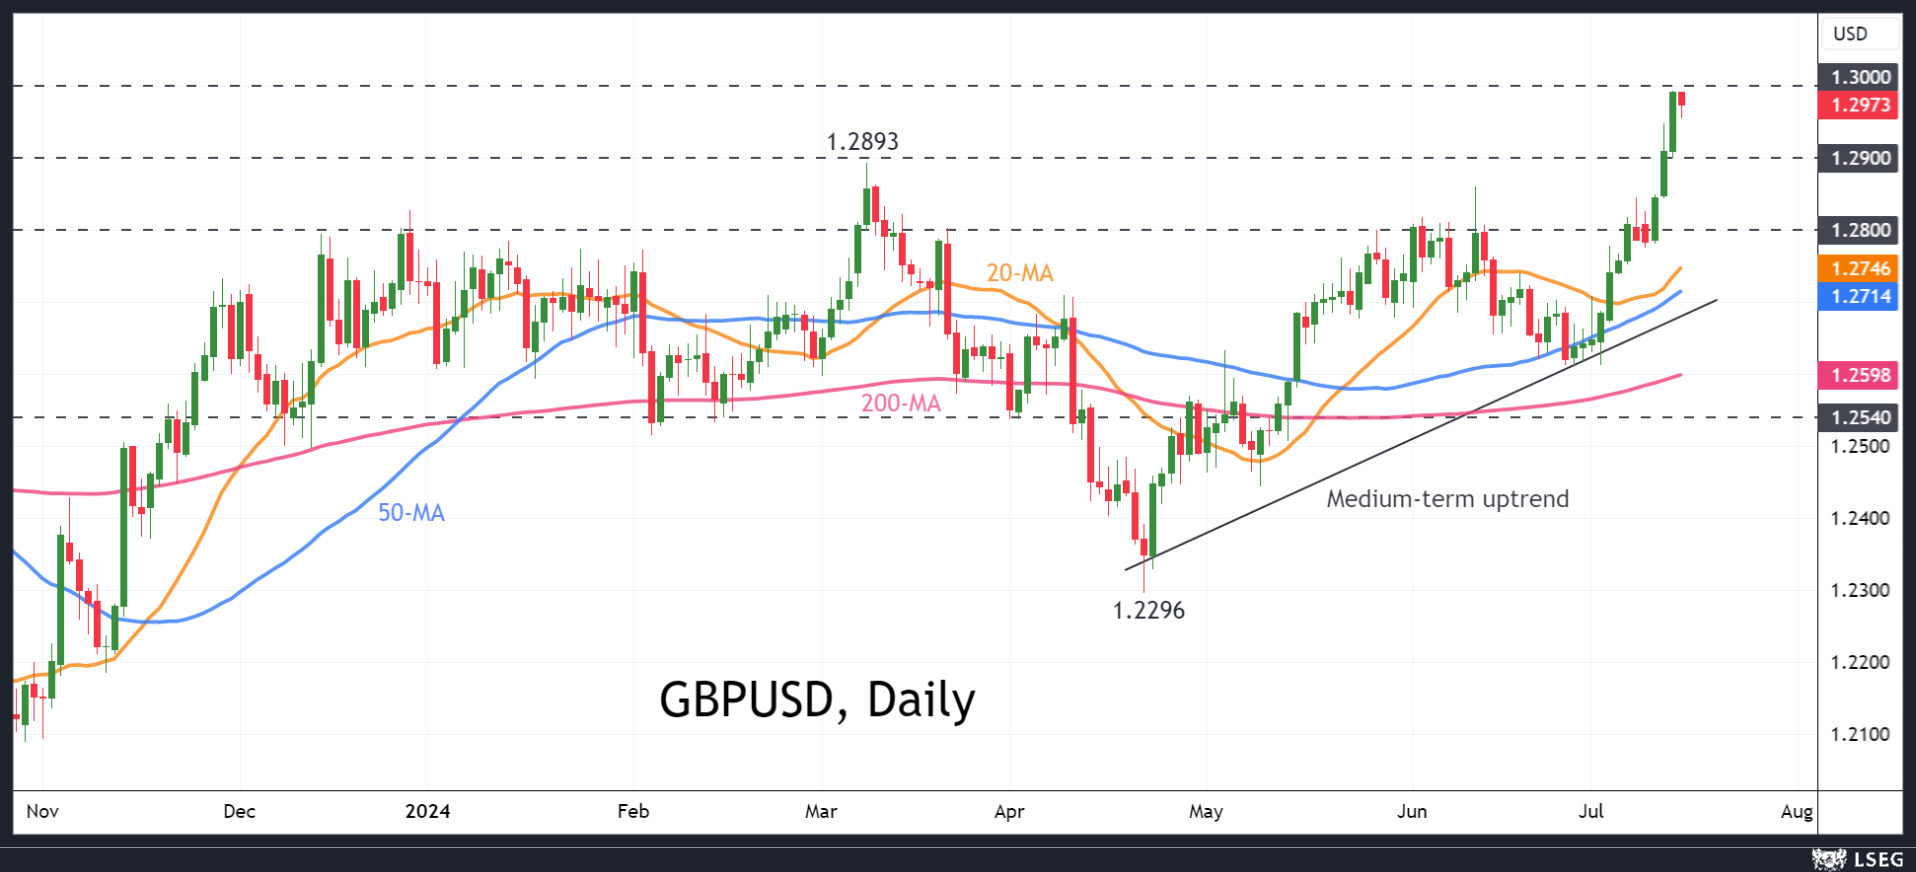
However, if the inflation and wage growth numbers are broadly stronger than anticipated, cable could break above $1.3000 and aim for the July 2023 peak of $1.3144.
A hawkish cut?
On the whole, the BoE has been gradually building the case for a rate cut, so unless there are some big upside surprises in this week’s releases, policymakers will probably take that first step and press the cut button at the upcoming meeting. The only problem is that, with an economy that’s potentially gathering steam again, how much will they be able to cut thereafter?
Either way, it seems that the brighter economic outlook combined with the end of political drama following Labour’s landslide election victory have put a floor under sterling.
News of the Week (July 15—19): EURGBP Outlook!
The EURGBP, representing the exchange rate between the Euro and the British Pound, is a key measure of economic interplay between the Eurozone and the United Kingdom. The Euro’s value is primarily influenced by the financial policies and performance of the Eurozone member states, particularly significant economies such as Germany and France. On the other hand, the British Pound is swayed by UK-specific factors, including economic data releases, political events, and decisions made by the Bank of England. Fluctuations in this currency pair often indicate shifting economic landscapes or differing monetary policies between these two major economies.
UK Consumer Price Index (CPI) YoY, July 17, 8:00 (GMT+2)
The UK CPI is forecasted to decrease slightly to 1.9% from the previous 2.0%. If the CPI data meets or exceeds this forecast, indicating stable or increased inflationary pressures, it could strengthen the Pound by suggesting economic resilience. This may prompt the Bank of England to consider tightening monetary policy sooner, potentially decreasing the EURGBP pair as the Pound gains strength. Conversely, if the CPI data falls below the forecast, indicating weaker inflation, it could weaken the Pound as it may signal an economic slowdown, potentially leading to a rise in the EURGBP pair as confidence in the Pound diminishes.
Eurozone Interest Rate Decision, July 18, 14:15 (GMT+2)
The interest rate in the Eurozone is expected to hold steady at 4.25%. If this forecast proves accurate and the ECB is satisfied with the current economic balance, the value of the Euro could remain stable, resulting in minimal immediate impact on the EURGBP pair. However, if the ECB surprises with a rate increase, indicating a more substantial commitment to combating inflation, the Euro would likely appreciate against the Pound, causing the EURGBP pair to increase as well. On the other hand, a reduction in the interest rate, or any dovish signals for future monetary policy, could devalue the Euro, leading to a decrease in the EURGBP rate as investor confidence shifts.
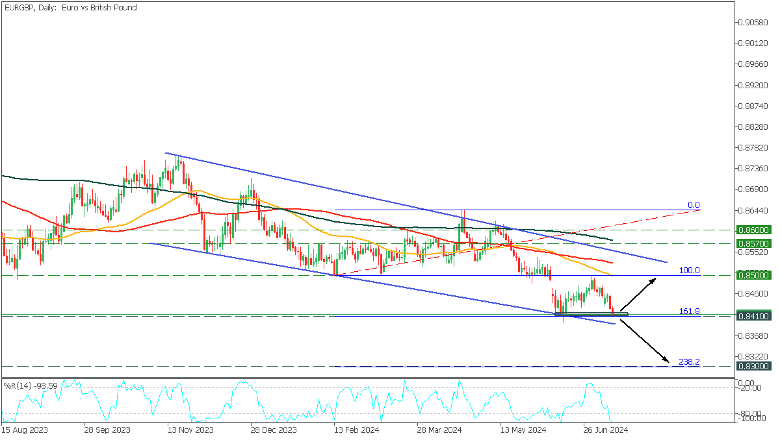
The EURGBP formed a descending channel pattern in a long-term downward movement in the Daily timeframe. The price fell to the lower trend line, testing the 161.8 Fibonacci support area. The moving averages indicate the continuation of the downtrend, but the %R indicates a significant oversold trend.
- If the price breaks the trend line and falls below 0.8410, the target will be 0.8300 level, corresponding to 238.2 Fibonacci;
- Otherwise, a rebound from the trend line will allow EURGBP to rise to 0.8500;
Sunset Market Commentary
Markets
Some segments of the US yield curve disinverted in the wake of the Trump shooting. The presidential candidate’s odds to win the November election have increased as a result. His pro-business (for the US at least) agenda is seen as a boost to the economy as well as increasing already large fiscal deficits. Ex-POTUS amongst others has pledged to extend all (individual, corporate and estate) tax cuts, some of which scheduled to end in 2025. Biden on the other hand would allow tax cuts for the wealthiest to expire and raise the corporate tax rate as well as several others. Today’s bear steepener – dubbed the Trump trade - turned the spread between the US 30-yr (+5.8 bps) and US 2-yr (-0.2 bps) back positive. This wasn’t the case since mid-2022 but for a brief spell in January of this year and in October 2023. German Bunds outperform Treasuries with yield changes varying between -1.5 and -2.2 bps across the curve. Spreads vs Germany’s 10-yr yield narrowed for the likes of Greece, Italy and Portugal. France’s was unchanged. The country’s budgetary watchdog sounded the alarm on the “worrying” state of public finances. Even before the snap elections paved the way for a hung parliament unable to take tough but necessary decisions, Cour des Comptes said president Macron’s updated (in April) program relied on “particularly optimistic” growth projections, “unprecedented” spending cuts and “vague” revenue-boosting measures. Cour des Comptes concluded that the proposed fiscal and debt trajectory “doesn’t seem to be very credible or very realistic”. French stock markets underperform European peers slightly (CAC40 -1.1% vs EuroStoxx50 -0.9%). Wall Street opens with gains of about 0.5%.
The dollar doesn’t stand to benefit from UST underperformance. EUR/USD extends an end-of-June bull run further north of 1.09. Resistance at 1.1916 (early June high) was tested but survives for now. The trade-weighted dollar index’s mirror support is located around 104, which currently serves as the neckline of a double top formation. USD/JPY stabilizes near the recent lows just above 158. The Bank of Japan is suspected of having intervened in FX markets on Friday, capitalizing on a dollar-triggered (US CPI) downleg in USD/JPY. Scandinavian currencies including the SEK and NOK (see below) underperform G10 peers today.
News & Views
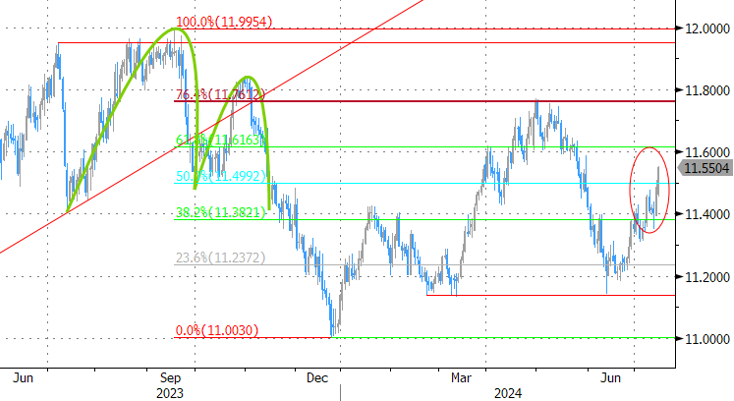
The Swedish krone (EUR/SEK 11.52) and the Norwegian krone (EUR/NOK 11.73) continue to fight an uphill battle, suffering additional selling pressure after a setback during the the second half of last week. Both countries last week reported softer than expected June CPI data. Norwegian headline inflation unexpectedly slowed to 0.2% M/M and 2.6% Y/Y and also core inflation slowed to 0.2% M/M and 3.4% (was 4.1% in May). Markets apparently concluded that this might change the view of the Norges Bank (NB) of unchanged policy rates (4.5%) through the end of this year. The Norwegian 2-y swap rate since Wednesday morning dropped almost 30 bps. A similar story is developing for the Swedish krone. Headline inflation in the country in June slowed more than expected (-0.1% M/M and 2.6% y/y). The preferred measure of the Riksbank (CPIF inflation with a fixed interest rate) even dropped further below the 2.0% target (0.0% M/M and 1.3% Y/Y). The RB was already a frontrunner by reducing the policy rate by 25bps in May. It indicated in June that two or three cuts might follow in the second half of the year. Markets now fully discount three additional 25 bps steps with the first one seen at the upcoming meeting in August.
According to a Reuters coverage of comments by Spanish Economy Minister Carlos Cuerpo in a newspaper interview with El Pais this weekend, the government expects a better than expected performance of the economy in the first half of the year to result in a higher growth forecast for this and next year. The economy performed better than expected in the first half of this year, considering strong employment data, investment and tourism. Cuerpo now expects economic growth at 2.4% this year and 2.2% in 2025. The government initially assumed 2.0% growth this year and 1.9% in 2025, but already suggested an upward revision. Spain recorded a strong 0.8% growth in Q1 of this year. Cuerpo also sees better than expected growth to contribute to the budget deficit declining to 3.0% of GDP this year and even below that EU reference next year. This process should bring the government debt-to-GDP ratio below 100% in 2027.
Graphs
EUR/SEK: Swedish (and Norwegian) krone underperform G10 peers amid softer-than-expected inflation numbers
US 30/2-yr spread turns back positive as Trump trade gains momentum
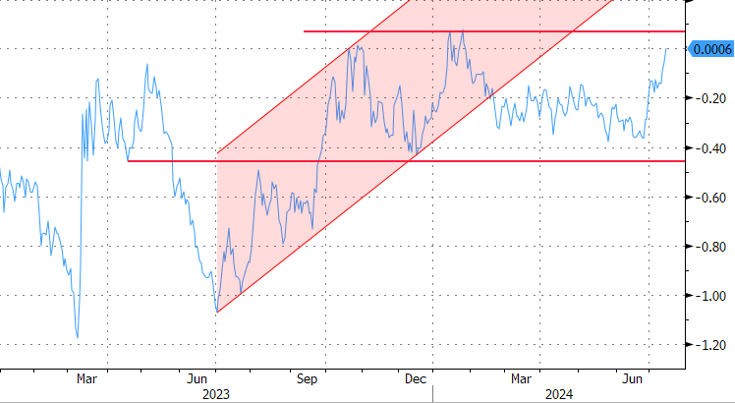
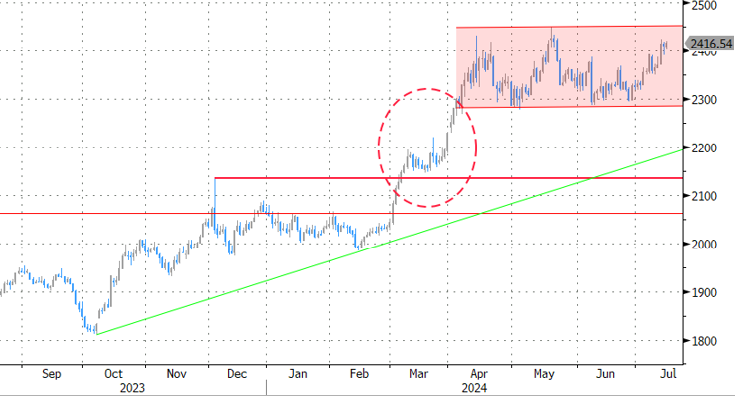
Gold ($/ounce) caught in a sideways trend channel, nearing the upper bound. Trump shooting leaves immaterial mark
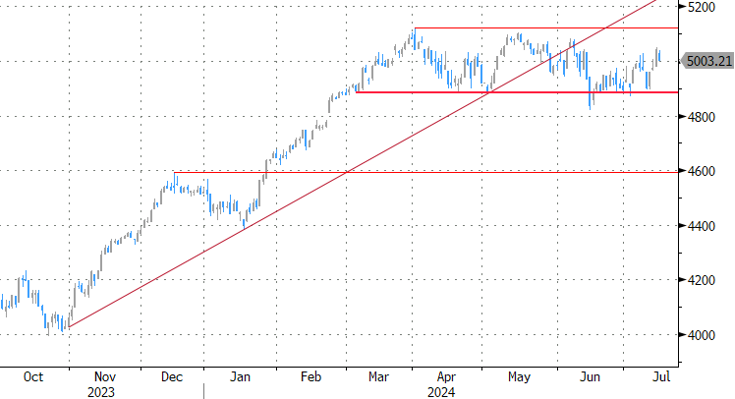
EuroStoxx50 struggles to hold north of recently reconquered 5K barrier
USD/JPY Mid-Day Outlook
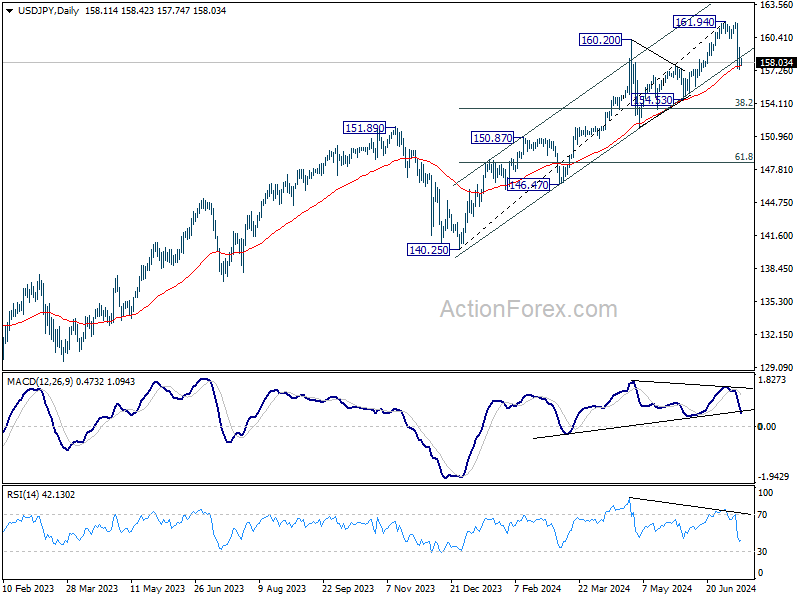
Daily Pivots: (S1) 157.03; (P) 158.24; (R1) 159.12; More...
USD/JPY's fall from 161.94 is seen as correcting the whole five-wave rally from 140.25. Deeper decline is in favor and sustained trading below 55 D EMA (now at 157.67) will affirm this bearish case. Next target will be 38.2% retracement of 140.25 to 161.94 at 163.65. Nevertheless, break of 159.44 will turn bias back to the upside for stronger rebound.
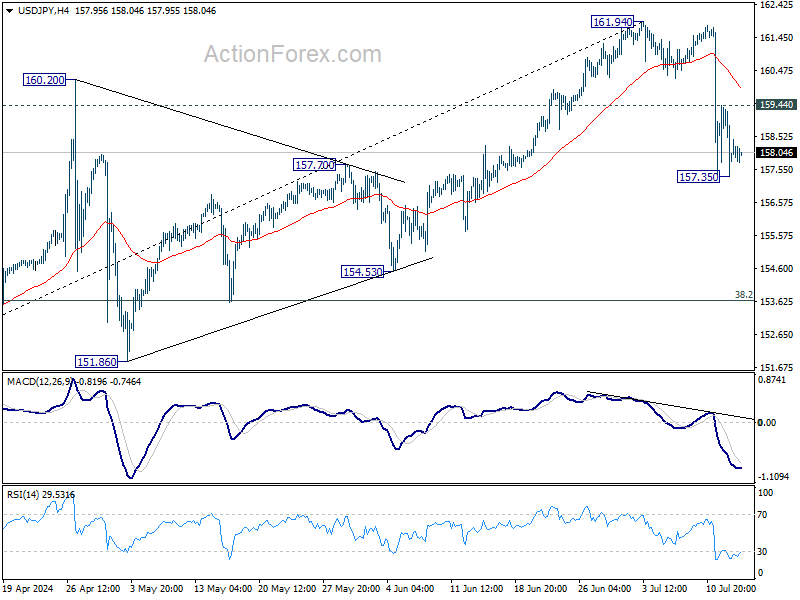
In the bigger picture, as long as 151.89 resistance turned support holds, long term up trend could still continue through 161.94 at a later stage. Next target will depend on the depth of the current correction from 161.94. However, sustained break of 151.89 will argue that larger scale correction or trend reversal is underway.