Sample Category Title
Nikkei Index Has Risen To a Two-Month High
As we reported on 26th June, analysing the Nikkei 225 chart (Japan 225 on FXOpen):
→ The price is in a significant upward trend (shown by the blue channel);
→ The price may continue to rise along the median line.
Since then, the Nikkei 225 index (Japan 225 on FXOpen) has increased by more than 6%, reaching a yearly high on 10th July above 42,500 points. The price particularly surged on 9-10 July, breaking resistance at 41,160 (formed from the previous peak at the end of March).
However, the bears made a strong comeback afterwards, pushing the price back to the 41,160 level. Thus:
→ Completely offsetting the gains from 9-10 July;
→ Forming a bearish engulfing pattern spanning 4 candles;
→ Prompting consideration that the breakout above 41,160 was false (a trap for bulls).
According to Reuters, bearish drivers included technology stocks such as Tokyo Electron, which saw a more than 6% decline in one day, following sell-offs in US technology stocks (as reported on 12th July).
Sentiment in the Japanese stock market is also influenced by risks of interventions by the Bank of Japan to support the yen.
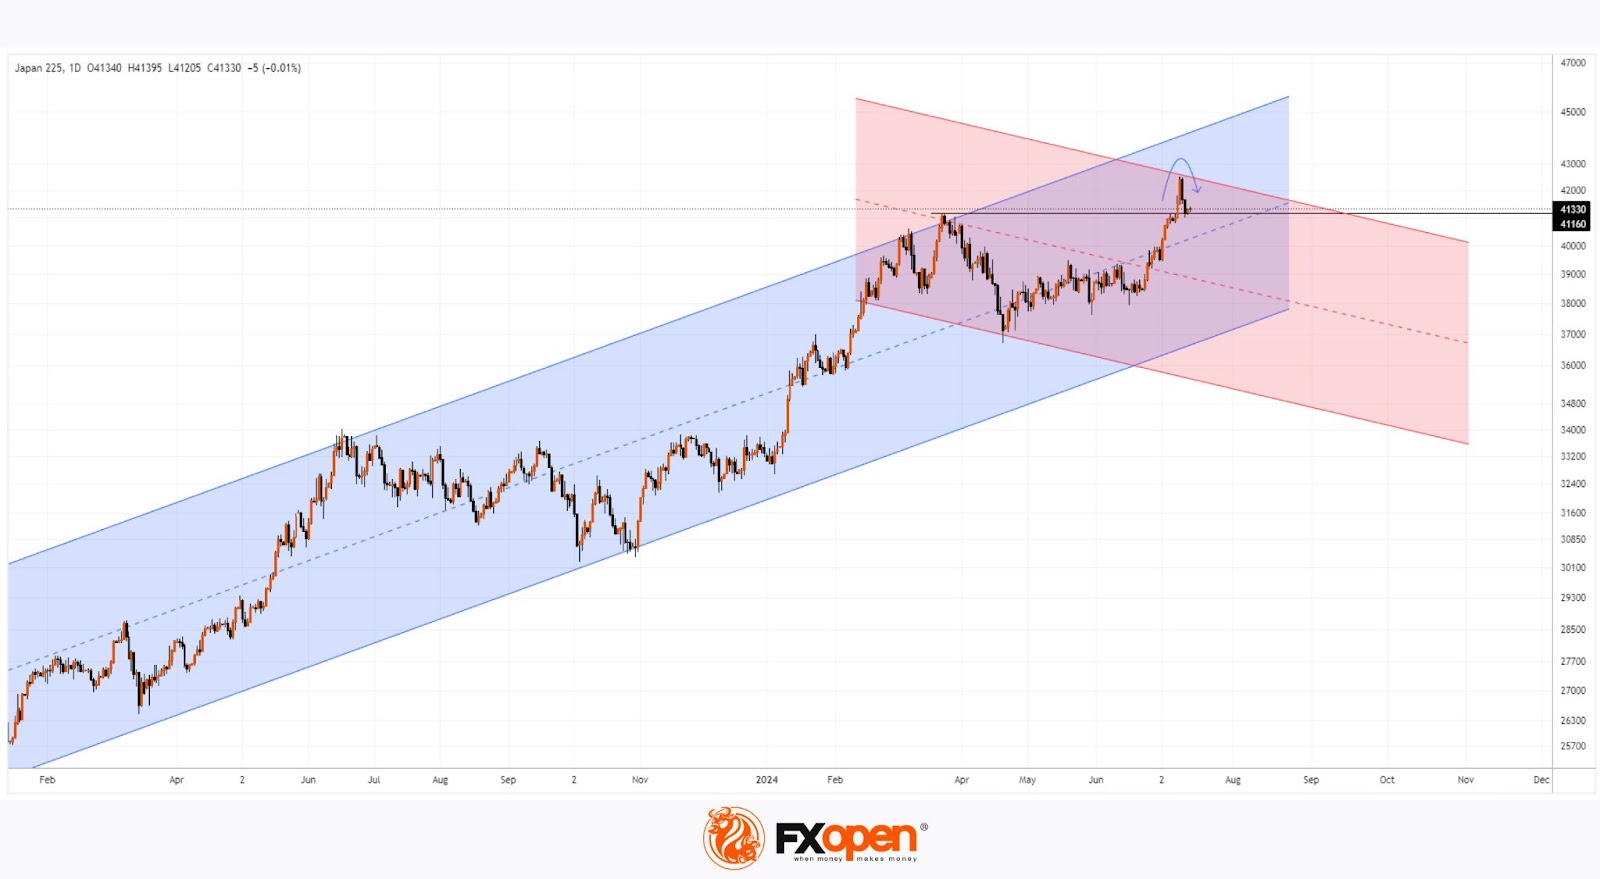
Technical analysis of the Nikkei 225 (Japan 225 on FXOpen) provides further insights:
→ The price is still in the upper half of a significant ascending channel (shown by the blue channel), originating in 2023;
→ There is no conclusive evidence yet that the price is consolidating below the 41,160 level.
However, it's possible that the bears could break below the median of the blue channel and consolidate below 41,160.
In that case, the bearish reversal from last week could become a key point in constructing an important descending channel for the Nikkei 225 index (Japan 225 on FXOpen), whose contours are already emerging (shown in red). Looking ahead to the second half of 2024, this suggests a potential break of the lower boundary of the blue channel.
Trade global index CFDs with zero commission and tight spreads. Open your FXOpen account now or learn more about trading index CFDs with FXOpen.
This article represents the opinion of the Companies operating under the FXOpen brand only. It is not to be construed as an offer, solicitation, or recommendation with respect to products and services provided by the Companies operating under the FXOpen brand, nor is it to be considered financial advice.
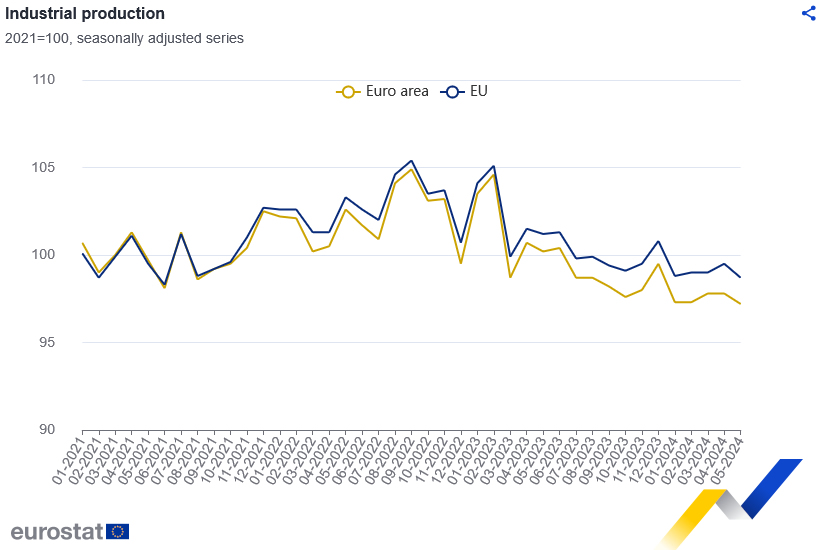
Eurozone industrial productions falls -0.6% mom in May, EU down -0.8% mom
Eurozone industrial production fell -0.6% mom in May, better than expectation of -1.0% mom. Production decreased by -1.0% for intermediate goods, 1.2% for capital goods, and 1.8% for durable consumer goods. Production increased by 0.8% for energy, and 1.6% for non-durable consumer goods.
EU industrial production fell -0.8% mom. The largest monthly decreases were recorded in Slovenia (-7.3%), Romania (-6.2%) and Denmark (-4.9%). The highest increases were observed in Ireland (+6.7%), Luxembourg (+3.9%) and Estonia (+3.8%).
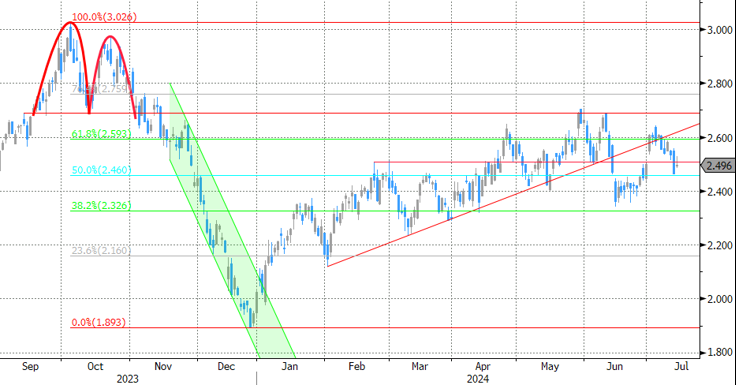
Copper (HG_F) Elliott Wave : Buying the Dips at the Equal Legs Zone
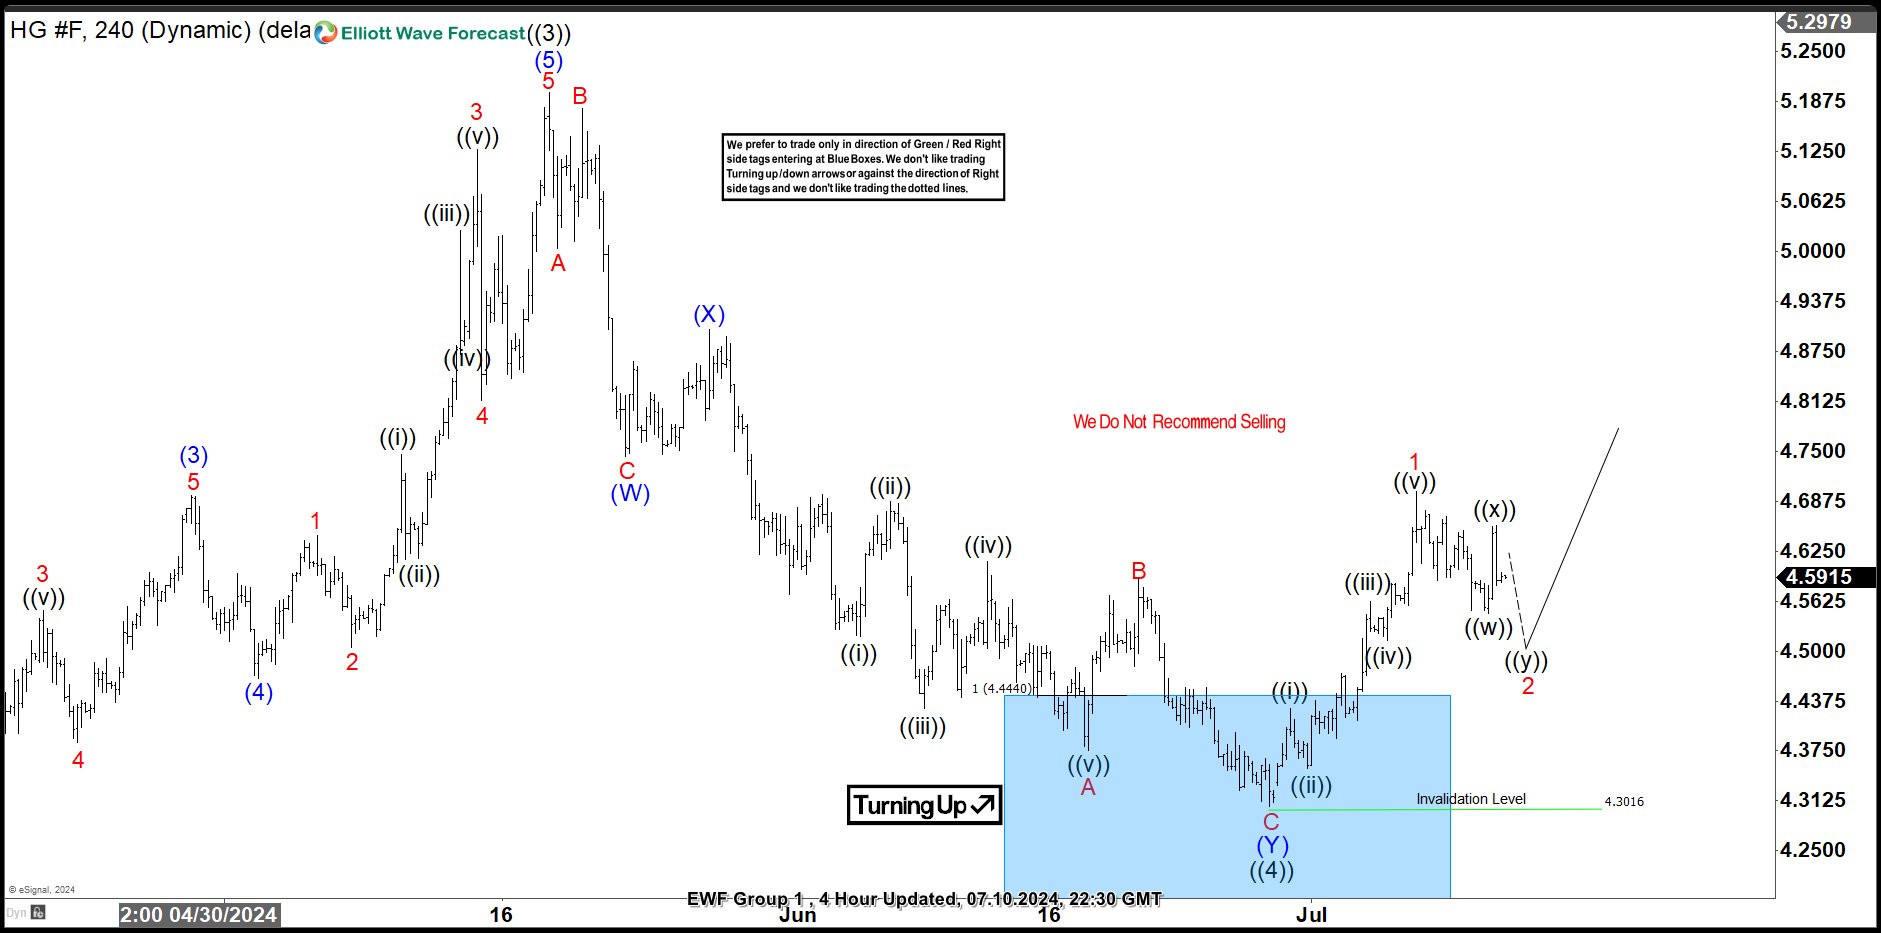
In this technical article we’re going to take a quick look at the Elliott Wave charts of Copper (HG_F) commodity , published in members area of the website. As our members know, Copper has recently given us correction against the October 2023 low. The commodity reached our target zone and completed correction right at the Equal Legs ( Blue Box Area) . In further text we’re going to explain the Elliott Wave pattern and trading setup.
Copper H4 Update 06.10.2024
The commodity is correcting cycle from the 3.5182 low. The pull back has already reached the extreme zone ( Blue Box ). We are aware that correction can be ending any moment. Despite the expected extension lower, we advise against selling Copper at this stage. We expect it to attract buyers at the Blue Box zone. We can see either rally towards new highs or a larger corrective bounce in three waves at least. Once the bounce reaches the 50% Fibonacci retracement level against the connector high – X red, we’ll secure our position by moving the stop-loss to breakeven. To safeguard our trade, we’ll closely monitor for any break below the marked invalidation level :4.1629
A quick reminder:
Our charts are designed for simplicity and ease of trading:
Red bearish stamp + blue box = Selling Setup
Green bullish stamp + blue box = Buying Setup
Charts with Black stamps are deemed non-tradable. 🚫
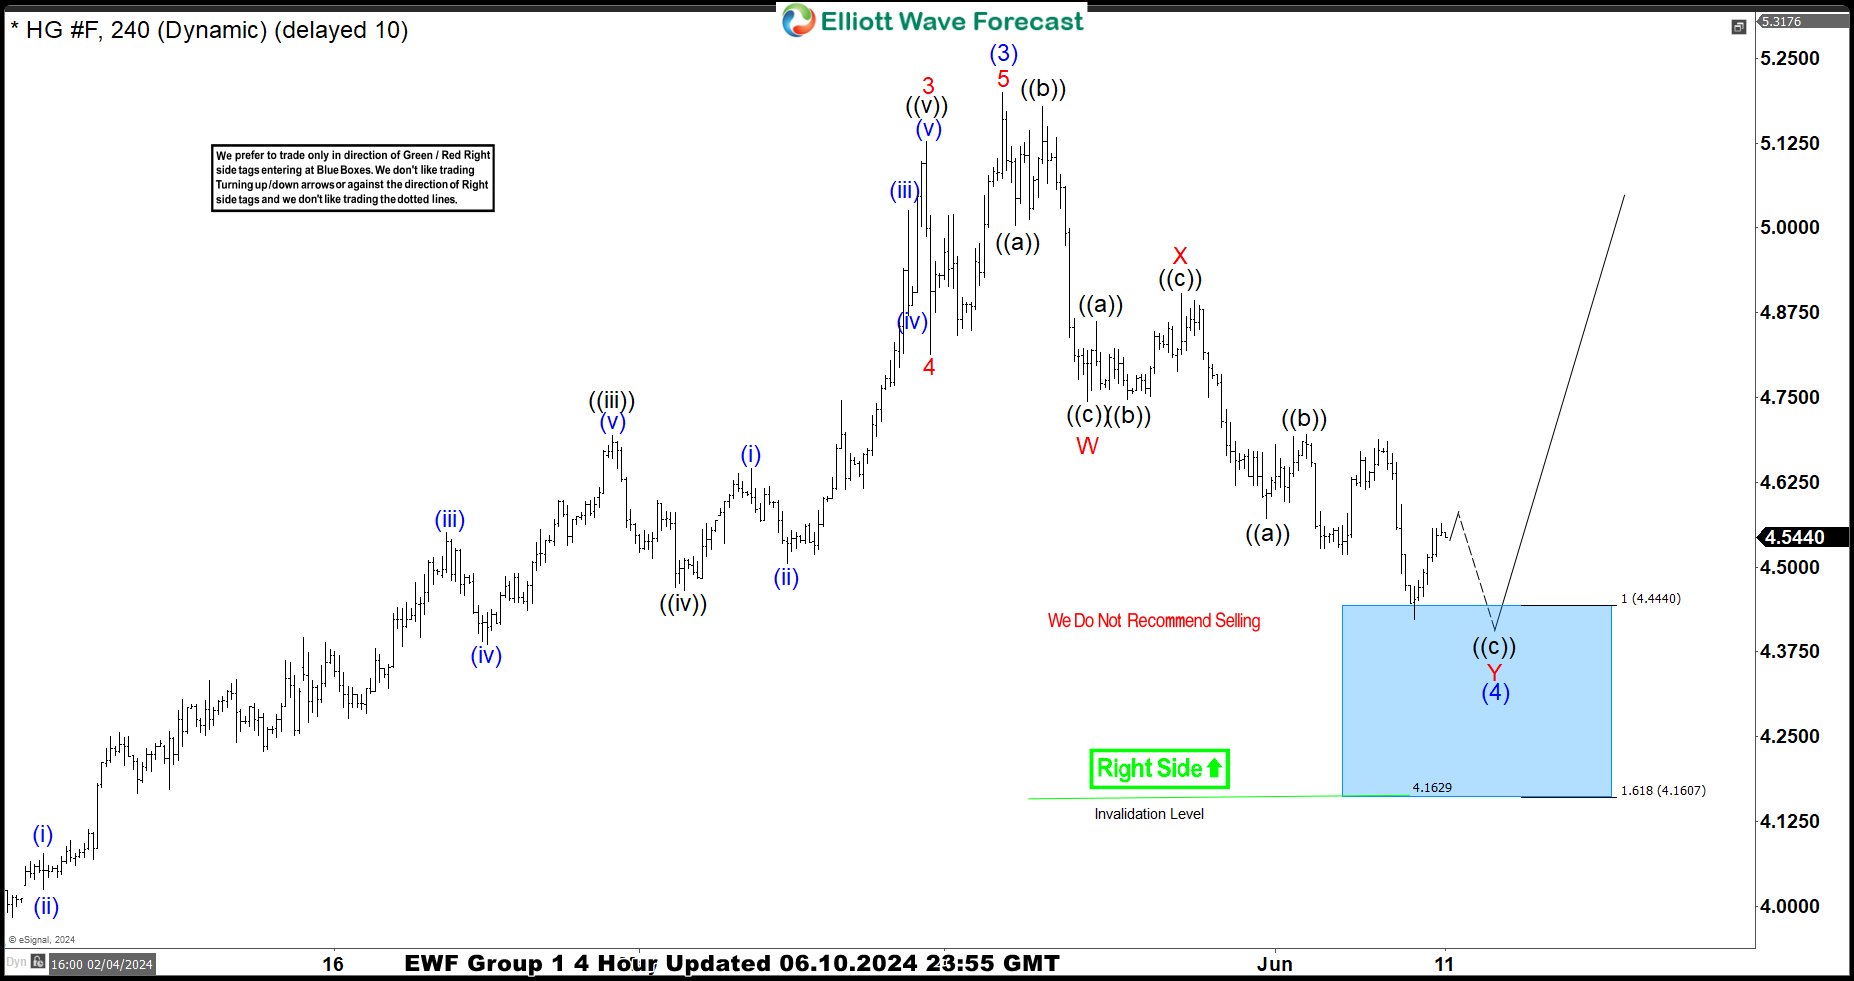
Copper H4 Update 06.10.2024
The commodity made another leg down and found buyers within the Blue Box area as expected. We got a nice rally from our buying zone, counting pull back completed at the 4.3016 low. The bounce has exceeded the 50% Fibonacci retracement level against the connector peak – (X) blue. As a result, traders who entered long positions are now enjoying risk-free profits. With the price holding above the 4.3016 low, we believe the next leg up can be in progress. For confirmation on the next leg up, we’re looking for a break above the May 20th peak.
Bitcoin Once Again Above $60k
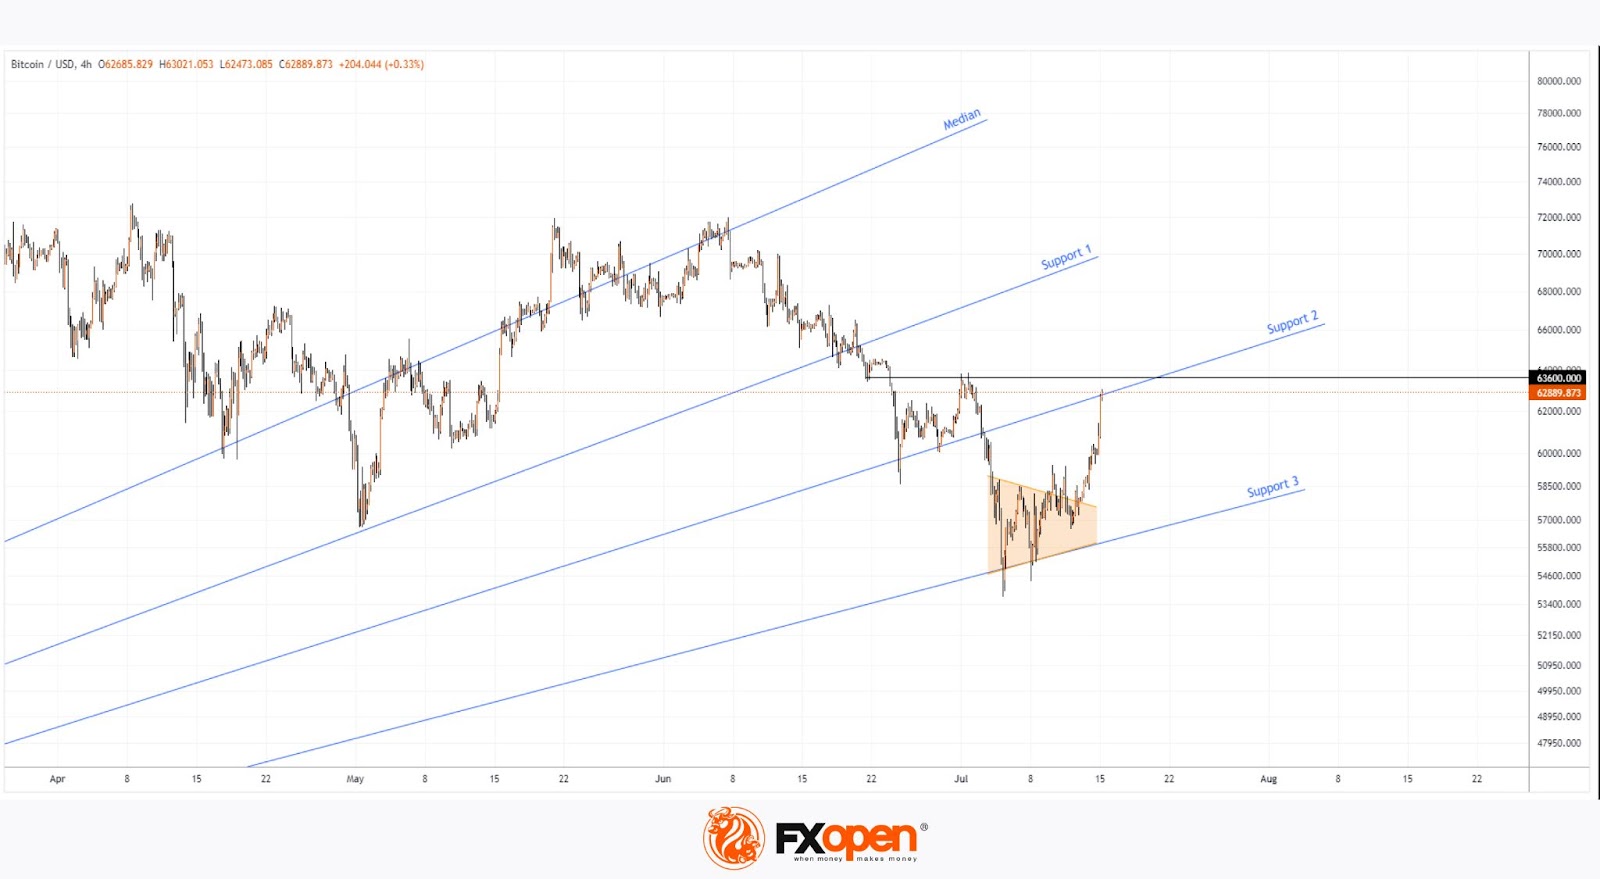
Analysing the long-term BTC/USD chart from 16th May, we constructed a "roadmap" for Bitcoin's price, resembling an expanding fan consisting of a median and support levels below it, and resistance levels above it.
Reviewing the BTC/USD chart last time (9 thJuly), we noted:
→ Support provided by Support Line 3, reinforced by the psychological level of $55,000;
→ Potential upward movement following consolidation within a narrowing triangle.
How has the market situation changed since last week?
According to today's BTC/USD chart:
→ Bitcoin price has broken upwards from the consolidation triangle (shown in orange);
→ Over the last 3 days, the price has increased by almost 8%;
→ BTC/USD exchange rate is again above the psychological mark of $60k.
Among the bullish drivers identified:
→ The weakening US Dollar amid slowing inflation and high expectations of a Fed rate cut as early as September;
→ Inflows of investments related to Bitcoin ETFs reaching $300 million per day (as mentioned in our previous post);
→ Price growth observed following news on 13th July about an attempt on Trump during a rally in Pennsylvania. It's possible Bitcoin is seen as a safe haven amidst political turbulence.
By the way, while a Republican candidate previously criticised Bitcoin as "fraud," on 14th June, Trump stated he would end the "war on cryptocurrencies" if elected president, a stance confirmed by organisers of the Bitcoin conference in Nashville (scheduled for 25-27 July) who announced Trump's agreement to speak there.
How will events unfold further?
Technical analysis of the BTC/USD chart shows:
→ The price is near Support 2. Despite its name (given back in May), this line, after a bearish breakthrough in early July, may now serve as resistance;
→ Additional resistance at the level of 63,600 could also serve as a test of bullish confidence.
Thus, encountering these two resistances after a 8% rise over 3 days, a correction phase in Bitcoin's price chart development may seem like a plausible scenario.
FXOpen offers the world's most popular cryptocurrency CFDs*, including Bitcoin and Ethereum. Floating spreads, 1:2 leverage — at your service. Open your trading account now or learn more about crypto CFD trading with FXOpen.
*At FXOpen UK and FXOpen AU, Cryptocurrency CFDs are only available for trading by those clients categorised as Professional clients under FCA Rules and Professional clients under ASIC Rules respectively. They are not available for trading by Retail clients.
This article represents the opinion of the Companies operating under the FXOpen brand only. It is not to be construed as an offer, solicitation, or recommendation with respect to products and services provided by the Companies operating under the FXOpen brand, nor is it to be considered financial advice.
Japanese Yen Surges Amidst Potential Interventions
The Japanese yen showed significant strength against the US dollar late last week, with the USD/JPY pair currently stabilizing around 157.86. This marks the lowest level for the currency pair in nearly a month.
The yen's recent surge is attributed to widespread market speculation regarding potential interventions by Japanese authorities. Analysts believe that Japan may have conducted two separate interventions to bolster the yen, although these could also involve large-scale position closings on exchanges, known as "stop triggers."
Reports indicate that the Bank of Japan may have expended between 3.37 and 3.57 trillion yen ($21.18 to $22.00 billion) last Thursday alone, with Friday's expenditures yet to be confirmed. This marks a short interval since the last currency intervention by the BOJ.
Additionally, the BOJ's recent inquiries into bank exchange rates could have preemptively influenced market movements, sometimes seen as a precursor to formal interventions.
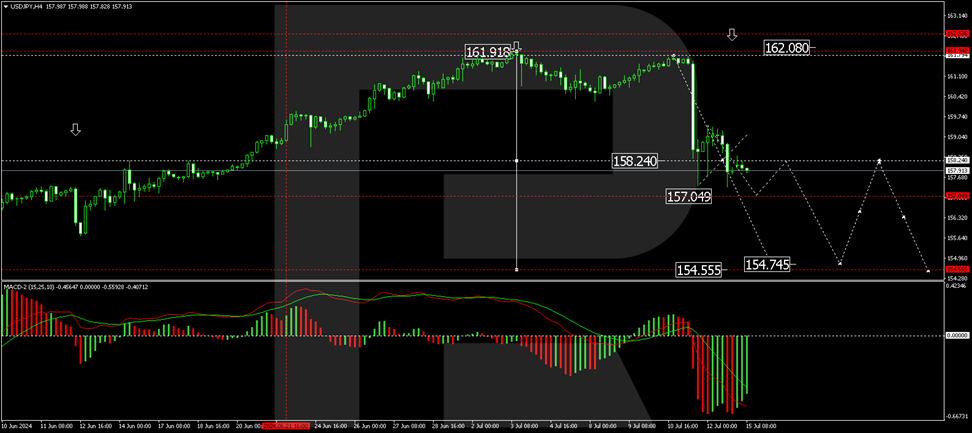
USD/JPY technical analysis
The USD/JPY pair is currently navigating a consolidation phase around the 158.24 level. We anticipate a potential decline to 157.05, followed by a rebound to 158.76. A subsequent drop to 154.74 is expected, which could prompt a corrective movement back to 158.24. The MACD indicator supports this bearish outlook, with its signal line positioned below zero and indicating a downward trajectory.
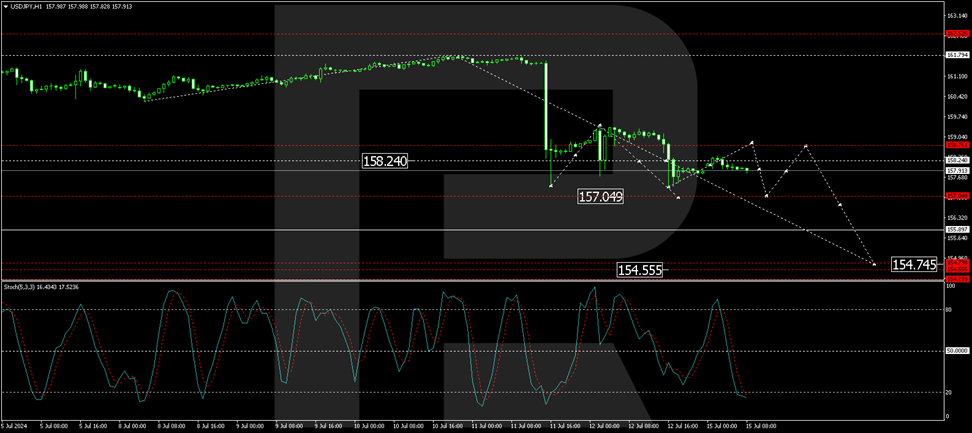
On the H1 chart, the USD/JPY is forming a downward wave towards 157.04. Upon reaching this level, a rise to at least 158.24 may occur, followed by another decline to 154.74. This bearish pattern is corroborated by the Stochastic oscillator, with the signal line preparing to ascend from below 20 to around 50, suggesting potential brief recoveries amid overall downward momentum.
Market participants will closely monitor upcoming releases and statements from the Japanese government and the BOJ for confirmation of these interventions and further insights into future monetary policy actions.
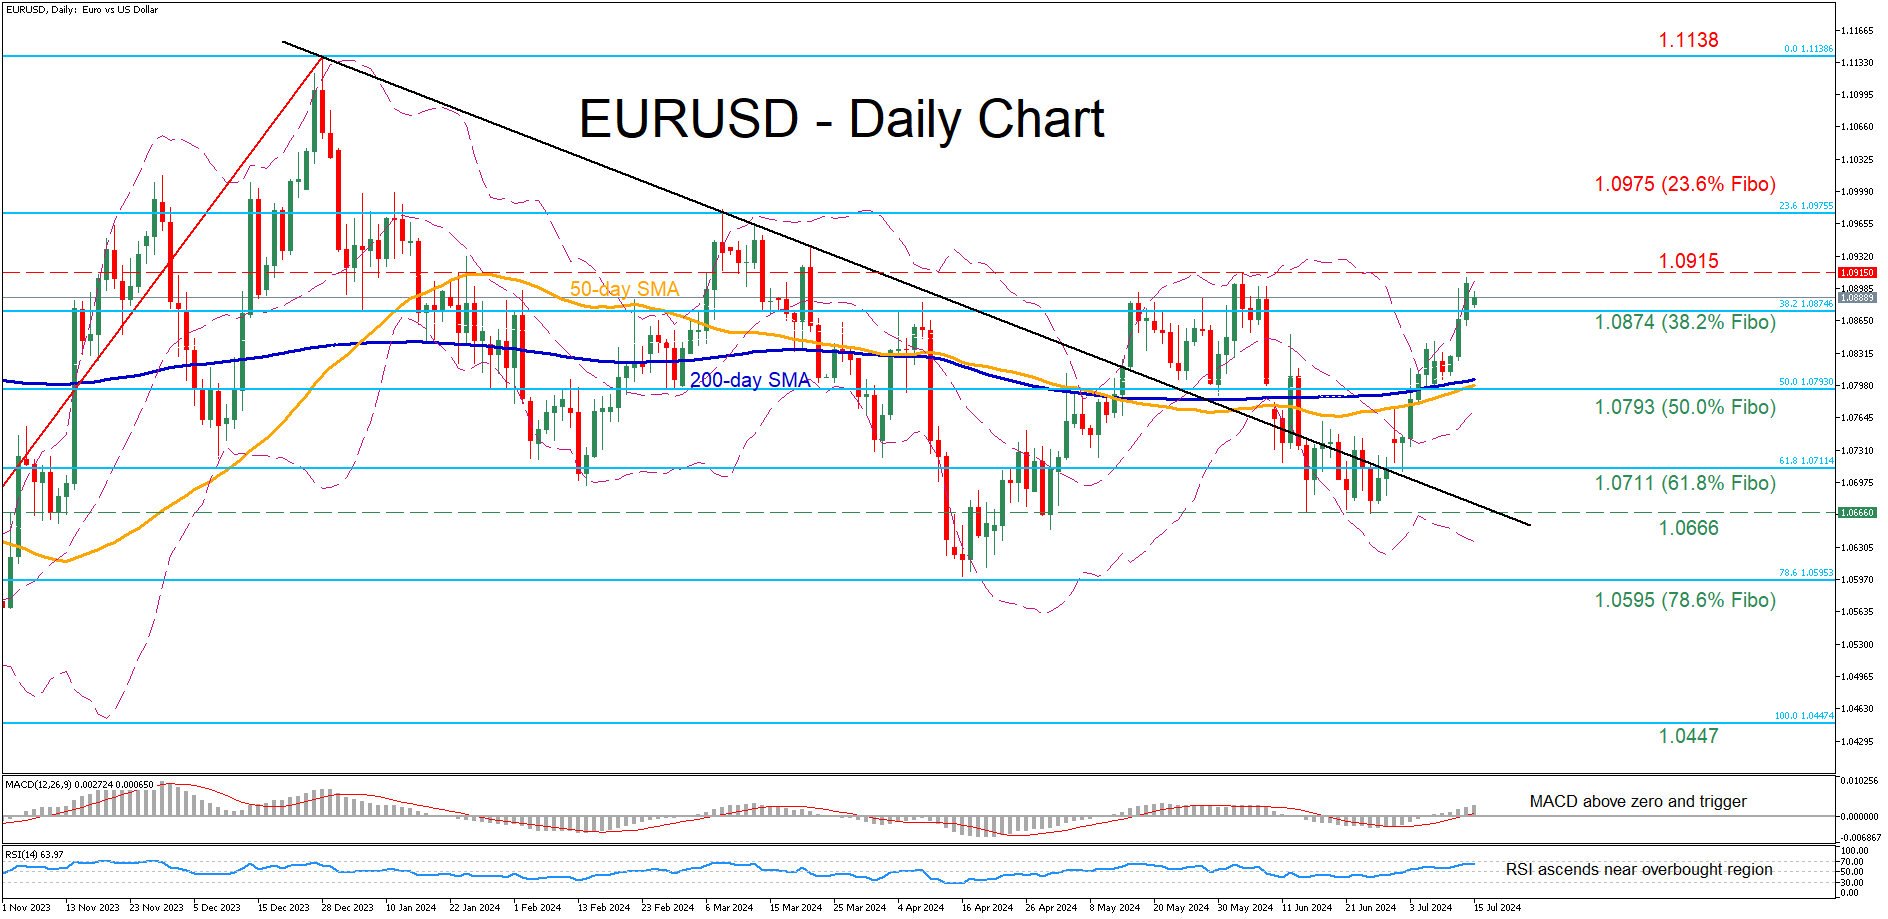
EURUSD Jumps to a Fresh 1-month High
- EURUSD edges higher after break above SMAs
- The pair advances to its highest level since June 4
- Oscillators suggest that bullish forces are strengthening
EURUSD has been in a steady uptrend after the bullish breakout from its downward sloping trendline in place since December 2023. Moreover, the pair conquered both its 50- and 200-day simple moving averages (SMAs), surging to a fresh one-month peak on Friday.
Should the latest upleg strengthen, the price could initially challenge the June peak of 1.0915. Claiming that barricade, the bulls could attack 1.0975, which is the 23.6% Fibonacci retracement of the 1.0447-1.1138 upleg. Failing to halt there, the pair might revisit its December 2023 high of 1.1138.
On the flipside, if the price experiences a pullback, initial support could be met at the 38.2% Fibo of 1.0874. Lower, the 50.0% Fibo of 1.0793 could act as the next line of defense ahead of the 61.8% Fibo of 1.0711. Sliding beneath that floor, the pair may then decline towards the one-month bottom of 1.0666.
In brief, EURUSD has regained some lost ground in the past few sessions, while the jump above its SMAs has further improved its short-term technical picture. Nevertheless, a decisive break above its June high of 1.0915 is needed for the bulls to regain confidence for a full-scale reversal.
Dollar Losing Interest Rate Support at Stealth Pace
Markets
The US dollar is losing interest rate support at stealth pace. Since the awful June service ISM (July 3), the US 2-yr yield fell from 4.75% to 4.45% currently. The US 10-yr yield slid from 4.45% to 4.2%, testing the downside of the downward trend channel. Decent payrolls failed to save the day while softer CPI and PPI inflation (back-to-back, May/June) added to market belief that the Fed mistimed their updated policy rate guidance. At the June meeting, the median indication for this year shifted from a cumulative 75 bps rate cuts in March, to just 25 bps. US money markets now fully discount a 25 bps rate cut at the September and December meetings and even ponder the possibility of a faster pace towards year-end. Chicago Fed Goolsbee embraced the “pretty favorable” recent inflation data, but still wants to see more data like those to boost confidence that inflation is sustainably returning to the 2% inflation target. We keep a close eye on Fed speakers this week, starting with Fed Chair Powell tonight in an interview at the Economic Club of Washington DC (after European close). Any soft/dovish signals could extend the market repositioning and add to dollar weakness. EUR/USD rallied over the same time period (since ISM), from 1.0750 to 1.09. Apart from a soft USD, the euro got rid of the (French) political risk premium. The pair tests the topside of the 1.06-1.09 sideways trading range last Friday with the probability of break being high. The Trump shooting for now doesn’t really inspire much flows into USD (boost to his ballot odds). EUR/USD 1.10 (psycho) and 1.1139 (December 2023 top) are the next technical references. GBP/USD already moved passed that bar. Cable is inches away from a first 1.30 quote in just under a year after breaking the 1.2894 YTD top last week. EUR/GBP is in the same vein testing the 2-yr low at 0.84 in the run-up to the monthly UK data update. The US side of the equation helps Japanese intervention efforts to keep pressure off USD/JPY (158 currently). Apart from the Powell speech, today’s agenda contains the Empire Manufacturing Survey and some Q2 earnings. We earmark US retail sales and the ECB’s bank lending survey (tomorrow), UK inflation and a high-level Fed Waller speech (Wednesday), UK labour market data and the ECB meeting (Thursday) and UK retail sales (Friday) as this week’s other key events.
News & Views
The Chinese economy grew at a much slower pace than expected in the April-June quarter. Q2 growth slowed to 0.7% Q/Q and 4.7% Y/Y from 1.6% Q/Q and 5.3% Y/Y in Q1. Cumulative YTD GDP growth slackened from 5.3% to 5%. Monthly data for the month of June indicated that the poor performance was mainly the result of poor domestic consumer demand. Retail sales growth in June slowed sharply from 3.7% Y/Y to 2%. Developments in the property sector continue to weigh both on activity and on sentiment. Property investment declined 10.1% YTD Y/Y in June. Residential property sales even declined 26.9% YTD Y/Y. House prices continue to decline. New Home prices in June fell 0.67% M/M and -4.88% Y/Y (from -4.3%). Price of existing homes were 0.85% lower M/M and 7.87% Y/Y. Industrial production held up better compared to the slowdown in domestic demand rising a better-than expected 5.3% Y/Y in June (6.0% YTD). According to the National Bureau of Statistics bad weather played a role in the disappointing Q2 growth performance, but the bureau also mentioned external and domestic difficulties to weigh on activity. The poor growth performance suggests that additional fiscal and monetary stimulus might be put in place as the Communist Party starts its Third Plenum meeting today. For now, the PBOC left the rate on its 1-yr medium term lending facility unchanged at 2.5%. The Chinese yuan declined modestly to USD/CNY 7.26.
According to a survey of the Rightmove property website, UK house prices declined by 0.4% M/M in July. Compared to the same month last year, price growth slowed from 0.6% Y/Y to 0.4% Y/Y. Despite the slowdown, Rightmove sounded cautiously optimistic on the price development going forward. "A first Base Rate cut for over four years, together with the new political certainty, could set the scene for a positive autumn market, with improved affordability and a more confident outlook in the second half of the year," Rightmove director of property science Tim Bannister, said
Graphs
GE 10y yield
The ECB cut its key policy rates by 25 bps at the June policy meeting. A more bumpy inflation path in H2 2024, the EMU economy gradually regaining traction and the Fed’s higher for longer US strategy make follow-up moves difficult. Markets are coming to terms with that. Meanwhile, much of the save haven bids were reversed after the (first round in) the French elections. The 2.34%-2.4% support zone looks solid.
US 10y yield
The Fed indicated that it needs more evidence to lower its policy rate. June dots suggested one move in 2024 and four next year. Disappointing ISM and back-to-back downward CPI surprises put the US money market back on (at least) two rate cuts this year (September/December). The US 10-yr yield tests the recent lows and the downside of the downward trend channel in the 4.2% area.
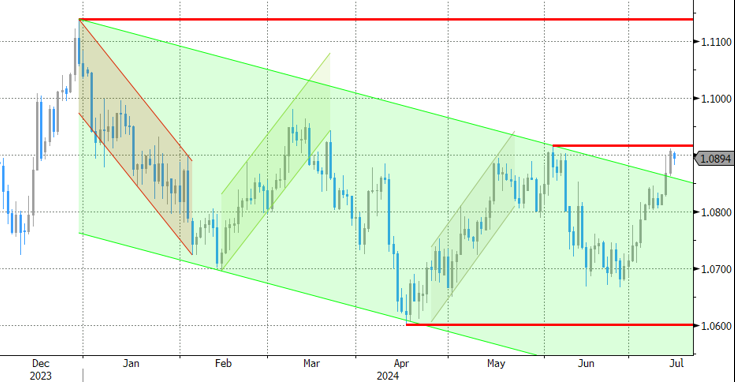
EUR/USD
EUR/USD is testing the topside of the 1.06-1.09 range as the dollar loses interest rate support at stealth pace. Markets consider a September rate cut a done deal and only need confirmation from high-ranked Fed officials. In the meantime, the euro got rid of the (French) political risk premium. Risks of a topside break are high, bringing the psychologic 1.10 and the December 2023 top at 1.1139 on the radar.
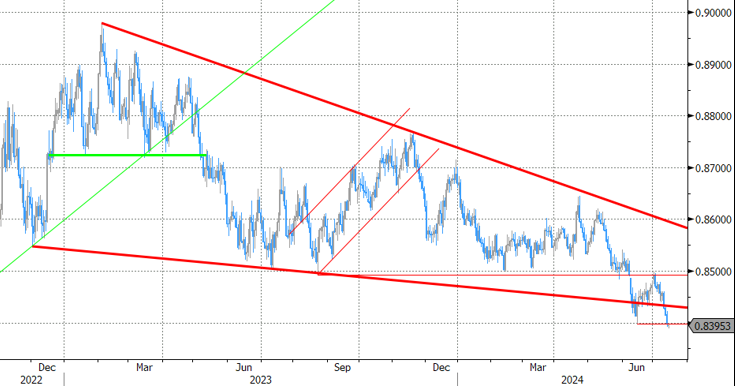
EUR/GBP
Debate at the BOE is focused at the timing of rate cuts. May headline inflation returned to 2%, but core measures weren’t in line with inflation sustainably returning to target any time soon. Still some BoE members at the June meeting appeared moving closer to a rate cut. Labour has yet to reveal its policy plans after securing a landslide election victory. EUR/GBP 0.84 is support is being tested.
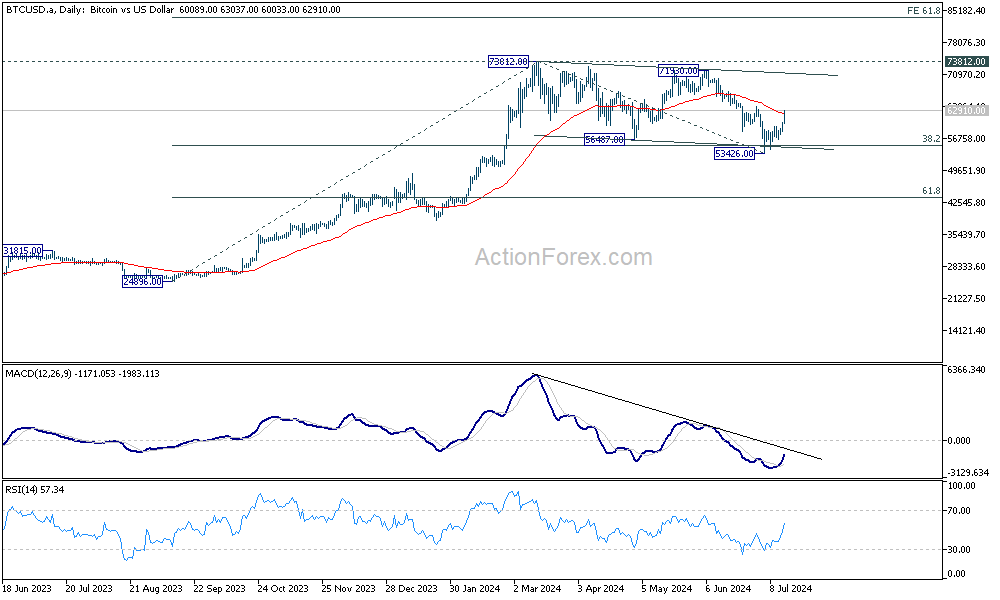
Bitcoin ready for new record high, Ethereum following
Bitcoin jumps sharply higher today as rebound from 53426 extended. The break of 55 D EMA (now at 62400) is taken as a sign that corrective pattern from 73812 has completed with three waves down to 53426. That came after hitting 38.2% retracement of 24896 to 73812 at 55126.
Sustained trading above 55 D EMA will strengthen this bullish case. Bitcoin should then target 73812 record high, and then 61.8% projection of 24896 to 73812 from 53426 at 83656.
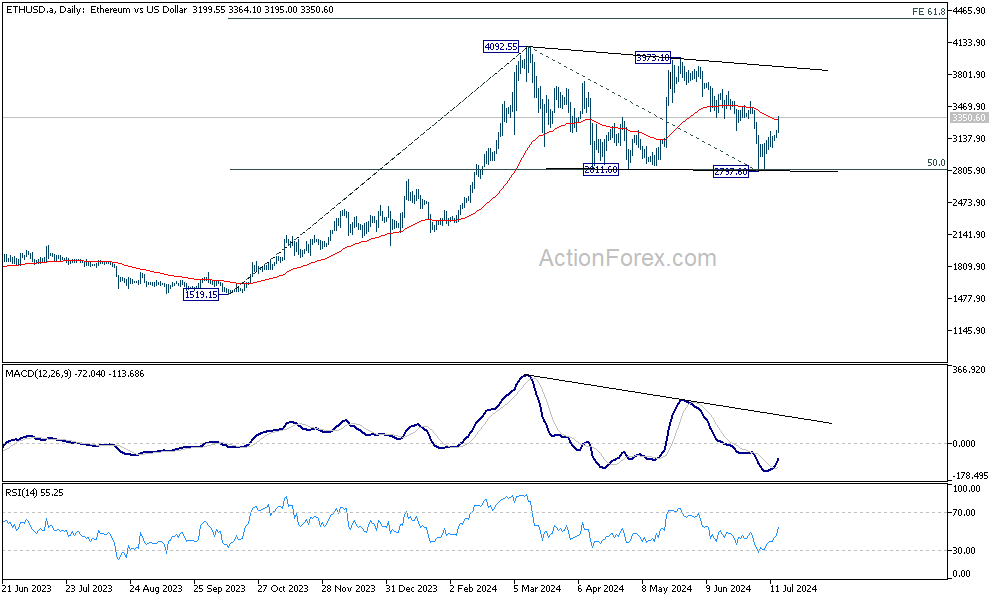
Similarly, Ethereum's corrective pattern from 4092.55 could have finished with three waves to 2797.60, after hitting 50% retracement of 1519.15 to 4092.55 at 2805.85. Sustained trading above 55 D EMA (now at 3333.45) would solidify this bullish case. Ethereum should then target 4092.55 high and then 61.8% projection of 1519.15 to 4092.55 from 2797.60 at 4387.96.
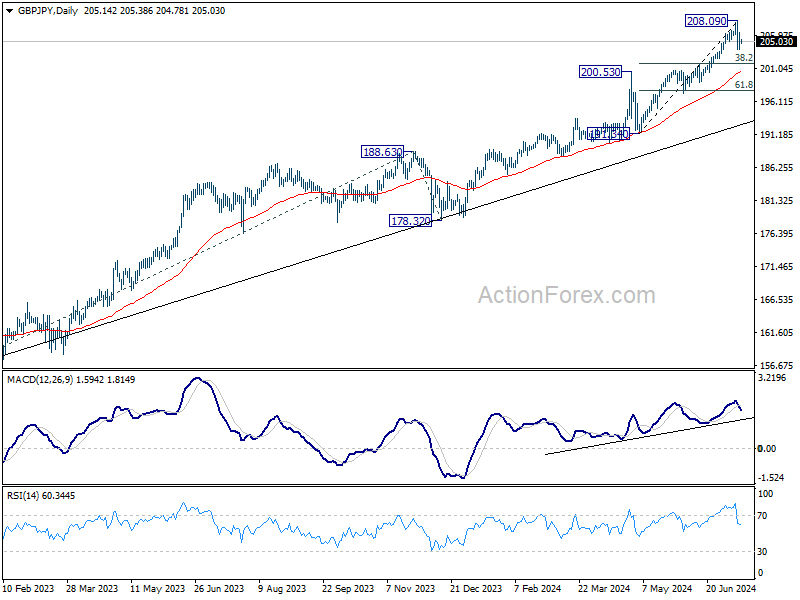
GBP/JPY Daily Outlook
Daily Pivots: (S1) 203.83; (P) 205.09; (R1) 206.33; More...
GBP/JPY's correction from 208.09 short term top could extend lower. Below 203.82 will target 38.2% retracement of 191.34 to 208.09 at 201.69. Strong support is expected there to bring rebound, to set the range of consolidations below 208.09. However, sustained break of 201.69 will argue that larger correction is already underway.
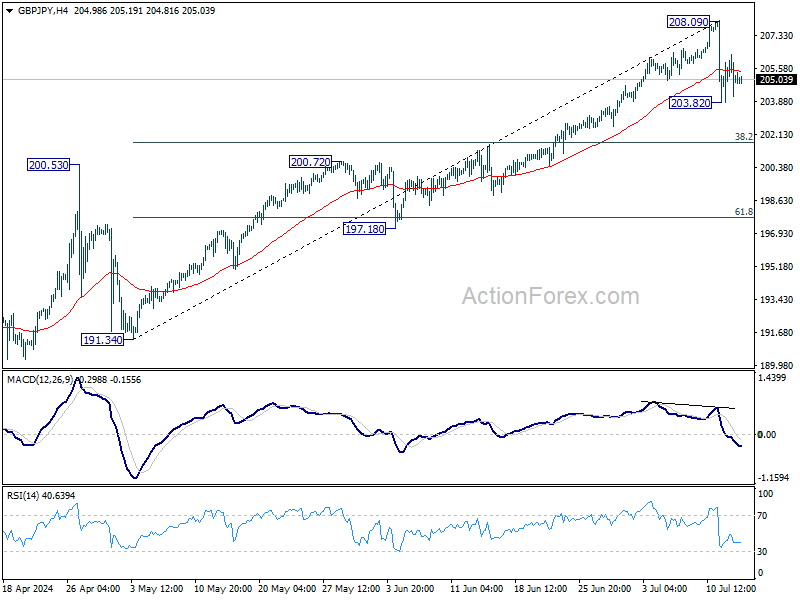
In the bigger picture, long term up trend is still in progress. Next target is 100% projection of 155.33 to 188.63 from 178.32 at 211.62. Outlook will stay bullish as long as 200.72 resistance turned support holds, even in case of deep pullback.
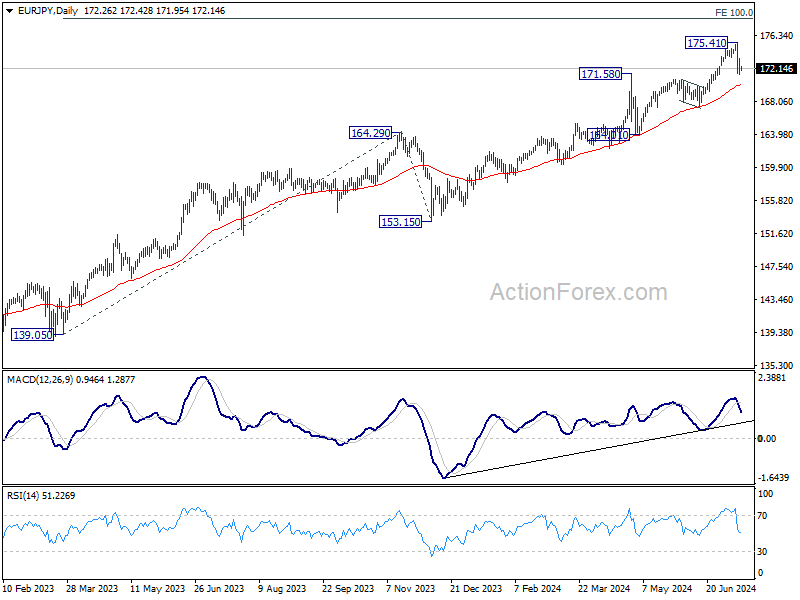
EUR/JPY Daily Outlook
Daily Pivots: (S1) 171.26; (P) 172.35; (R1) 173.23; More...
EUR/JPY's pull back from 175.41 short term top could extend lower. But downside should be contained by 170.87 and bring rebound, to set the range for consolidations. However, firm break of 170.87 will argue that larger correction is already underway and target 167.52 and possibly below.
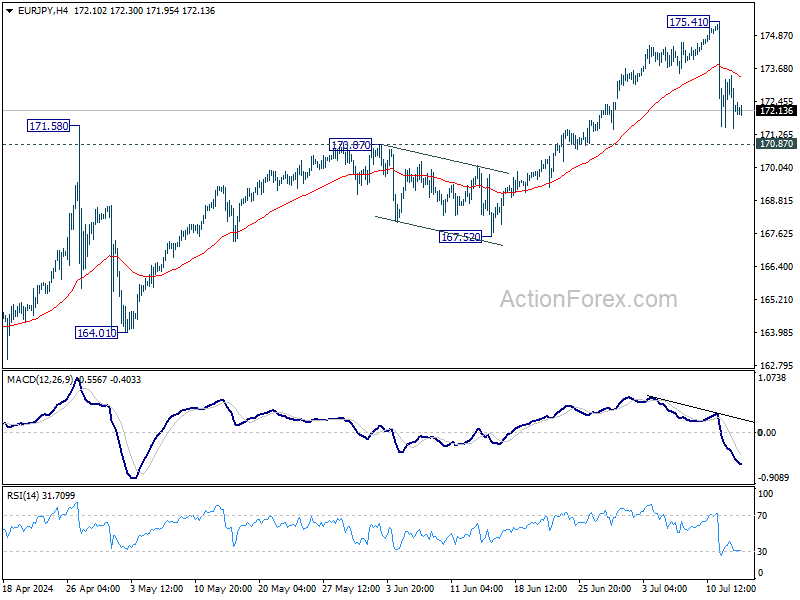
In the bigger picture, as long as 170.87 resistance turned support holds, the long term up trend is still expected to continue. Next target is 100% projection of 139.05 to 164.29 from 153.15 at 178.38. However, firm break of 170.87 will bring deeper fall to 167.52 support. Decisive break there will confirm that larger correction in in progress for 153.15/164.29 support zone.