

Sample Category Title
USD/CHF Mid-Day Outlook
Daily Pivots: (S1) 0.8927; (P) 0.8949; (R1) 0.8966; More…
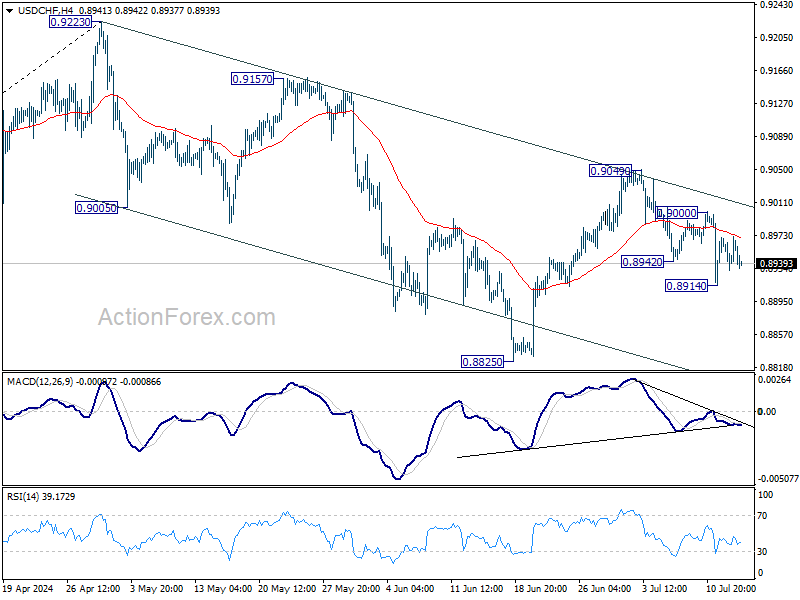
Intraday bias in USD/CHF is neutral for the moment, but further fall is expected with 0.9000 resistance intact. Below 0.8914 will target 0.8825 low. Break of 0.8825 will target 50% retracement of 0.8332 to 0.9223 at 0.8778 next. However, break of 0.9000 will turn bias back to the upside for 0.9049 resistance instead.
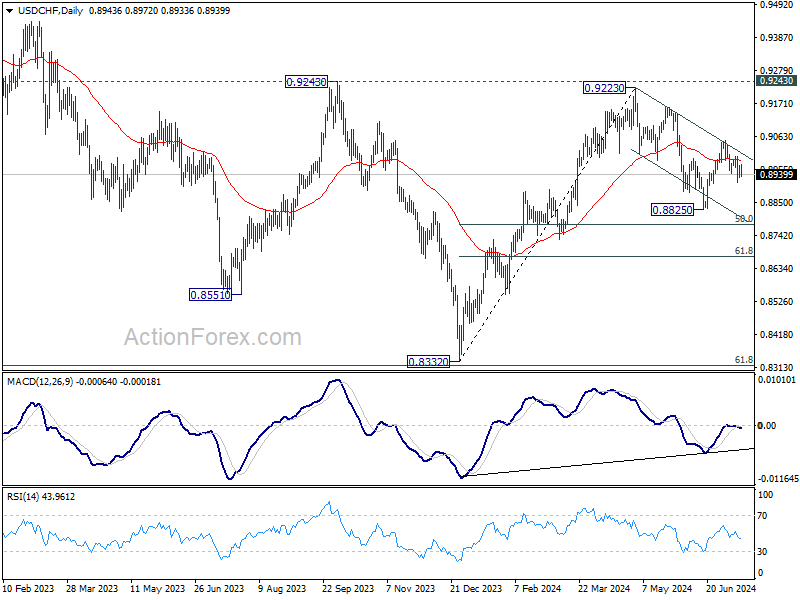
In the bigger picture, with 0.9243 resistance intact, medium term outlook in USD/CHF is neutral at best. For now, more sideway trading is likely between 0.8332/9243. However, firm break of 0.9243 will indicate larger bullish trend reversal.
GBP/USD Mid-Day Outlook
Daily Pivots: (S1) 1.2930; (P) 1.2960; (R1) 1.3019; More...
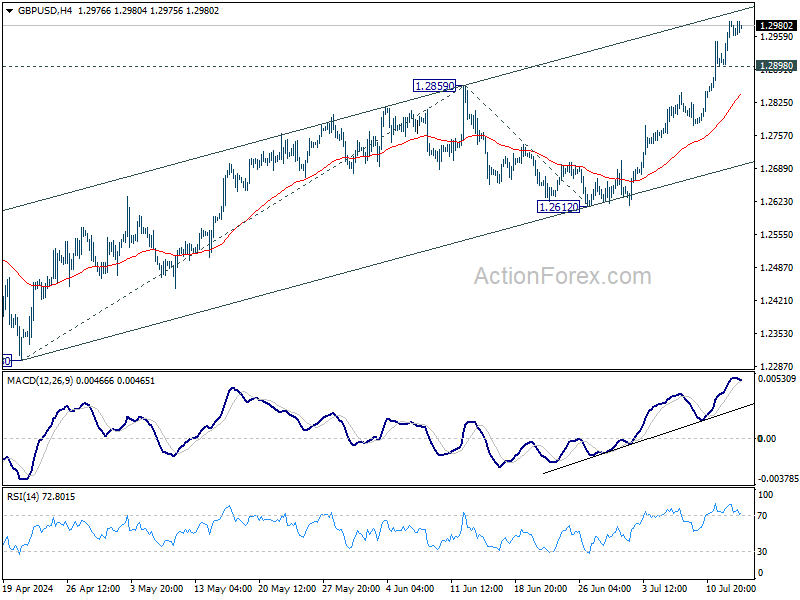
No change in GBP/USD's outlook and intraday bias remains on the upside. Rise from 1.2298 is in progress for 100% projection of 1.2298 to 1.2859 from 1.2612 at 1.3173, which is slightly above 1.3141 key medium term resistance. On the downside, below 1.2898 minor support will turn bias neutral and bring consolidations first, before staging another rally.
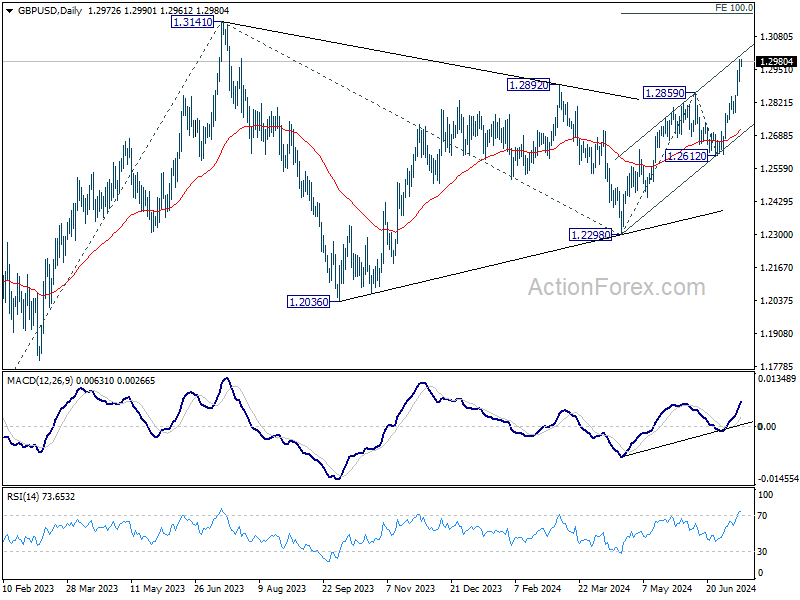
In the bigger picture, corrective pattern from 1.3141 medium term top (2023 high) could have completed with three waves to 1.2298 already. This will now remain the favored case as long as 1.2612 support holds. Firm break of 1.3141 will target 61.8% projection of 1.0351 (2022 low) to 1.3141 from 1.2298 at 1.4022.
EUR/USD Mid-Day Outlook
Daily Pivots: (S1) 1.0876; (P) 1.0893; (R1) 1.0925; More....
No change in EUR/USD's outlook and intraday bias remains on the upside for the moment. Decisive break of 1.0915 resistance will resume whole rise from 1.0601 to 100% projection of 1.0601 to 1.0915 from 1.0665 at 1.0979. On the downside, below 1.0859 minor support will turn intraday bias neutral first.
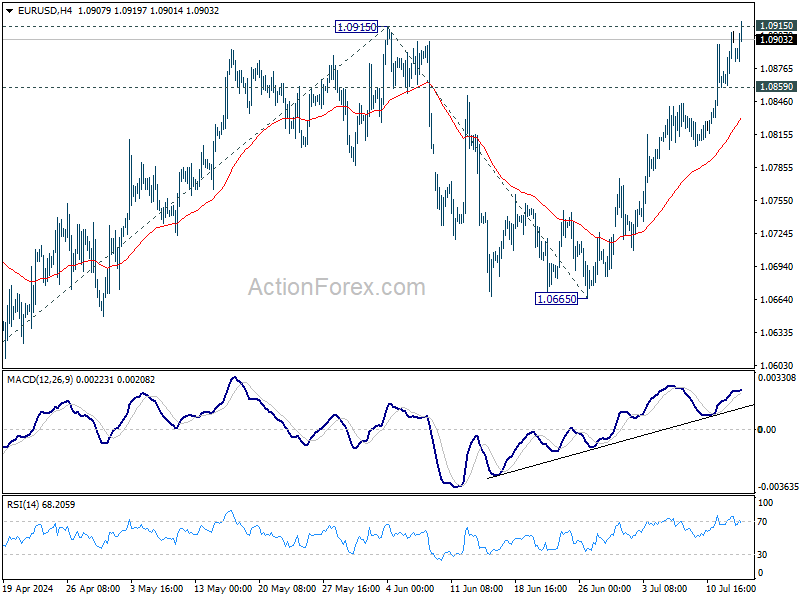
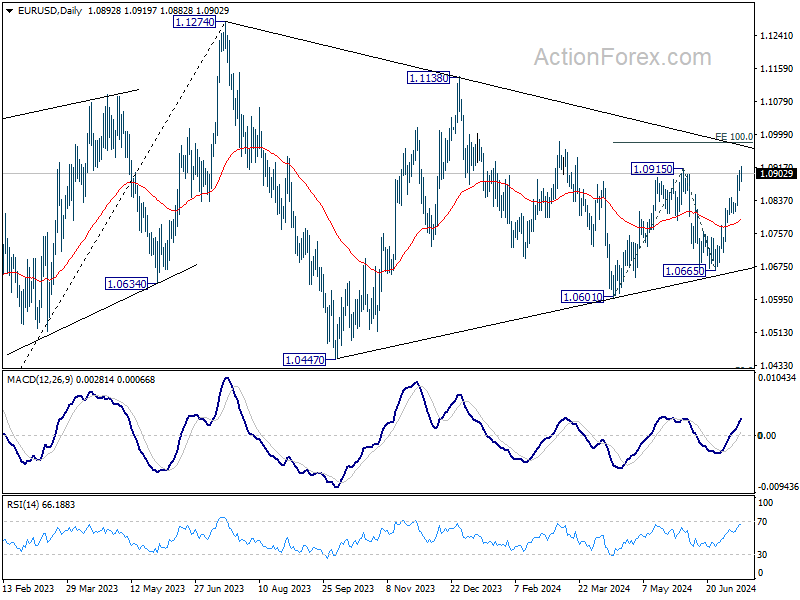
In the bigger picture, price actions from 1.1274 are viewed as a corrective pattern, possibly a triangle, that's still be in progress. Break of 1.1138 resistance will be the first signal that rise from 0.9534 (2022 low) is ready to resume through 1.1274 (2023 high). This will now remain the favored case as long as 1.0601 support holds.
Calm Markets Await Powell’s Insights on Disinflation and Rate Cuts
Global financial markets lack clear direction today. Major European stock indexes are trading slightly lower, while US futures indicate a modestly higher open. Investors are unfazed by the assassination attempt on former US President Donald Trump, maintaining a calm stance. Focuses are turning to Fed Chair Jerome Powell's upcoming speech, where the market hopes to gauge his views on the faster-than-expected disinflation trend in the US. Key questions include whether a September rate cut by Fed is now realistic and if a second rate cut this year is back on the radar.
In the currency markets, Dollar is currently the strongest performer, followed by Euro and the Swiss Franc. New Zealand dollar is the weakest, further weighed down by poor New Zealand services data. Sterling is the second weakest, followed by Australian Dollar, while Yen and Canadian dollar are positioned in the middle.
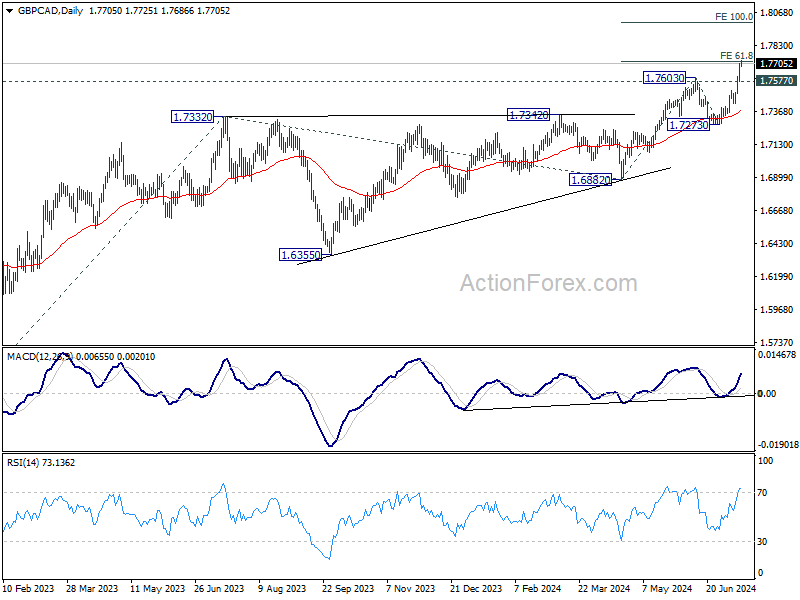
Technically, GBP/CAD's up trend resumed last week by powering through 1.7603 resistance, but it's currently struggling at 61.8% projection of 1.6882 to 1.7603 from 1.7273 at 1.7719. Still, further rally is expected as long as 1.7577 support holds. Firm break of 1.7719 would prompt upside acceleration to 100% projection at 1.7994 next. This week's CPI data from Canada and the UK have the potential to trigger the next move.
In the Europe, at the time of writing, FTSE is down -0.41%. DAX is down -0.46%. CAC is down -0.73%. UK 10-year yield is up 0.017 at 4.129. Germany 10-year yield is up 0.003 at 2.503. Earlier in Asia, Japan was on holiday; Hong Kong HSI fell -1.52%. China Shanghai SSE rose 0.09%. Singapore Strait Times rose 0.06%.
Eurozone industrial productions falls -0.6% mom in May, EU down -0.8% mom
Eurozone industrial production fell -0.6% mom in May, better than expectation of -1.0% mom. Production decreased by -1.0% for intermediate goods, 1.2% for capital goods, and 1.8% for durable consumer goods. Production increased by 0.8% for energy, and 1.6% for non-durable consumer goods.
EU industrial production fell -0.8% mom. The largest monthly decreases were recorded in Slovenia (-7.3%), Romania (-6.2%) and Denmark (-4.9%). The highest increases were observed in Ireland (+6.7%), Luxembourg (+3.9%) and Estonia (+3.8%).
BoE's Dhingra advocates for rate normalization now
In a podcast today, BoE MPC member Swati Dhingra emphasized that "now is the time" to start normalizing interest rates and to "stop squeezing living standards" as the central bank has been doing to curb inflation.
Dhingra pointed out that demand in the UK is too weak for inflation to surge again, noting that inflation returned to 2% in May. She stated, "I don't see some kind of consumption boom and if we're going to start moderating from the very high level of interest rate that we are at now... it is going to take some time for that to happen, for us to moderate it as well as for that to then feed into the real economy."
Known as a dove within the MPC, Dhingra has consistently voted since February to cut the Bank Rate from its 16-year high of 5.25%.
NZ BNZ services falls to 40.2, weakness accelerating
New Zealand BusinessNZ Performance of Services Index fell from 42.6 to 40.2 in June, marking the lowest level for the sector outside a COVID lockdown month since the survey began in 2007.
BusinessNZ chief executive Kirk Hope noted that after a poor May result, June's figures "simply got worse". Activity/Sales dropped to 35.6 and New Orders/Business fell to 38.3, both hitting record lows for non-lockdown months. Employment decreased to 45.6, the lowest since February 2022, while Supplier Deliveries declined to 41.6, the lowest since March 2022.
Negative comments rose to 67.0% in June, up from 65.4% in May and 66.3% in April, with respondents citing recessionary pressures.
BNZ Senior Economist Doug Steel observed, "The Performance of Services Index has been well below average for more than a year. Moreover, the weakness appears to be accelerating."
China's Q2 GDP growth slows to 4.7% amid weak domestic demand
China's GDP grew 4.7% yoy in Q2, down from 5.3% in Q1 and missing expectations of 5.1%. For the first half of the year, GDP growth stood at 5% year-on-year.
The National Bureau of Statistics noted, "The current external environment is complicated, while domestic demand remains insufficient. We still need to consolidate the foundation for economic recovery."
June's industrial production increased by 5.3% yoy, exceeding expectations of 5.0% yoy. However, retail sales grew only 2.0% yoy, well below the forecasted 3.3% yoy.
Fixed asset investment in the first six months rose by 3.9% ytd yoy, meeting expectations. Property investment saw a -10.1% yoy decline, consistent with May's fall. Additionally, home sales by floor area dropped by -19.0% yoy.
Bitcoin ready for new record high, Ethereum following
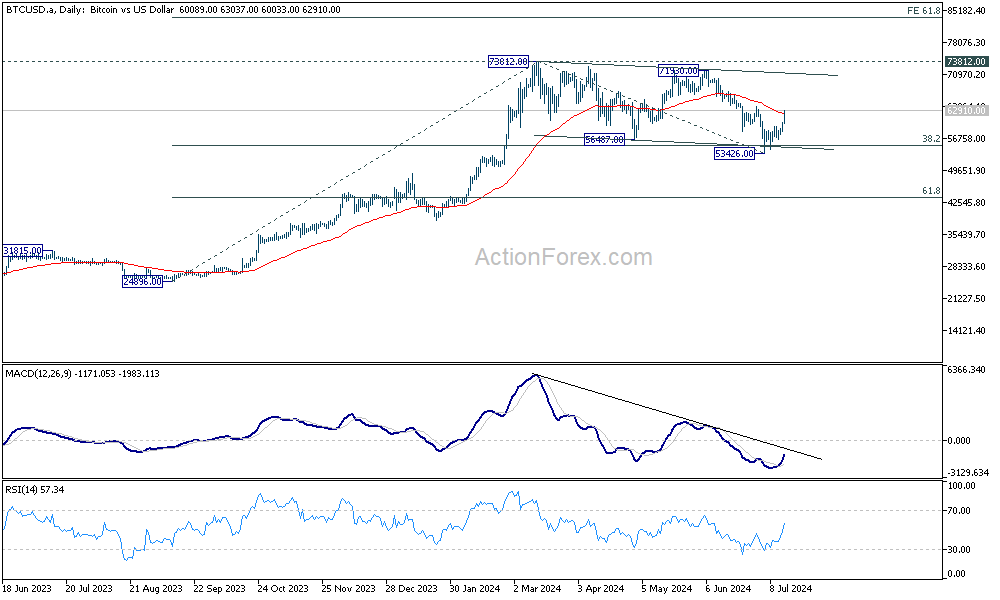
Bitcoin jumps sharply higher today as rebound from 53426 extended. The break of 55 D EMA (now at 62400) is taken as a sign that corrective pattern from 73812 has completed with three waves down to 53426. That came after hitting 38.2% retracement of 24896 to 73812 at 55126.
Sustained trading above 55 D EMA will strengthen this bullish case. Bitcoin should then target 73812 record high, and then 61.8% projection of 24896 to 73812 from 53426 at 83656.
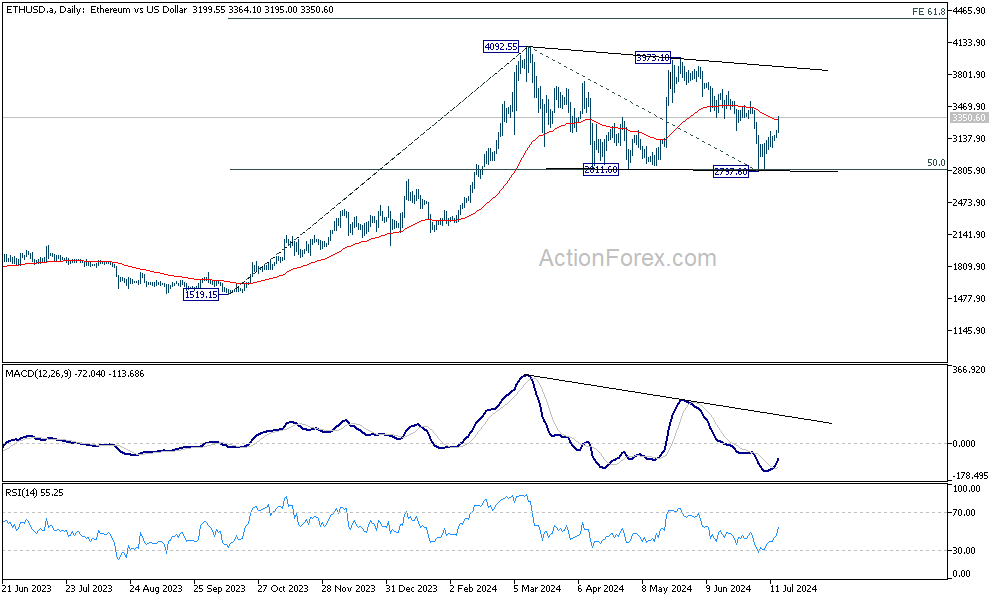
Similarly, Ethereum's corrective pattern from 4092.55 could have finished with three waves to 2797.60, after hitting 50% retracement of 1519.15 to 4092.55 at 2805.85. Sustained trading above 55 D EMA (now at 3333.45) would solidify this bullish case. Ethereum should then target 4092.55 high and then 61.8% projection of 1519.15 to 4092.55 from 2797.60 at 4387.96.
EUR/USD Mid-Day Outlook
Daily Pivots: (S1) 1.0876; (P) 1.0893; (R1) 1.0925; More....
No change in EUR/USD's outlook and intraday bias remains on the upside for the moment. Decisive break of 1.0915 resistance will resume whole rise from 1.0601 to 100% projection of 1.0601 to 1.0915 from 1.0665 at 1.0979. On the downside, below 1.0859 minor support will turn intraday bias neutral first.
In the bigger picture, price actions from 1.1274 are viewed as a corrective pattern, possibly a triangle, that's still be in progress. Break of 1.1138 resistance will be the first signal that rise from 0.9534 (2022 low) is ready to resume through 1.1274 (2023 high). This will now remain the favored case as long as 1.0601 support holds.
Economic Indicators Update
| GMT | Ccy | Events | Actual | Forecast | Previous | Revised |
|---|---|---|---|---|---|---|
| 22:30 | NZD | Business NZ PSI Jun | 40.2 | 43 | 42.6 | |
| 23:01 | GBP | Rightmove House Price Index M/M Jul | -0.40% | 0.00% | ||
| 02:00 | CNY | GDP Y/Y Q2 | 4.70% | 5.10% | 5.30% | |
| 02:00 | CNY | Industrial Production Y/Y Jun | 5.30% | 5.00% | 5.60% | |
| 02:00 | CNY | Retail Sales Y/Y Jun | 2.00% | 3.30% | 3.70% | |
| 02:00 | CNY | Fixed Asset Investment YTD Y/Y Jun | 3.90% | 3.90% | 4.00% | |
| 06:30 | CHF | PPI M/M Jun | 0.00% | 0.10% | -0.30% | |
| 06:30 | CHF | PPI Y/Y Jun | -1.90% | -1.80% | ||
| 09:00 | EUR | Eurozone Industrial Production M/M May | -0.60% | -1.00% | -0.10% | |
| 12:30 | USD | Empire State Manufacturing Index Jul | -6.6 | -5.5 | -6.0 | |
| 12:30 | CAD | Manufacturing Sales M/M May | 0.40% | 0.20% | 1.10% | |
| 12:30 | CAD | Wholesale Sales M/M May | -0.80% | 2.00% | 2.40% | |
| 14:30 | CAD | BoC Business Outlook Survey |
GBP/USD Outlook: Cable Holding Near 1.3000 Barrier Ahead of Powell’s Speech
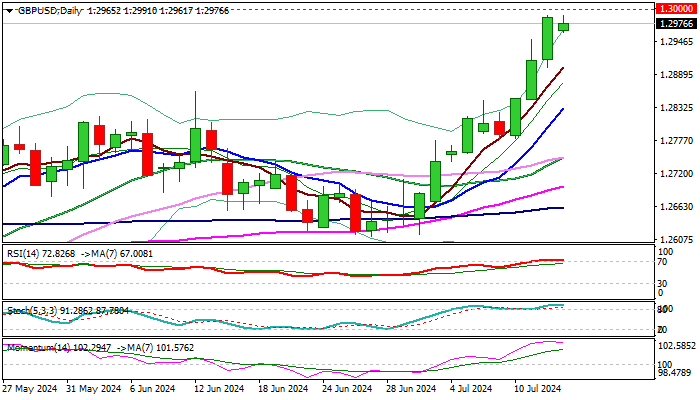
Cable keeps form tone on Monday and hit new yearly high, trading just ticks under psychological 1.30 barrier.
The pair advanced strongly in past two weeks and bulls may start to lose traction on facing headwinds from 1.30 resistance, as daily studies are overbought, and 14-d momentum indicator is turning south at very high levels in the positive territory.
Markets also await the speech from Fed Chairman Powell, later today, expecting more signals from the central bank about the monetary policy.
The latest data showed inflation returned to the path towards 2% target, adding to expectations for September rate cut, however, Chief Powell needs to confirm this in one of his last speeches ahead of July 30/31 policy meeting.
On the other hand, Powell may say that conditions are improving, but the central bank still needs more evidence to eventually give firmer signal of rate cut, which will be hawkish signal and negative for the pound.
Also, assassination attempt on former US President and presidential candidate Donald Trump, over the weekend, has sent a shockwaves through the markets and may continue to impact market performance.
While technical studies show initial reversal signals and warn of pullback, it is more likely that fundamentals (Powell’s speech today and UK inflation data on Wednesday) will again play a key role in defining cable’s near-term direction.
In bearish scenario of an upside rejection at 1.30 barrier, the price may drop towards strong supports at 1.2860/30 (June 12 former high / rising 10DMA).
Conversely, sustained break of 1.30 pivot to open way for fresh acceleration higher and expose targets at 1.3100/41 (round-figure / 14 July 2023 peak).
Res: 1.3000; 1.3049; 1.3100; 1.3141.
Sup: 1.2961; 1.2902; 1.2860; 1.2830.
Oil Price Update – Oil Prices Hold Firm as Chinese Demand Concerns Rise
- Oil prices remain stable despite a turbulent weekend and a strong US dollar.
- Chinese economic data, including disappointing GDP growth and declining refinery output, raises concerns about oil demand.
- The focus shifts from supply concerns in the US to demand worries in China.
- Technical analysis suggests potential for a triple bottom pattern in oil prices, with key support and resistance levels identified.
Oil prices remained resilient this morning following a turbulent weekend. An attack on US Presidential hopeful Donald Trump has seen the US Dollar start the week on the front foot but Oil prices have held firm.
Data out of China this morning stoked fears around demand once more, something which market participants had hoped was in the rearview mirror. The overall fundamental picture remains largely positive but demand concerns may hamper any further gains in the short-term.
Chinese Data
China’s GDP data released this morning was disappointing as sluggish domestic demand bites. The data prompted several investment banks to lower their GDP forecasts.
GDP growth slowed to 0.7% quarter-on-quarter (q/q) seasonally adjusted (SA) in Q2, down from 1.6% q/q in Q1 and below market expectations of 0.9%, impacted by slower retail sales growth. Domestic demand and consumer confidence remain weak, with the NBS also attributing the slowdown to extreme weather events and flooding. Although industrial output growth is cooling, it exceeded market expectations, highlighting the uneven nature of China’s recovery. Strong exports are supporting manufacturing activity, with shipments rising 8.6% year-on-year (y/y) in June, up from 7.6% in May. The secondary industry, which includes manufacturing and construction, grew by 5.6% y/y in Q2, down from 6.0% in Q1, while the tertiary industry, or services, increased by 4.2%, down from 5.0%.
Chinese GDP Q2 YoY
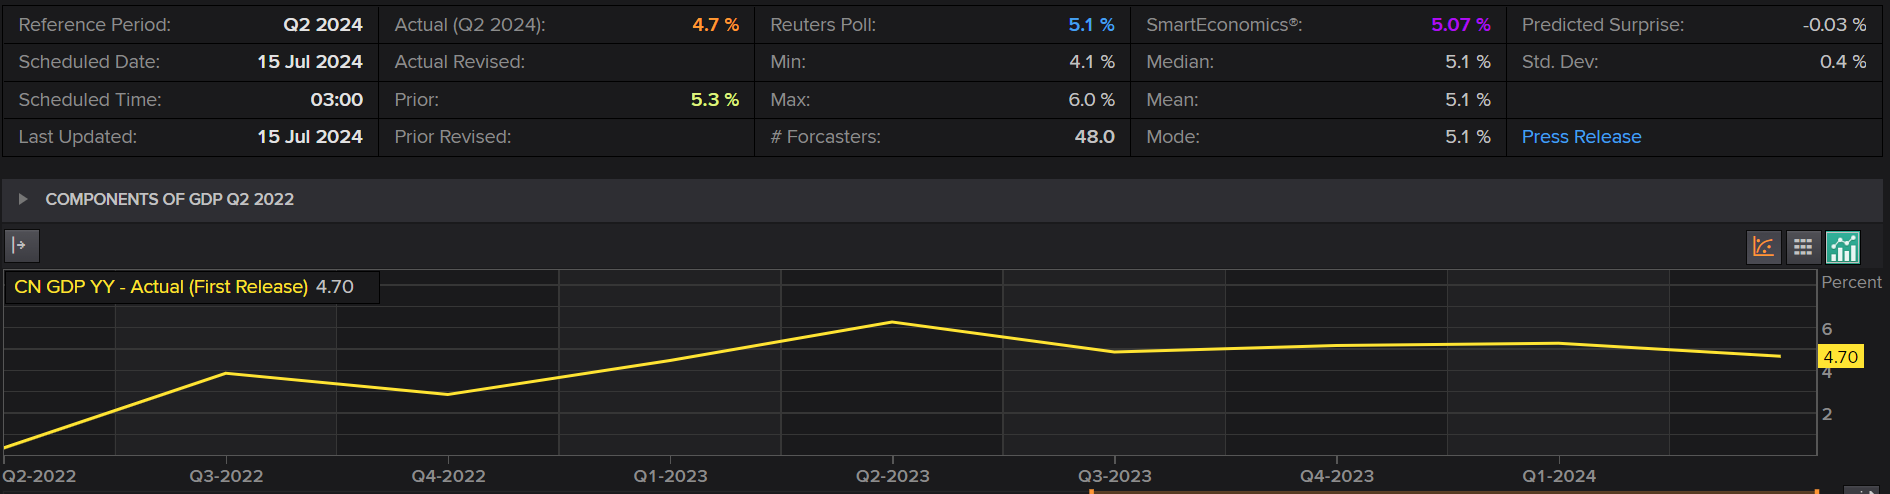
Source: LSEG (click to enlarge)
Chinese refinery output declined for the third consecutive month due to planned maintenance and weak fuel demand, leading independent plants to reduce production. Output for the first half of the year was down 0.4% compared to the same period last year, indicating a sluggish economic recovery and reduced processing profits for refineries.
Crude oil imports for the month of June dropped 11% while H1 imports were down 2.3% YoY. According to the IEA the Chinese share of global oil demand growth is declining to 40% this year from last year’s 70%.
This decline in China has reignited worries about demand, a notable shift from the past two weeks where supply concerns were prevalent in the US.
The Week Ahead
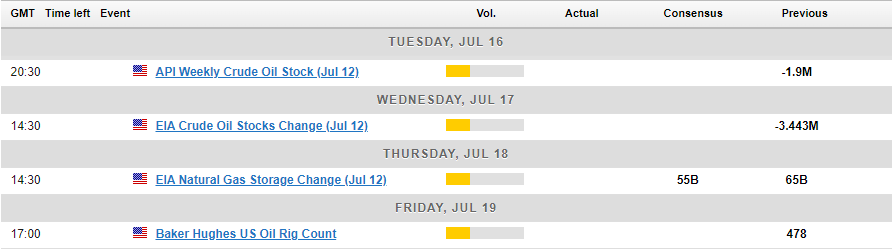
Oil inventory data is very important as the US and Europe are currently in the middle of summer. This period is typically the peak driving season in the US, leading to high demand for petroleum and other oil-related products.
Due to the busy summer season in the US, there is a good chance that weekly oil inventories will decrease more than expected. This could help keep oil prices strong and prevent any significant long-term price drops.
Geopolitics also remains a concern and could once more play an important role in the absence of high impact US economic data.
Technical Analysis
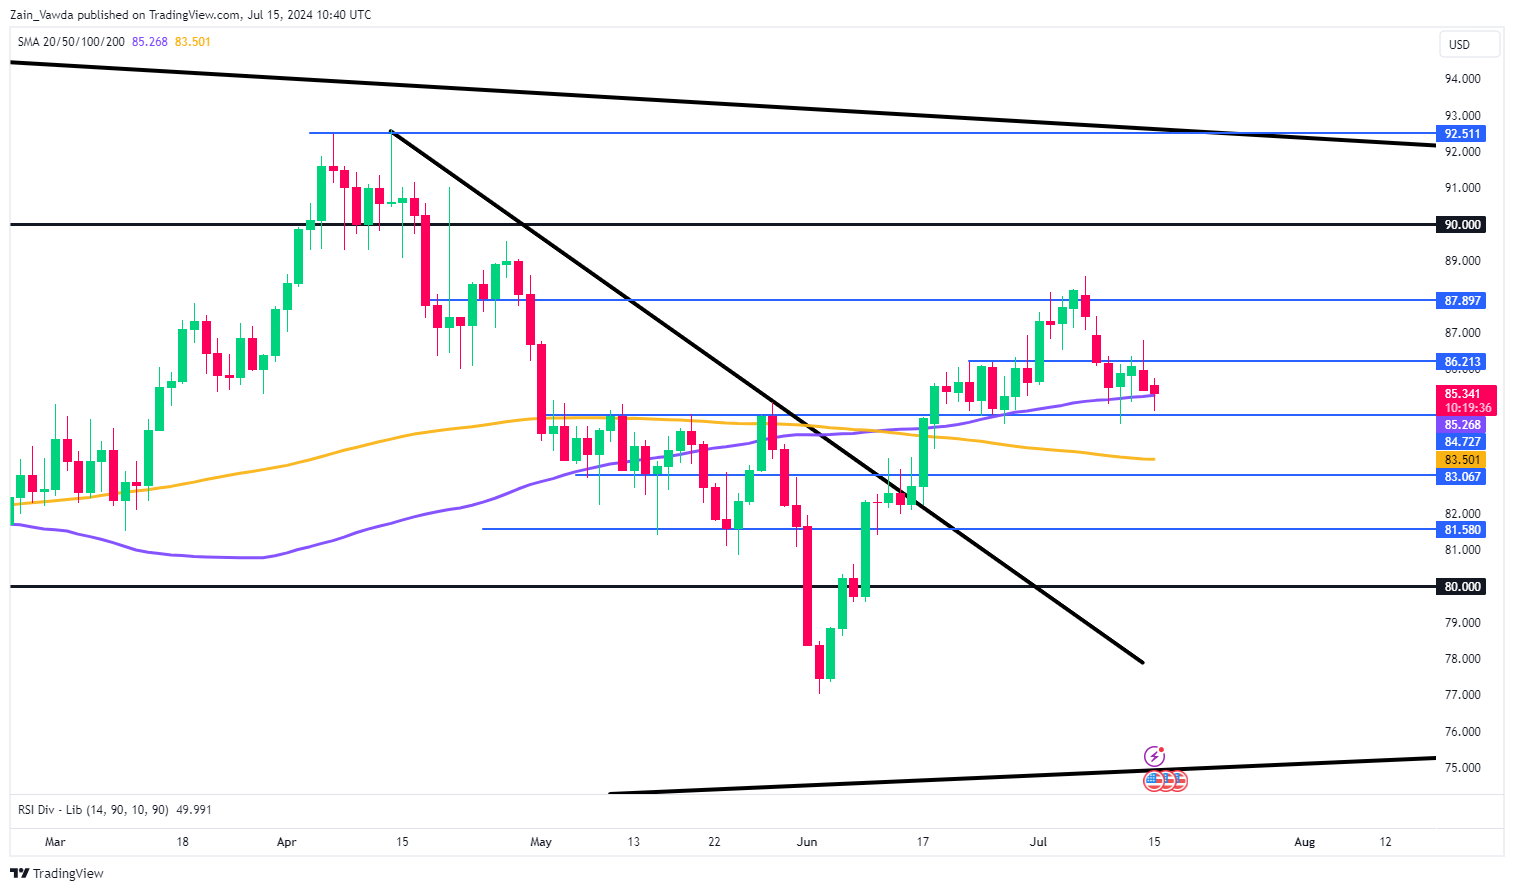
Oil prices snapped a four week winning streak to close around 2.33% lower. The weekly timeframe has price testing the 100-day MA which could prove to be a stern area of resistance.
The daily timeframe is even more interesting as it appears markets could be setting up a triple bottom pattern. Such a pattern would no doubt embolden bulls eyeing further appreciation in oil prices.
A daily candle close below the 85.25 handle opens up a potential selloff in Brent crude with support levels at 83.50 and 82.50 coming into focus. Immediate resistance rests at 86.21 with a break above carrying oil toward 87.90 and potentially the 90.00 psychological level.
Support
- 85.25
- 83.50 (200-day MA)
- 83.00
- 81.58
Resistance
- 86.21
- 87.90
- 90.00 (psychological level)
Brent Crude Oil Daily Chart, July 15, 2024
NZ Dollar Dips After Soft Services PMI
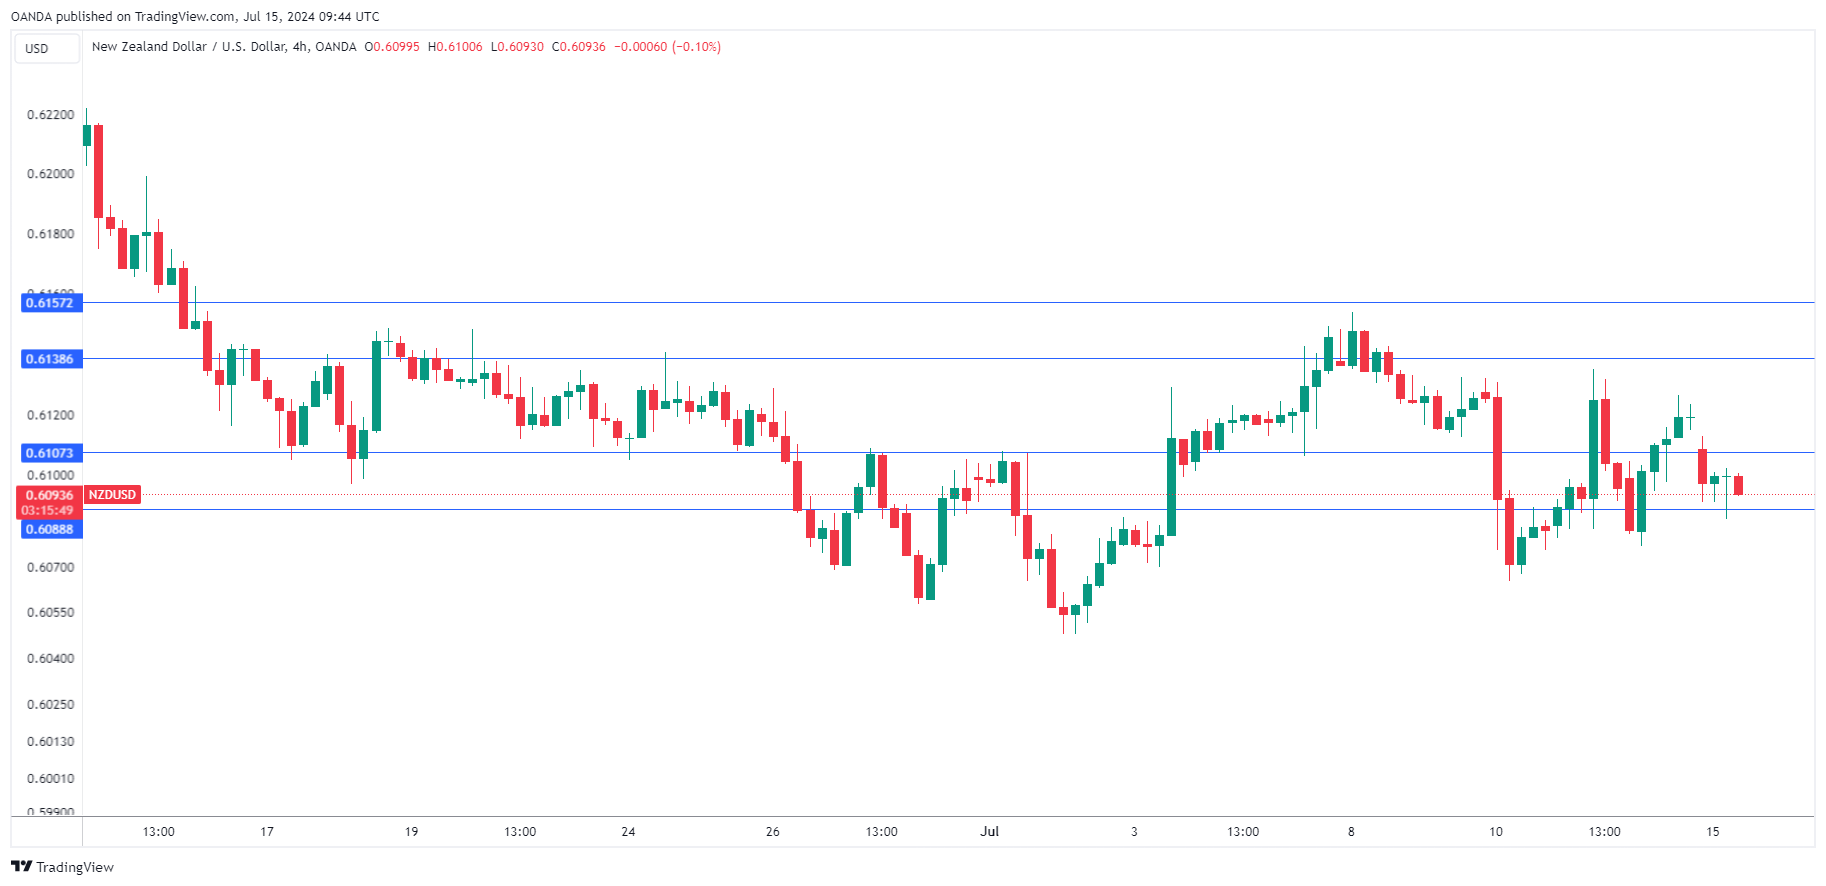
The New Zealand dollar has started the trading week in negative territory. NZD/USD is trading at 0.6097 in the European session, down 0.35% on the day at the time of writing.
New Zealand Services PMI slips
The week started on a sour note in New Zealand as the Services PMI eased to 40.2 in June, down from 42.6 in May, missing expectations and decelerating for a fourth straight month. The sub-categories of employment and new orders posted multi-year lows.
The reading was the weakest reading since May 2020 when New Zealand was grappling with the Covid pandemic. The soft reading follows last week’s Manufacturing PMI, which also decelerated, falling in June from 47.2 to 41.1. The PMI reports present an unflattering picture of the New Zealand economy, with services and manufacturing deep in contraction mode.
New Zealand is heavily dependent on trade with China and the prolonged economic slowdown in China could put a dint in New Zealand’s export sector. China’s GDP fell to 4.7% y/y in the second quarter, down from 5.3% and shy of the market estimate of 5.1%. China’s retail sales and industrial production also declined in June, pointing to weaker economic growth in the world’s second-largest economy.
.
NZD/USD Technical
- NZD/USD is testing support at 0.6107, followed by support at 0.6088
- 0.6138 and 0.6157 are the next resistance lines
Gold’s Rally Stalls at 7-Week High
- Gold jumped to its highest level since May 22 last week
- But fails to extend rally, trading flat in past couple of sessions
- Despite latest weakness, oscillators remain positively tilted
Gold has been experiencing solid gains since late June, with the break above its 50-day simple moving average (SMA) and restrictive trendline brightening the short-term technical outlook. However, the rally seems to be on pause in the latest sessions as indicators have approached overbought conditions.
Should the advance falter, the price could reverse towards two previous resistance zones of 2,388 and 2,368, which could now serve as support. Further declines could then stall at 2,317, a region that held its ground both in June and July. Even lower, bullion might face the 2,294-2,777 range, defined by the May and June lows.
On the flipside, if the bulls propel the price even higher, immediate resistance could be found at the April high of 2,430. Surpassing that hurdle, gold might attempt to revisit its all-time high of 2,450. A violation of that zone could send the price to uncharted waters, where the 2,500 psychological mark could curb further upside moves.
In brief, gold’s rally seems to have taken a pause in the past couple of sessions, but the risks remain tilted to the upside. For that bullish sentiment to alter, the price needs to fall back below the 50-day SMA.

Bitcoin Has Surfaced Following a Dive
Market picture
On Sunday, the cryptocurrency market moved to a rapid rise, completing a consolidation after a correction. Cryptocurrencies positively played off the strengthening chances of Trump’s victory after the assassination attempt. In addition, buyers were clearly encouraged by how the market stood up to the roughly $2.9bn sell-off in bitcoin by German authorities. The appetite for cryptocurrencies was clearly higher.
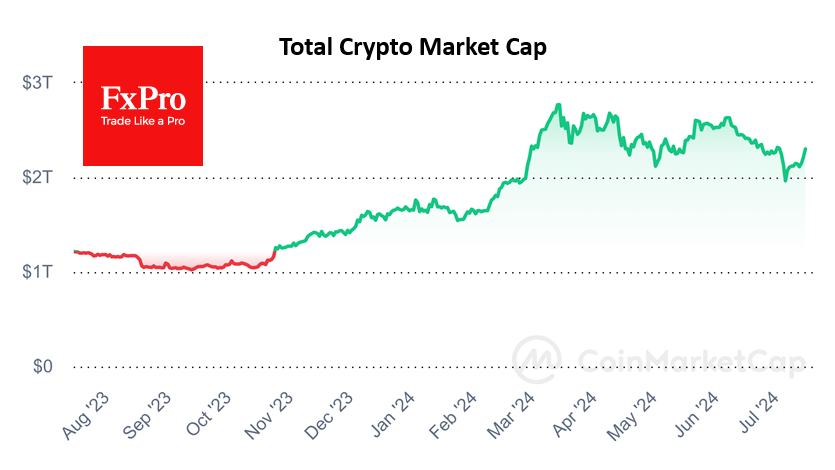
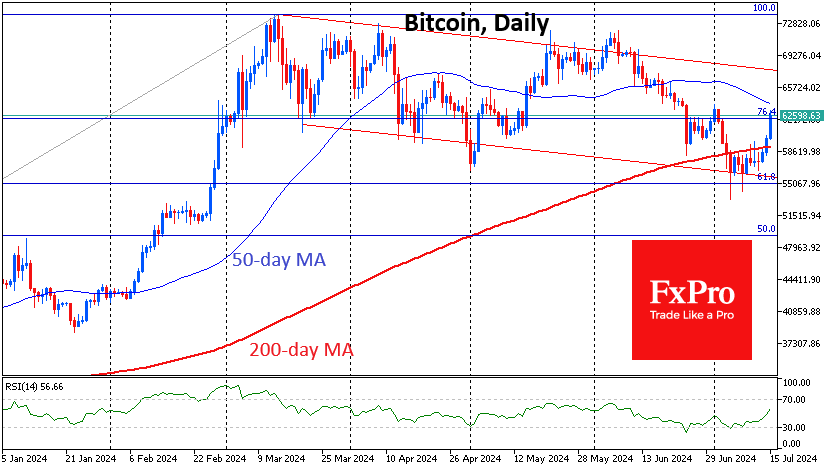
The technical picture in Bitcoin is promising as it has managed to make a sharp move back into territory above the 200-day moving average after 8 days of fluctuating below. At the time of writing, the price is back at $62.9K, the area of the highs at the start of July. The next milestones will be the 50-day moving average near $64K and the upper boundary of the descending channel near $67K by the end of the month.
Price dips below $55K plunged the price below the 61.8% level from the rise of the September lows to the March highs, realising a classic Fibonacci retracement. Bitcoin’s ability to overcome $71.5K would trigger an upside scenario with a potential target of $104K (161.8%).
News background
On 12th July, German authorities sold off another 2,700 BTC worth about $154.6 million. Later, reports emerged that the German Criminal Police (BKA) sold all 49,860 BTC worth about $2.9 billion seized in January from piracy portal Movie2k.
CryptoQuant recorded an increase in exchange balances but ruled out the impact of the German authorities’ action on the metric. The reason may be the increased trading activity of speculators spooked by the distribution of bitcoins to Mt.Gox clients and sales from the BKA wallet. The crypto market will start to recover in August, JPMorgan expects.
The SEC has dropped its investigation into BUSD. Paxos, the issuer of Binance’s stablecoin, has been notified by the SEC that there are no plans for enforcement action.
The institutional adoption of XRP and ICP is getting a boost from CME’s new benchmarks. XRP and Internet Computer (ICP) have been rising sharply since the second part of last week. North America’s largest derivatives exchange, CME. and leading cryptocurrency benchmark index provider, CF Benchmark, will launch real-time ICP and XRP indices on 29th July.
The Hamster Kombat team announced a second airdrop. The developers were optimistic about the game’s prospects after the first airdrop, which is scheduled for the end of July.
Since 2019, crypto platforms have received about $100bn worth of digital assets from known illicit wallets, Chainalysis estimated.
Nikkei Index Has Risen To a Two-Month High
As we reported on 26th June, analysing the Nikkei 225 chart (Japan 225 on FXOpen):
→ The price is in a significant upward trend (shown by the blue channel);
→ The price may continue to rise along the median line.
Since then, the Nikkei 225 index (Japan 225 on FXOpen) has increased by more than 6%, reaching a yearly high on 10th July above 42,500 points. The price particularly surged on 9-10 July, breaking resistance at 41,160 (formed from the previous peak at the end of March).
However, the bears made a strong comeback afterwards, pushing the price back to the 41,160 level. Thus:
→ Completely offsetting the gains from 9-10 July;
→ Forming a bearish engulfing pattern spanning 4 candles;
→ Prompting consideration that the breakout above 41,160 was false (a trap for bulls).
According to Reuters, bearish drivers included technology stocks such as Tokyo Electron, which saw a more than 6% decline in one day, following sell-offs in US technology stocks (as reported on 12th July).
Sentiment in the Japanese stock market is also influenced by risks of interventions by the Bank of Japan to support the yen.
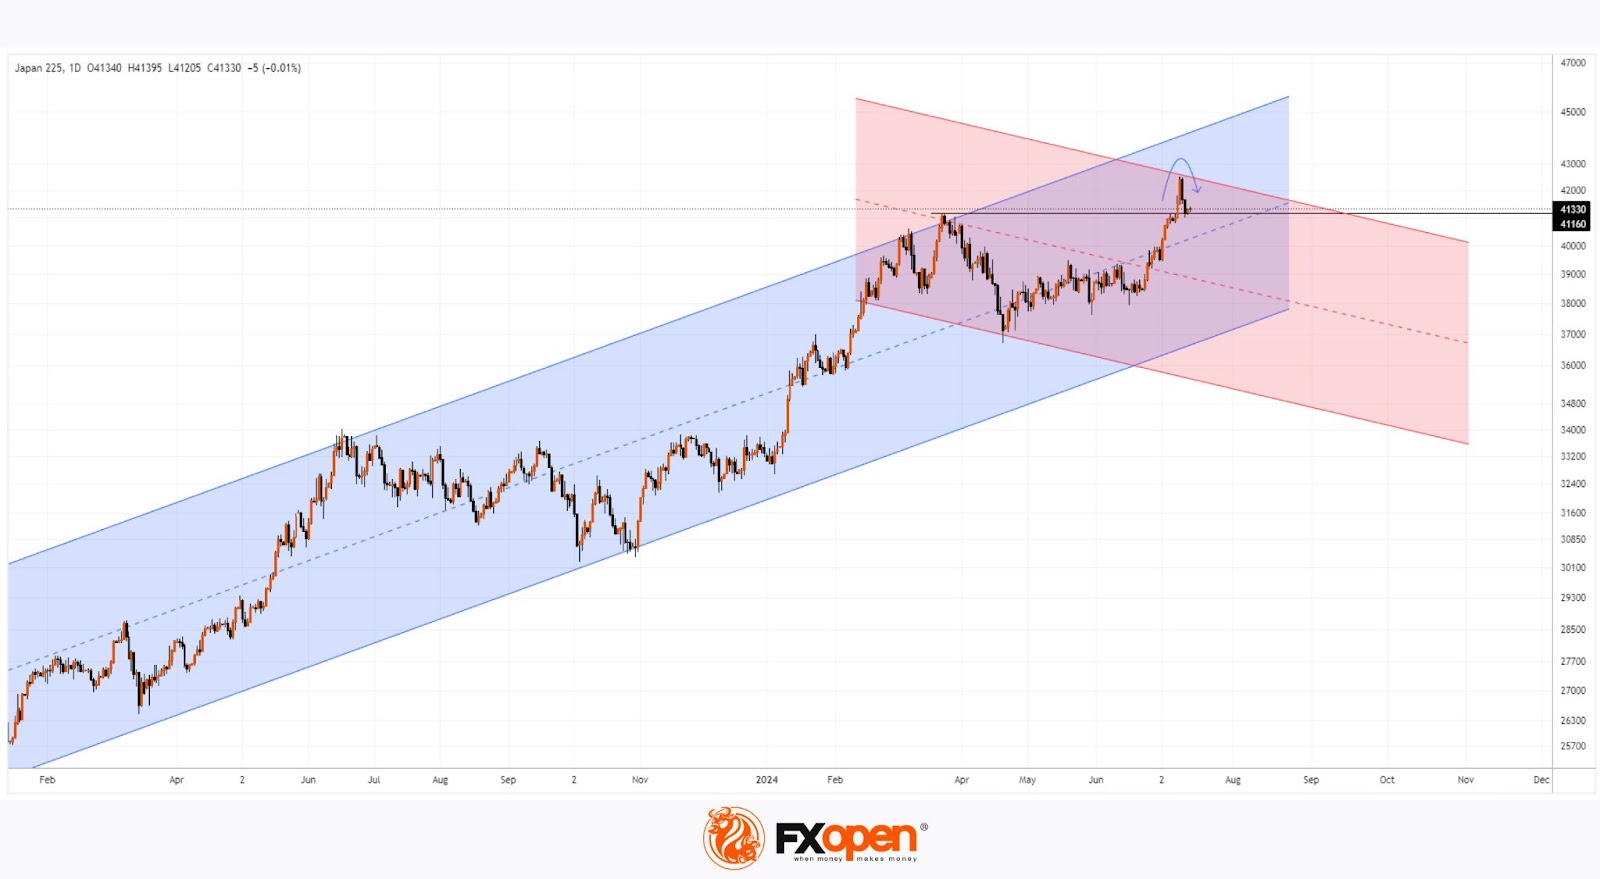
Technical analysis of the Nikkei 225 (Japan 225 on FXOpen) provides further insights:
→ The price is still in the upper half of a significant ascending channel (shown by the blue channel), originating in 2023;
→ There is no conclusive evidence yet that the price is consolidating below the 41,160 level.
However, it's possible that the bears could break below the median of the blue channel and consolidate below 41,160.
In that case, the bearish reversal from last week could become a key point in constructing an important descending channel for the Nikkei 225 index (Japan 225 on FXOpen), whose contours are already emerging (shown in red). Looking ahead to the second half of 2024, this suggests a potential break of the lower boundary of the blue channel.
Trade global index CFDs with zero commission and tight spreads. Open your FXOpen account now or learn more about trading index CFDs with FXOpen.
This article represents the opinion of the Companies operating under the FXOpen brand only. It is not to be construed as an offer, solicitation, or recommendation with respect to products and services provided by the Companies operating under the FXOpen brand, nor is it to be considered financial advice.