
Sample Category Title
Weekly Focus – A Summer Full of Data and Central Bank Meetings
This week has been quiet in terms of global macro data and events. In this final Weekly Focus before the summer break, we will thus mainly highlight key data and events to watch until the Weekly Focus returns on Friday, 16 August.
This week's data releases included June inflation figures from France, Spain, and Italy, which were in line with expectations. Consequently, we continue to anticipate a decline in both euro area headline and core inflation to 2.5% and 2.8% y/y, respectively, on Tuesday. Core inflation remains subdued due to negligible inflation in core goods, while the momentum in core services is higher than the ECB would prefer.
The Ifo index of the German economy declined unexpectedly in June like the PMI report. The decline in June follows three months of increases in the Ifo and PMI indices. While we should not put too much emphasis on one month, the June data clearly questions the strength of the growth rebound in Germany and the euro area.
We can look forward to several significant events and data releases throughout the summer. The upcoming French elections on the next two Sundays could likely result in a "hung parliament," easing market concerns about significant spending increases. Should the National Rally (RN) win an absolute majority, we anticipate a rise in spending. However, RN's recent scaling back of expensive initiatives and softer EU rhetoric suggest that the yield spread to Germany will decrease in either scenario.
In July, the ECB, Fed, and BoJ will hold monetary policy meetings. We anticipate no changes in policy rates from the ECB and Fed, as neither has signalled a pressing need to adjust rates this summer. With inflation remaining persistent and economies coping well with current policies, both are likely to delay any rate cuts until more data is available; we expect the Fed to deliver the first rate cut in September and the ECB in December. At the BoJ meeting, a detailed tapering plan is expected as warranted at the June meeting. We expect no rate hike despite the weak yen as price pressures have muted and we are still waiting for any significant reflationary spillover from the solid spring wage increases.
On the data front, the key data to follow during the summer will be the euro area and US inflation and PMI data. We anticipate that the euro area PMIs will remain largely stable, with the manufacturing sector showing improvement and the service sector maintaining a high level. We expect July HICP at 2.4% y/y. In the US, we expect a gradual cooling of data over the summer, with July's core CPI increasing by 0.2% month-on-month, seasonally adjusted, and non-farm payrolls adding +180k jobs on Friday.
In China focus over the summer will be on the so-called Third Plenum, which is a gathering of the Central Committee of the Chinese communist party, taking place every five years and laying out reform blueprints for the next five years. In terms of key figures, the most important ones will be PMIs, home sales and retail sales.
In Japan, we get the Q2 Tankan survey on Monday, which will be interesting following the steep decline in service PMI for June. The economic recovery in Japan has been sputtering this year and Tankan data will be important input ahead of the 31 July BoJ meeting.
Sunset Market Commentary
Markets
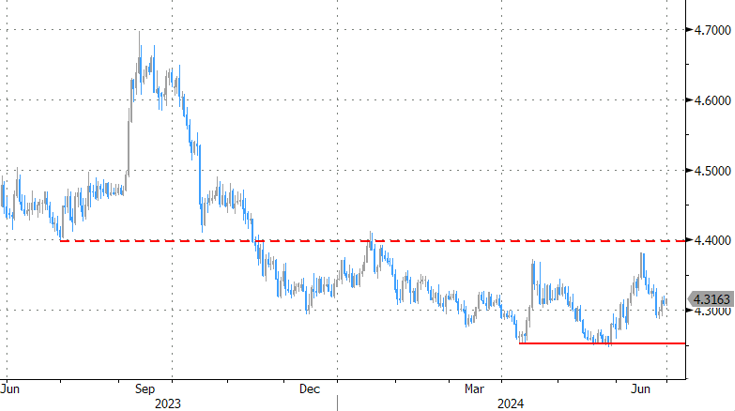
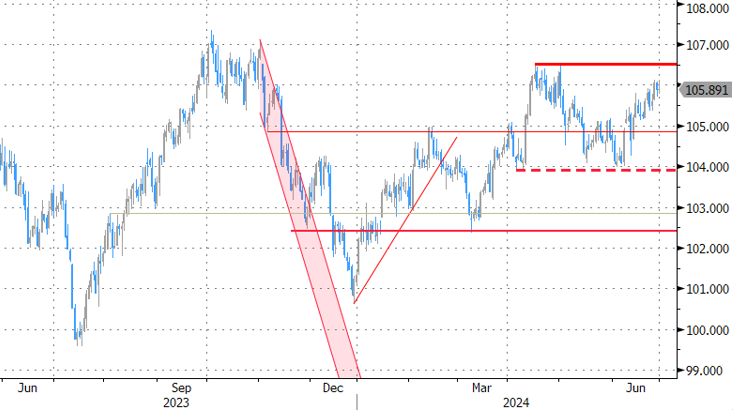
Today’s avalanche of inflation numbers had little surprises in store. Euro area member states France (0.1% m/m, 2.6% y/y) and Spain (0.3% m/m, 3.5% y/y) reported theirs ahead of the June European figure next Tuesday. Both printed bang in line with expectations, suggesting an outcome close to the European consensus of 2.5%. US May PCE deflators were up next, coming in … bang in line with expectations. The headline index was flat on the month and eased from 2.7% to 2.6% y/y. The core gauge rose 0.1% m/m and 2.6% y/y with an upward revision of the April reading to 0.3% m/m. The CPIs published earlier this month, if anything, entailed risks for a downside surprise. So to see US yields still snap lower (daily losses between 0.5 and 4.5 bps) on a PCE exactly as expected tells a lot about the current market sentiment. The end of the quarter is likely to have supported a more technical bid as well, in particular since it coincides with an important weekend. The first round of the snap French parliamentary elections takes place this Sunday. Market nervousness translates into French asset underperformance. The CAC40 loses 0.7% vs other European indices trading flat to only marginally lower. The OAT/Bund spread rises 4 bps, more than semi-core peers including Belgium (flat) and comparable to daily changes in the European periphery (Italy +3 bps, Spain +6 bps, Portugal +1 bps, Greece +2 bps). On a yield level, the French 10-yr tenor briefly surpassed the previous YtD high seen in the aftermath of Macron’s announcement. This compares to the German reference that’s still trading 20+ bps below the YtD. A wary euro is unable to profit from UST outperformance. EUR/USD trades around the 1.07 barrier. Election fever is spreading from the European mainland to the UK on Thursday. General elections are all but certain to bring Labour back into power after 14 years in the opposition. Europe continues to take center stage next week with the ECB’s Sintra conference (“Monetary policy in an era of transformation”) kicking off. One of the attention grabbing themes is about the drivers of the equilibrium interest rates. ISM business confidence and the June payrolls report is due in the US.
News & Views
Polish consumer prices in the country in June rose 0.1% M/M and 2.6% Y/Y (was 0.2% M/M and 2.5% Y/Y in May), Statistics Poland revealed today. The figure was marginally softer than expected. Prices of food and non-alcoholic drinks increased 0.7% M/M, but electricity and gas prices declined 0.1% M/M while fuel prices were 2.8% lower compared to May. Headline inflation is within the 2.5% +/- 1.0% target range of the National Bank of Poland (NBP) since February. Even so, the NBP at the June meeting reiterated that inflation developments are associated with substantial uncertainty related to the impact of fiscal and regulatory policies as well as to the pace of economic recovery. Higher energy prices (removal of price cap) and demand pressures due to strong wage growth might cause inflation to rise in the second half of the year. Most MPC members, including Governor Glapinski, recently held to the communication that rate cuts this year (policy rate 5.75%) are unlikely. The next NBP policy decision is scheduled for Wednesday next week. After a risk-off driven setback early this month, the zloty again trades to the stronger side of the EUR/PLN 4.25/4.41 trading range that guided trading this year (currently 4.31).
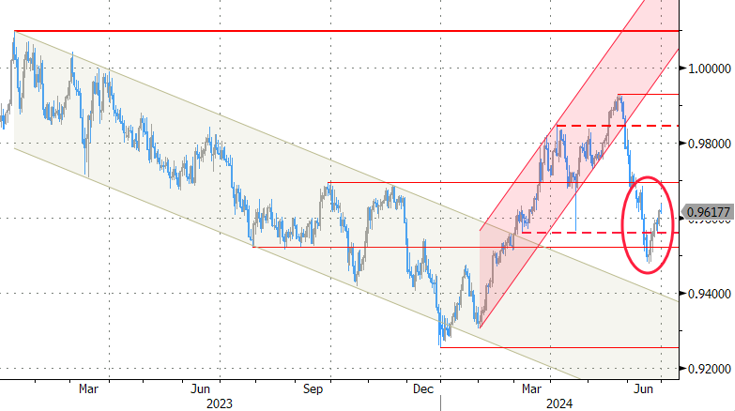
The Swiss National Bank (SNB) reported it bought a limited amount of CHF 281 mln in foreign currency in Q1. This is a sharp turnaround compared last year when it sold substantial amounts of foreign currency/bought CHF to support the franc to help bring inflation back to target (amount CHF 22.7 bln in Q4 2023). The SNB didn’t give any comment. However, as inflation returned to the 0 %-2.0% target and SNB even cut its policy rate in March and this month, CHF purchases didn’t fit in the SNB’s policy anymore. At the press conference after the June 20 SNB decision, Governor Jordan indicated that the SNB could intervene in the CHF in both directions. Also today, the KOF Swiss economic Institute reported that its economic barometer increased from 102.2 tot 102.7. The index stays in a slightly above average range since the beginning of the year. The rise is primarily due to a more favourable outlook for foreign demand. The hospitality industry also benefits more strongly. The indicator bundles for manufacturing, construction and private consumption are virtually unchanged in June. In contrast, the outlook for financial and insurance services and other services is slightly gloomier. The Swiss franc since the June 20 SNB decision declined from EUR/CHF 0.948 to currently 0.9625.
Graphs
French 10-yr yield briefly this new YtD high ahead of first round in Sunday’s parliamentary elections
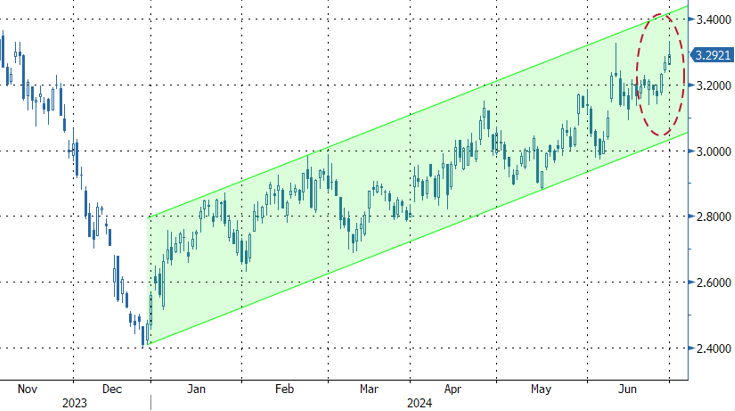
EUR/PLN: zloty back towards stronger side of a sideways trading range after a risk-off driven correction lower early June
EUR/CHF: CHF ready to catch some post-election safe haven bids?
DXY struggles near 106 barrier after in-line PCE triggers UST bid
US: Consumer Income and Spending Grow While Inflation Cools in May
Personal income grew 0.5% month-on-month (m/m) in May, up from April's 0.3% gain, and ahead of market expectations (0.4%).
Accounting for inflation and taxes, real personal disposable was also up 0.5% m/m in May, relative to a flat reading in April (revised up from a -0.1% decline previously).
Personal consumption expenditures rose by 0.2% m/m. This is higher than the revised 0.1% recorded in April (0.2% previously), but below market expectations (0.3%). Spending in real terms rose 0.3% m/m – more than reversing the -0.1% decline recorded in April. The uptick in real spending reflected increases in both goods (0.6%) and services (0.1%) outlays.
On inflation, the Fed's preferred inflation metric, the core PCE price deflator, decelerated on both a monthly and annual basis. The measure fell from 0.3% to 0.1% month-over-month and from 2.8% to 2.6% annually. Both measures were in line with market expectations.
The personal savings rate rose by 0.2 percentage points to 3.9% in May.
Key Implications
Yesterday's GDP update showed that Q1 consumer spending continued to be revised lower. At 1.5%, the Q1 reading is now a full percentage point lower than the advanced estimate, largely due to a combination of weaker durable goods spending and a slower pace of services spending. That said, with data in for the first two months of Q2, growth in real consumer expenditures is expected to land around a similar place for the second quarter.
With May's CPI report following through on the good news from April's release, markets were primed for even more positive developments on the inflation front this morning. The core PCE deflator did not disappoint, with both the monthly and annual figures decelerating. These movements are sure to be welcomed by Fed members, but given the inflation upswing observed at the start of the year, "caution" will remain the watchword. As such, rate cuts aren’t likely to materialize until closer to the end of the year.
EUR/USD Mid-Day Outlook
Daily Pivots: (S1) 1.0678; (P) 1.0703; (R1) 1.0728; More....
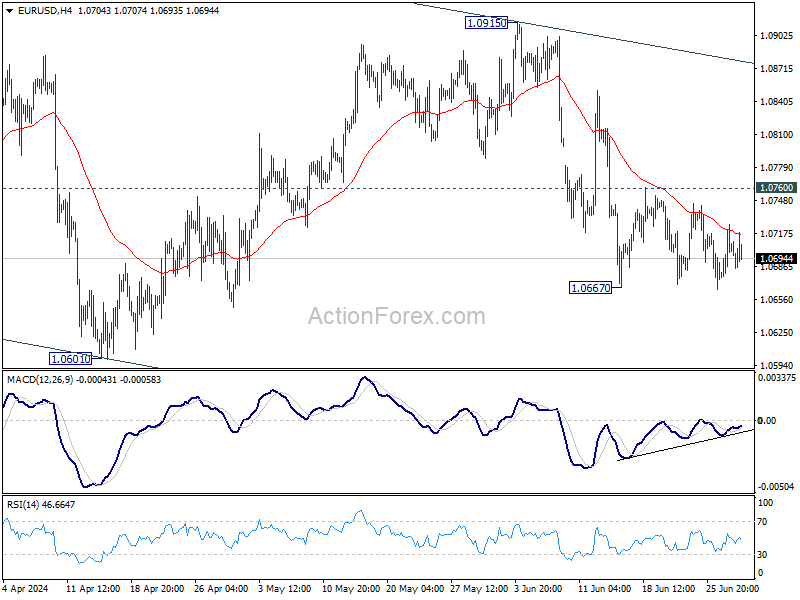
Intraday bias in EUR/USD stays neutral as sideway trading continues. Outlook stays bearish with 1.0760 resistance intact. Decline from 1.0915 is seen as another leg in the larger corrective pattern. Firm break of 1.0667 will target 1.0601 and below. However, decisive break of 1.0760 will turn intraday bias back to the upside for stronger rebound.
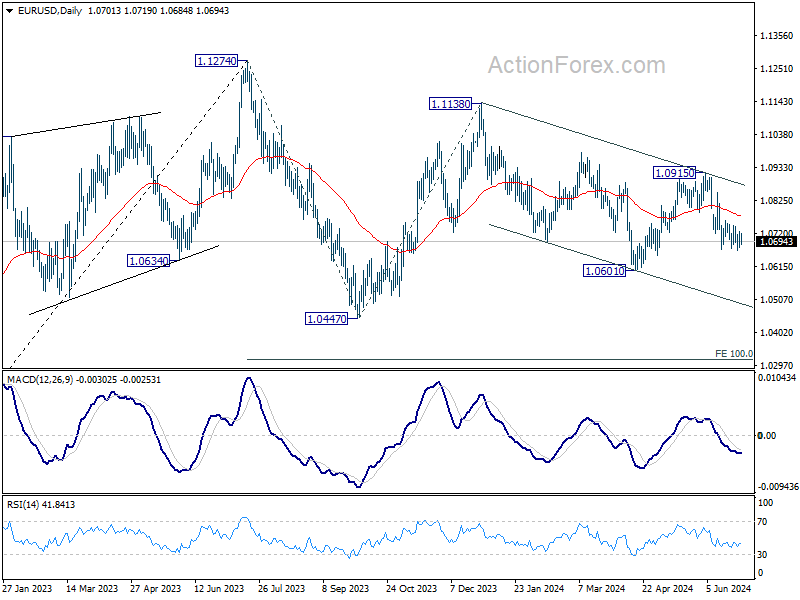
In the bigger picture, price actions from 1.1274 are viewed as a corrective pattern that's still in progress. Break of 1.0601 will target 1.0447 support and possibly further to 100% projection of 1.1274 to 1.0447 from 1.1138 at 1.0311. For now, this will remain the favored case as long as 1.0915 resistance holds, in case of rebound.
GBP/USD Mid-Day Outlook
Daily Pivots: (S1) 1.2612; (P) 1.2641; (R1) 1.2670; More...
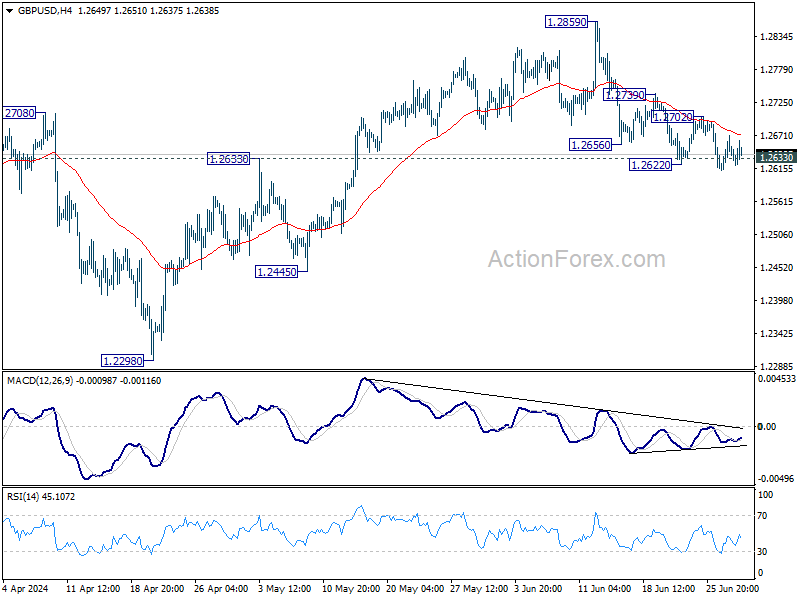
Further decline is still expected in GBP/USD with 1.2702 resistance intact. Sustained trading below 1.2633 resistance turned support will argue that whole rise from 1.2298 has completed, and target 1.2445 and below. On the upside, however, firm break of 1.2702 resistance will argue that pull back from 1.2859 has completed, and bring retest of this high instead.
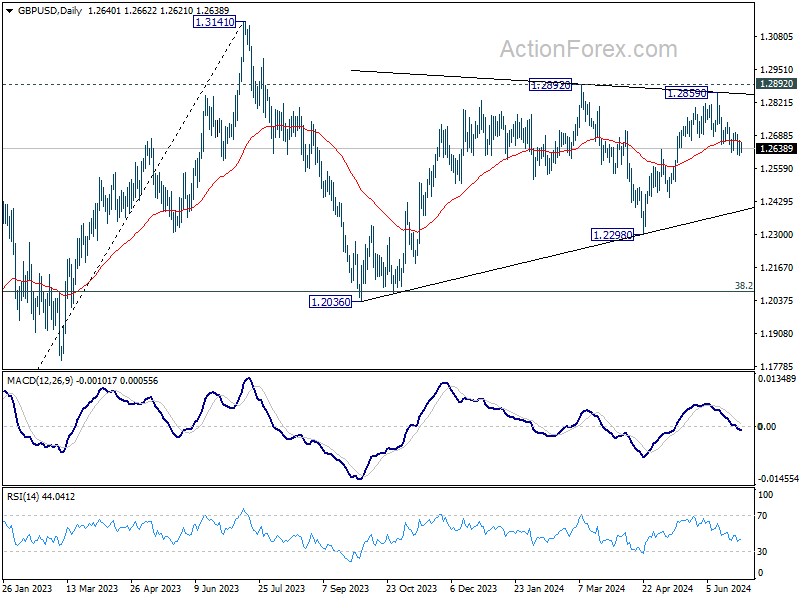
In the bigger picture, price actions from 1.3141 medium term top are seen as a corrective pattern that is still in progress. Break of 1.2445 support will confirm that another falling leg has started and target 1.2036 cluster support again (38.2% retracement of 1.0351 (2022 low) to 1.3141 at 1.2075. Nevertheless, break of 1.2892 resistance will argue that larger up trend from 1.0351is ready to resume through 1.3141.
USD/CHF Mid-Day Outlook
Daily Pivots: (S1) 0.8968; (P) 0.8979; (R1) 0.9000; More…
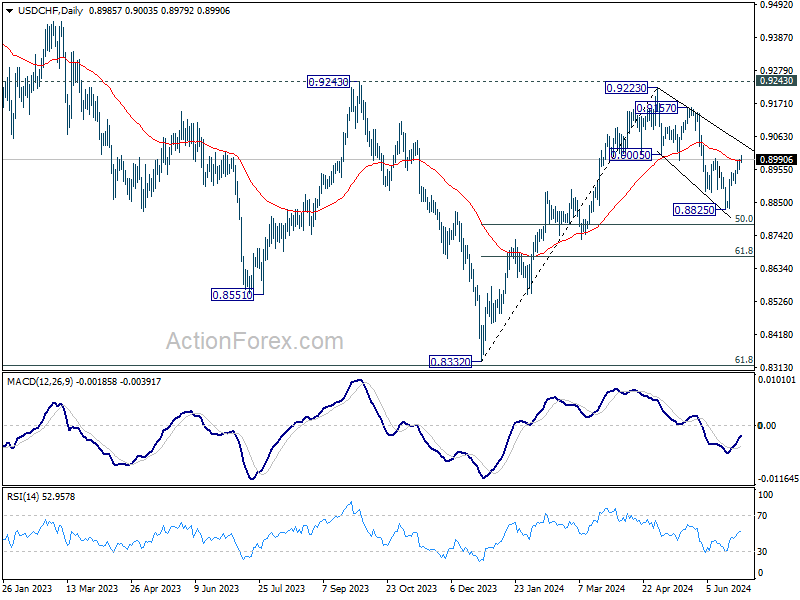
Intraday bias in USD/CHF remains mildly on the upside at this point. Fall from 0.9223 could have completed a three-wave corrective move to 0.8825. Intraday bias is back on the upside for channel resistance (now at 0.9039). Firm break there will target 0.9157 resistance next. On the downside, below 0.8956 minor support will turn intraday bias neutral gain first.
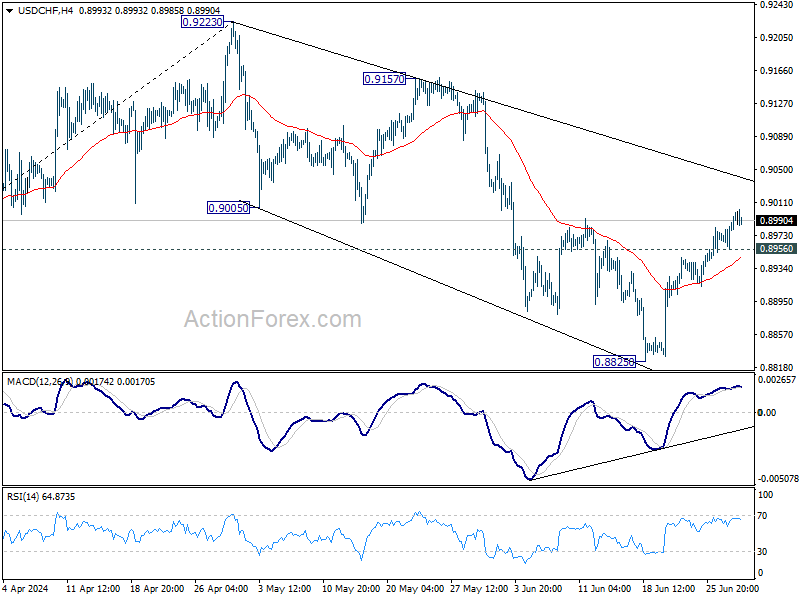
In the bigger picture, price actions from 0.8332 medium term bottom are seen as developing into a corrective pattern to the down trend from 1.0146 (2022 high). Rejection by 0.9243 resistance affirms this case, and maintains medium term bearishness. While more range trading could be seen between 0.8332/0.9243 first, downside break out is mildly in favor at a later stage.
Canada’s Economy Rebounded in April, Modest Growth Expected in May
The Canadian economy bounced back in April, up 0.3% month-on-month (m/m). This print landed in line with Statistics Canada's advanced guidance and market expectations. The flash estimate for May points to a slight advance of 0.1% m/m.
April's reading was broad-based, with output expanding in 15 of 20 industries. The gain was evenly split between goods and services sectors, both expanding by 0.3% m/m.
Wholesale trade contributed most on the services side, growing by 2.0% m/m, the fastest pace since May 2023. Growth in accommodation and food services (1.9% m/m) and finance and insurance (0.4% m/m) also provided an assist.
On the goods side, support activities for mining and oil and gas extraction helped the overall sector grow by 1.8% m/m in April. The manufacturing sector also expanded by 0.4% m/m after contracting for two consecutive months. A small pullback in the construction sector (-0.4% m/m) offset some of the growth on the goods side.
The advanced reading for 0.1% growth in May is being driven by gains in the manufacturing, real estate and finance sectors, with retail and wholesale trade acting as a headwind.
Key Implications
GDP data for April came in bang on with expectations, which has kept growth tracking for the second quarter steady. The Canadian economy indeed started Q2 on solid footing, with early tracking suggesting trend-like growth for the quarter. This would roughly match growth in the first-quarter, which came in at 1.7% quarter-on-quarter annualized.
The Bank of Canada is likely satisfied with today's report. On one hand, there doesn't appear to be signs of a reacceleration in growth. On the other, the Bank should take comfort that its Q2 growth forecast is materializing so far. The stability in the GDP reading will allow the Bank of Canada to keep its focus more squarely on the evolution of inflation, especially with the start of its interest rate easing cycle underway. We believe that the Bank of Canada will hold off on another interest rate cut next meeting, opting instead to move rates lower in September, which will allow them to assess both inflation (and growth) dynamics until then.
USD/JPY Mid-Day Outlook
Daily Pivots: (S1) 160.43; (P) 160.63; (R1) 160.98; More...
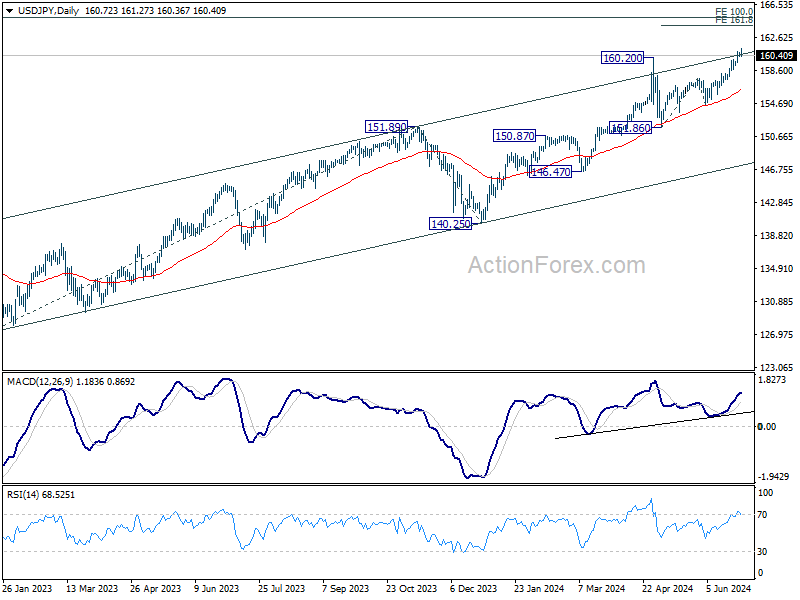
Intraday bias in USD/JPY is turned neutral again with current retreat. Some consolidations could be seen first and deeper pullback cannot be ruled out. But near term outlook will remain bullish as long as 157.70 resistance turned support holds. break of 161.27 will resume larger up trend to 161.8% projection of 151.86 to 157.70 from 154.53 at 163.97.
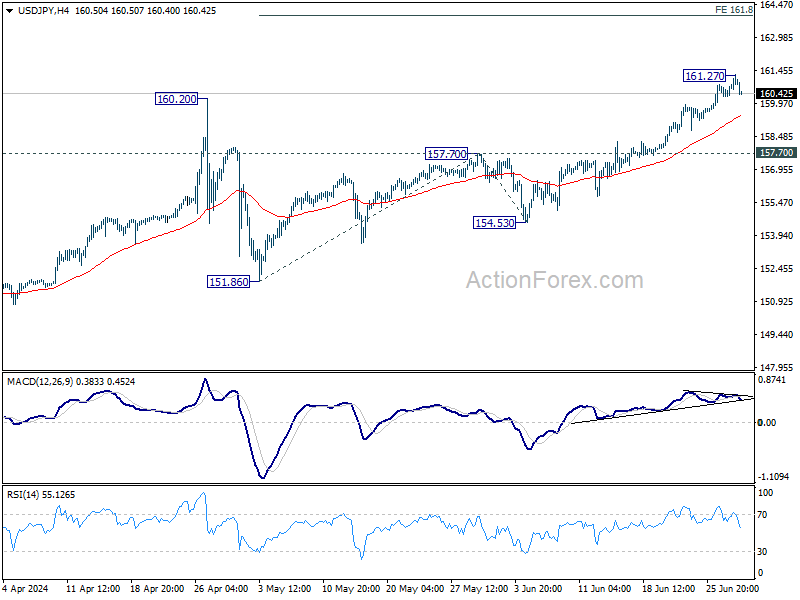
In the bigger picture, there is no sign of long term trend reversal yet. Further rally is expected as long as 151.86 support holds. Decisive break of 160.02 will target 100% projection of 127.20 to 151.89 from 140.25 at 164.94.
Dollar Dips Slightly on PCE Core, But Overall Market Reactions Subdued
Dollar dips slightly in early US session, following the release of May's PCE core inflation data. This Fed's preferred measure of inflation indicated a continued, though modest, progress in disinflation. However, the financial market's response to the report was overall relatively muted, as the figures aligned closely with expectations.
While the data is encourage, it is unlikely to prompt rate cuts from Fed yet. Fed officials have indicated that they require more consistent data over several months to justify such a move. Moreover, they emphasize the need for widespread disinflation. With services price growth still running at an annual rate of 3.9%, there remains significant ground to cover before Fed would feel comfortable easing monetary policy.
In the broader currency markets, Australian Dollar emerged as the strongest performer for the week, bolstered by today's rebound. It was followed by Euro and British Pound. On the other end of the spectrum, Swiss Franc was the weakest performer, followed by New Zealand Dollar and Japanese Yen. Both US Dollar and the Canadian Dollar were positioned in the middle, with the latter showing little reaction to Canada's GDP data.
In Europe, at the time of writing, FTSE is up 0.19%. DAX is up 0.15%. CAC is down -0.83%. UK 10-year yield is down -0.006 at 4.123. Germany 10-year yield is down -0.002 at 2.452. Earlier in Asia, Nikkei rose 0.61%. Hong Kong HSI rose 0.01%. China Shanghai SSE rose 0.73%. Japan 10-year JGB yield fell -0.0254 to 1.048.
US PCE core inflation slows to 2.6% as expected in May
In May, US PCE price index was flat mom, matched expectations. PCE core price index (excluding food and energy) rose 0.1% mom. Both matched expectations. Prices for goods fell -0.4% mom while prices for services rose 0.2% mom. Food prices rose 0.1% mom while energy prices fell -2.1% mom.
From the same month one year ago, headline PCE price index slowed from 2.7% yoy to 2.6% yoy. PCE core price index slowed from 2.8% yoy to 2.6% yoy. Both matched expectations. Goods prices were down -0.1% yoy while services prices were up 3.9% yoy. Food prices were up 1.2% mom and energy prices were up 4.8% yoy.
Also, personal income rose 0.5% mom or USD 114.1B, above expectation of 0.4% mom. Personal spending rose 0.2% mom or USD 47.8B, below expectation of 0.3% mom.
Fed's Barkin: Economy not ready for rate cuts despite expectations
Richmond Fed President Thomas Barkin highlighted the divergence between expectations and reality of US monetary in a speech today. He noted, "Most anticipated we would be cutting rates by now, either because we returned inflation to target, or perhaps because the economy took a turn for the worse. Yet, in contrast to the European Central Bank, that has not yet been the case."
Barkin elaborated on the unique challenges facing the US economy, emphasizing that monetary policy operates with "long and variable lags." He suggested that these lags might be longer than expected due to factors such as labor hoarding, excess savings, delayed exposure to interest rate hikes, and newfound pricing power among businesses.
Furthermore, Barkin raised the possibility that the Fed's rate hikes might not be constraining the economy as much as anticipated. He pointed to the concept of r-star, the neutral real rate of interest, suggesting it might have shifted to a higher level. "It is too soon to tell, but there's one way to find out: Proceed deliberately while keeping a close eye on the real economy. And that's what I am doing," Barkin stated.
Canada's GDP grows 0.3% mom in Apr, matches expectations
Canada's GDP grew 0.3% mom in April, matched expectations. Both goods-producing (+0.3%) and services-producing (+0.3%) industries contributed to the growth with 15 of 20 sectors increasing in the month.
Advance information indicates that real GDP rose 0.1% mom in May. Increases in manufacturing, real estate and rental and leasing and finance and insurance were partially offset by decreases in retail trade and wholesale trade.
ECB's Villeroy: Confidence grows in inflation forecasts as data surprises diminish
ECB Governing Council member François Villeroy de Galhau expressed increased confidence in the inflation forecast today, noting that the frequency of data surprises has diminished.
"As data surprises are now smaller and revisions to the current assessment more minor compared to two years ago, we are gaining more confidence in the forecast and more scope to disregard smaller bumps in the disinflation process," he said.
ECB projects inflation to remain above its 2% target for the rest of this year. However, it anticipates that inflation will start easing next year and reach the 2% target by the end of 2025.
Swiss KOF rises slightly to 102.7, gradual recovery continues
Swiss KOF Economic Barometer rose from 102.2 to 102.7 in June, surpassing expectations of 100.5. According to KOF, the Swiss economy is projected to "continue to recover little by little over the coming months."
This increase is largely driven by a more favorable outlook for foreign demand. Additionally, the hospitality industry is expected to see stronger benefits. The indicators for manufacturing, construction, and private consumption remained virtually unchanged in June. However, the outlook for financial and insurance services, along with other service sectors, has slightly dimmed.
Tokyo CPI surpasses expectations, Japan's industrial output rebounds
Japan's Tokyo CPI core (excluding food) rose to 2.1% yoy in June, beating expectations of 2.0% yoy and up from May's 1.9% yoy. CPI core-core (excluding food and energy) increased from 1.7% yoy to 1.8% yoy. Headline CPI also ticked up from 2.2% to 2.3% year-on-year. Monthly figures showed Tokyo's CPI core rose by 0.4% mom, core-core by 0.3% mom, and headline CPI by 0.3% mom.
In addition, Japan's industrial production saw a significant boost in May, rising 2.8% mom, surpassing the forecasted 2.0%. Of the 15 industrial sectors covered, 13 reported higher output while only two experienced declines.
A Ministry of Economy, Trade and Industry official noted, "The private sector's sentiment toward output is improving as auto production started to pick up." Despite this, the ministry maintained its previous assessment that industrial production "showed weakness while fluctuating indecisively." According to a poll of manufacturers, output is expected to decrease by -4.8% in June but increase by 3.6% in July.
USD/JPY Mid-Day Outlook
Daily Pivots: (S1) 160.43; (P) 160.63; (R1) 160.98; More...
Intraday bias in USD/JPY is turned neutral again with current retreat. Some consolidations could be seen first and deeper pullback cannot be ruled out. But near term outlook will remain bullish as long as 157.70 resistance turned support holds. break of 161.27 will resume larger up trend to 161.8% projection of 151.86 to 157.70 from 154.53 at 163.97.
In the bigger picture, there is no sign of long term trend reversal yet. Further rally is expected as long as 151.86 support holds. Decisive break of 160.02 will target 100% projection of 127.20 to 151.89 from 140.25 at 164.94.
Economic Indicators Update
| GMT | Ccy | Events | Actual | Forecast | Previous | Revised |
|---|---|---|---|---|---|---|
| 23:30 | JPY | Tokyo CPI Y/Y Jun | 2.30% | 2.20% | ||
| 23:30 | JPY | Tokyo CPI ex Fresh Food Y/Y Jun | 2.10% | 2.00% | 1.90% | |
| 23:30 | JPY | Tokyo CPI ex Food & Energy Y/Y Jun | 1.80% | 1.70% | ||
| 23:30 | JPY | Unemployment Rate May | 2.60% | 2.60% | 2.60% | |
| 23:50 | JPY | Industrial Production M/M May P | 2.80% | 2.00% | -0.90% | |
| 01:30 | AUD | Private Sector Credit M/M May | 0.40% | 0.40% | 0.50% | |
| 05:00 | JPY | Housing Starts Y/Y May | -5.30% | -6.00% | 13.90% | |
| 06:00 | EUR | Germany Import Price Index M/M May | 0.00% | 0.20% | 0.70% | |
| 06:00 | GBP | GDP Q/Q Q1 F | 0.70% | 0.60% | 0.60% | |
| 06:00 | GBP | Current Account (GBP) Q1 | -21.0B | -17.7B | -21.2B | |
| 06:45 | EUR | France Consumer Spending M/M May | 1.50% | 0.20% | -0.80% | -0.90% |
| 07:00 | CHF | KOF Economic Barometer Jun | 102.7 | 100.5 | 100.3 | 102.2 |
| 07:55 | EUR | Germany Unemployment Change Jun | 19K | 15K | 25K | |
| 07:55 | EUR | Germany Unemployment Rate Jun | 6.00% | 5.90% | 5.90% | |
| 12:30 | CAD | GDP M/M Apr | 0.30% | 0.30% | 0.00% | |
| 12:30 | USD | Personal Income M/M May | 0.50% | 0.40% | 0.30% | |
| 12:30 | USD | Personal Spending M/M May | 0.20% | 0.30% | 0.20% | 0.10% |
| 12:30 | USD | PCE Price Index M/M May | 0.00% | 0.00% | 0.30% | |
| 12:30 | USD | PCE Price Index Y/Y May | 2.60% | 2.60% | 2.70% | |
| 12:30 | USD | Core PCE Price Index M/M May | 0.10% | 0.10% | 0.20% | 0.30% |
| 12:30 | USD | Core PCE Price Index Y/Y May | 2.60% | 2.60% | 2.80% | |
| 13:45 | USD | Chicago PMI Jun | 40 | 35.4 | ||
| 14:00 | USD | Michigan Consumer Sentiment Index Jun F | 65.6 | 65.6 |
Canada’s GDP grows 0.3% mom in Apr, matches expectations
Canada's GDP grew 0.3% mom in April, matched expectations. Both goods-producing (+0.3%) and services-producing (+0.3%) industries contributed to the growth with 15 of 20 sectors increasing in the month.
Advance information indicates that real GDP rose 0.1% mom in May. Increases in manufacturing, real estate and rental and leasing and finance and insurance were partially offset by decreases in retail trade and wholesale trade.
