Sample Category Title
US PCE core inflation slows to 2.6% as expected in May
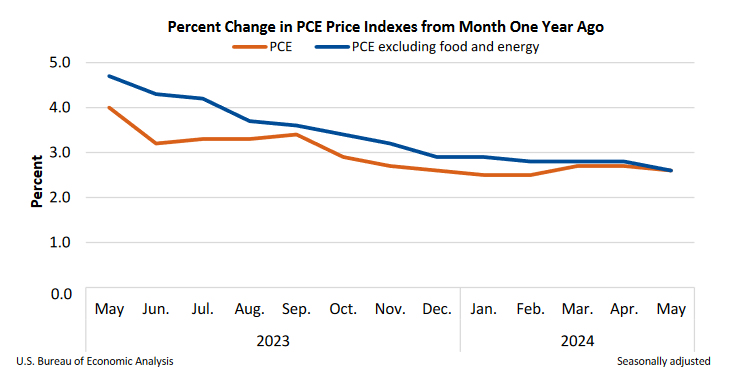
In May, US PCE price index was flat mom, matched expectations. PCE core price index (excluding food and energy) rose 0.1% mom. Both matched expectations. Prices for goods fell -0.4% mom while prices for services rose 0.2% mom. Food prices rose 0.1% mom while energy prices fell -2.1% mom.
From the same month one year ago, headline PCE price index slowed from 2.7% yoy to 2.6% yoy. PCE core price index slowed from 2.8% yoy to 2.6% yoy. Both matched expectations. Goods prices were down -0.1% yoy while services prices were up 3.9% yoy. Food prices were up 1.2% mom and energy prices were up 4.8% yoy.
Also, personal income rose 0.5% mom or USD 114.1B, above expectation of 0.4% mom. Personal spending rose 0.2% mom or USD 47.8B, below expectation of 0.3% mom.
ECB’s Villeroy: Confidence grows in inflation forecasts as data surprises diminish
ECB Governing Council member François Villeroy de Galhau expressed increased confidence in the inflation forecast today, noting that the frequency of data surprises has diminished.
"As data surprises are now smaller and revisions to the current assessment more minor compared to two years ago, we are gaining more confidence in the forecast and more scope to disregard smaller bumps in the disinflation process," he said.
ECB projects inflation to remain above its 2% target for the rest of this year. However, it anticipates that inflation will start easing next year and reach the 2% target by the end of 2025.
USD/JPY Flat, Tokyo Core CPI Higher Than Expected
Japanese yen pushes above 161
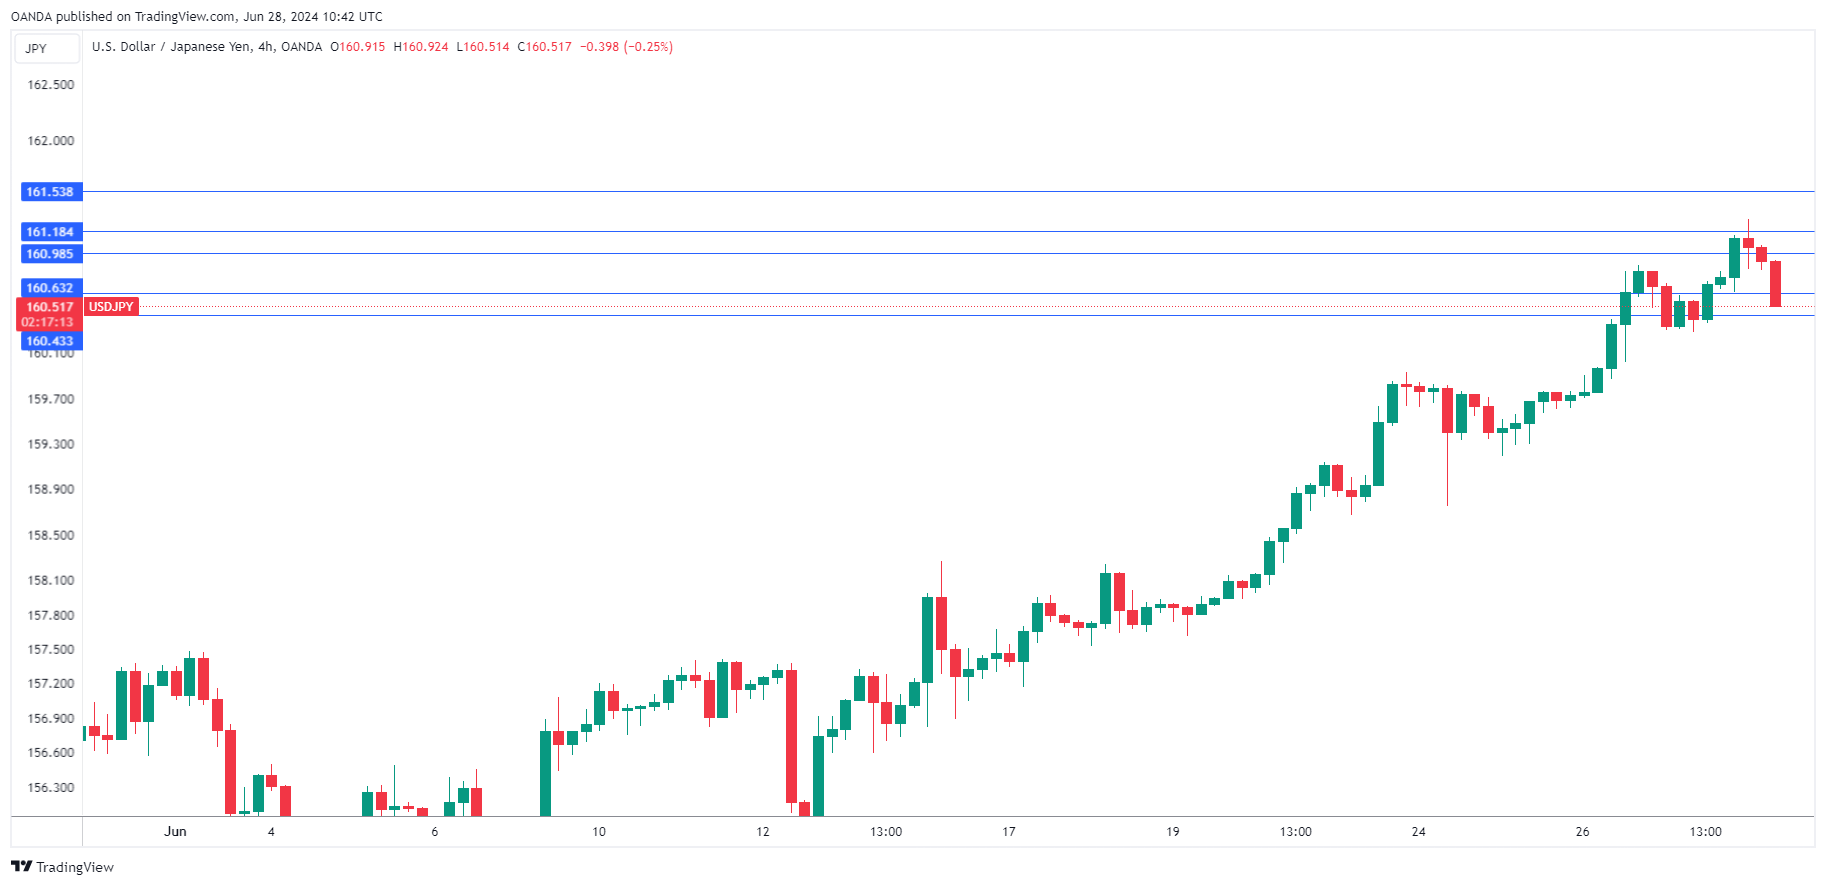
The Japanese yen is unchanged on Friday, but has managed to set a new low against the US dollar. The yen is trading at 160.72 in the European session and fell as low as 161.28 earlier, its lowest level since 1986.
Tokyo Core CPI accelerates to 2.1%
Tokyo core CPI, which excludes fresh food and is closely monitored by the Bank of Japan, climbed to 2.1% y/y in June, up from 1.9% in May and above the market estimate of 2%. The increase in inflation was driven by higher prices for electricity and natural gas. Headline CPI rose to 2.3%, up from 2.2% in April.
The inflation report keeps the pressure on the Bank of Japan to raise interest rates, but the central bank has been hesitant to make the move and the markets aren’t expecting a rate hike at the July meeting. Bank policy makers have been focused on demand-driven inflation and want further evidence that inflation is sustainable at 2% before raising rates.
What may prod the BoJ to raise rates in the near term is the slide of the Japanese yen. The yen is at a 38-year low against the greenback and has plunged about 14% this year. The BoJ intervened twice in the currency market recently and purchased some $61 billion worth of yen but that has failed to stem the bleeding.
Verbal intervention hasn’t had much effect and Japan’s top currency diplomat, Masato Kanda, was replaced by Atsushi Mimura on Friday. Kanda was considered aggressive with his jawboning and we’ll have to see if Mimura has any more success in defending the yen against speculators.
USD/JPY Technical
- USD/JPY pushed above resistance at 160.90 and 161.18 earlier. The next resistance line is 161.53
There is support at 160.63 and 160.43
EUR/USD Continues to Struggle Amid US Inflation Concerns
EUR/USD is on a downward trajectory on Friday, hovering around 1.0686 after a short-lived pause. The dollar experienced a temporary dip due to mixed American economic indicators and market anticipation ahead of the critical Core PCE inflation report, a significant factor in Federal Reserve decision-making.
Yesterday's data showed a larger-than-expected decrease in US unemployment claims and a modest rise in Durable Goods Orders for May, although Core PCE dipped. The final GDP figures for Q1 2024 were slightly adjusted upward, showing the US economy grew by 1.4% compared to the previously estimated 1.3%, in contrast to the 3.4% growth seen in Q4 2023.
US Treasury yields also saw a minor decline, contributing to the dollar's brief retreat. However, market dynamics are shifting as focus intensifies on today's economic releases, including the Core PCE data, personal income and expenditures, and the University of Michigan's May consumer sentiment index.
EUR/USD technical analysis
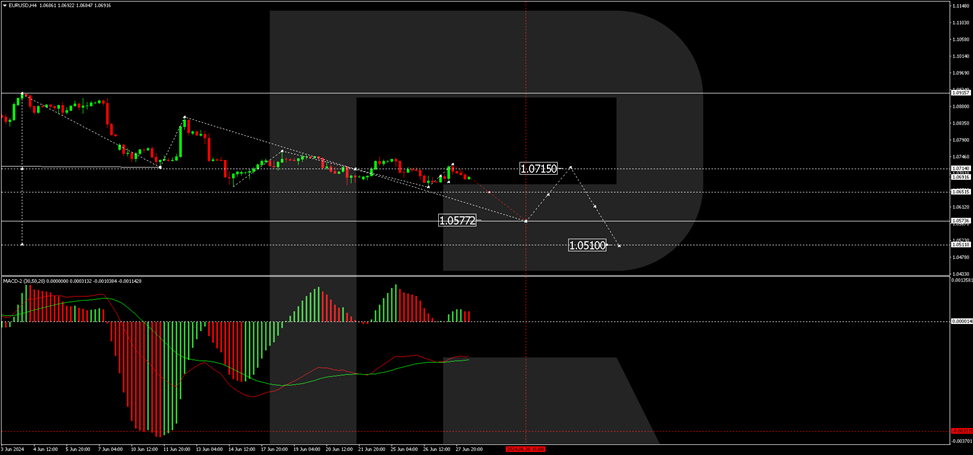
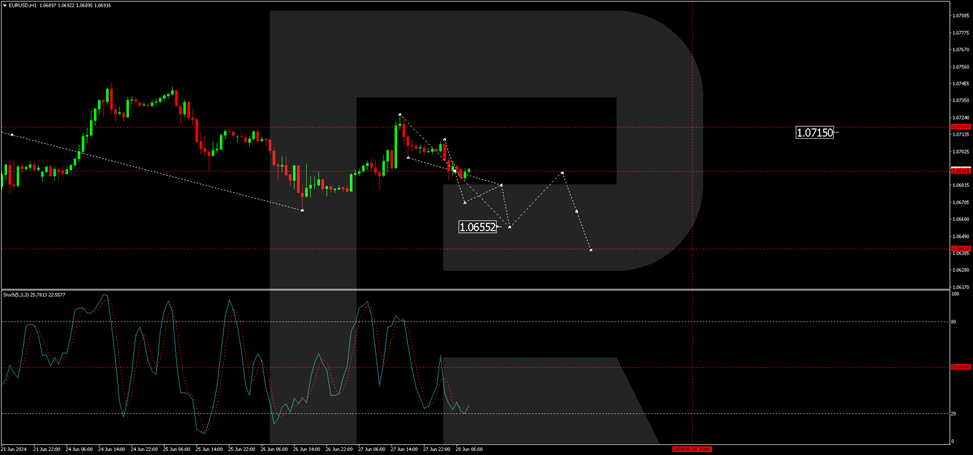
The EUR/USD has completed a downward movement to 1.0666 and corrected up to 1.0715. Currently, the market is forming another downward wave, targeting 1.0655. Should this level be reached, a rebound to 1.0690 is possible before continuing the downward trend towards at least 1.0577. This bearish outlook is supported by the MACD indicator, which remains below zero with a firm downward trajectory.
On the H1 chart, EUR/USD is consolidating around 1.0690. A downward breakout could lead to a continuation of the decline to 1.0655. Subsequently, a corrective move to 1.0690 may occur before a further drop to 1.0640. The Stochastic oscillator, hovering near 20, suggests potential for further declines before a rebound to 80 could happen, indicating volatile short-term movements.
Market outlook
Investors are advised to closely monitor the upcoming US economic data, which will likely influence Federal Reserve policy expectations and impact EUR/USD movements. The currency pair remains sensitive to shifts in US economic indicators and Federal Reserve signals regarding interest rates.
Fed’s Barkin: Economy not ready for rate cuts despite expectations
Richmond Fed President Thomas Barkin highlighted the divergence between expectations and reality of US monetary in a speech today. He noted, "Most anticipated we would be cutting rates by now, either because we returned inflation to target, or perhaps because the economy took a turn for the worse. Yet, in contrast to the European Central Bank, that has not yet been the case."
Barkin elaborated on the unique challenges facing the US economy, emphasizing that monetary policy operates with "long and variable lags." He suggested that these lags might be longer than expected due to factors such as labor hoarding, excess savings, delayed exposure to interest rate hikes, and newfound pricing power among businesses.
Furthermore, Barkin raised the possibility that the Fed's rate hikes might not be constraining the economy as much as anticipated. He pointed to the concept of r-star, the neutral real rate of interest, suggesting it might have shifted to a higher level. "It is too soon to tell, but there's one way to find out: Proceed deliberately while keeping a close eye on the real economy. And that's what I am doing," Barkin stated.
CAD: GDP Data Incoming
The Canadian Dollar (CAD) saw volatile movement on Thursday due to mixed US economic data and a lack of domestic updates. With Canada absent from the economic calendar until Friday's GDP report, the CAD was influenced by US figures. Markets are now focused on the upcoming US Personal Consumption Expenditure (PCE) Price Index, a critical inflation measure for the Federal Reserve, set for release on Friday. This US inflation data is expected to overshadow the Canadian GDP figures in terms of market impact. Traders are anticipating significant market reactions to the US price growth data at the end of the trading week.
EURCAD – H1 Timeframe
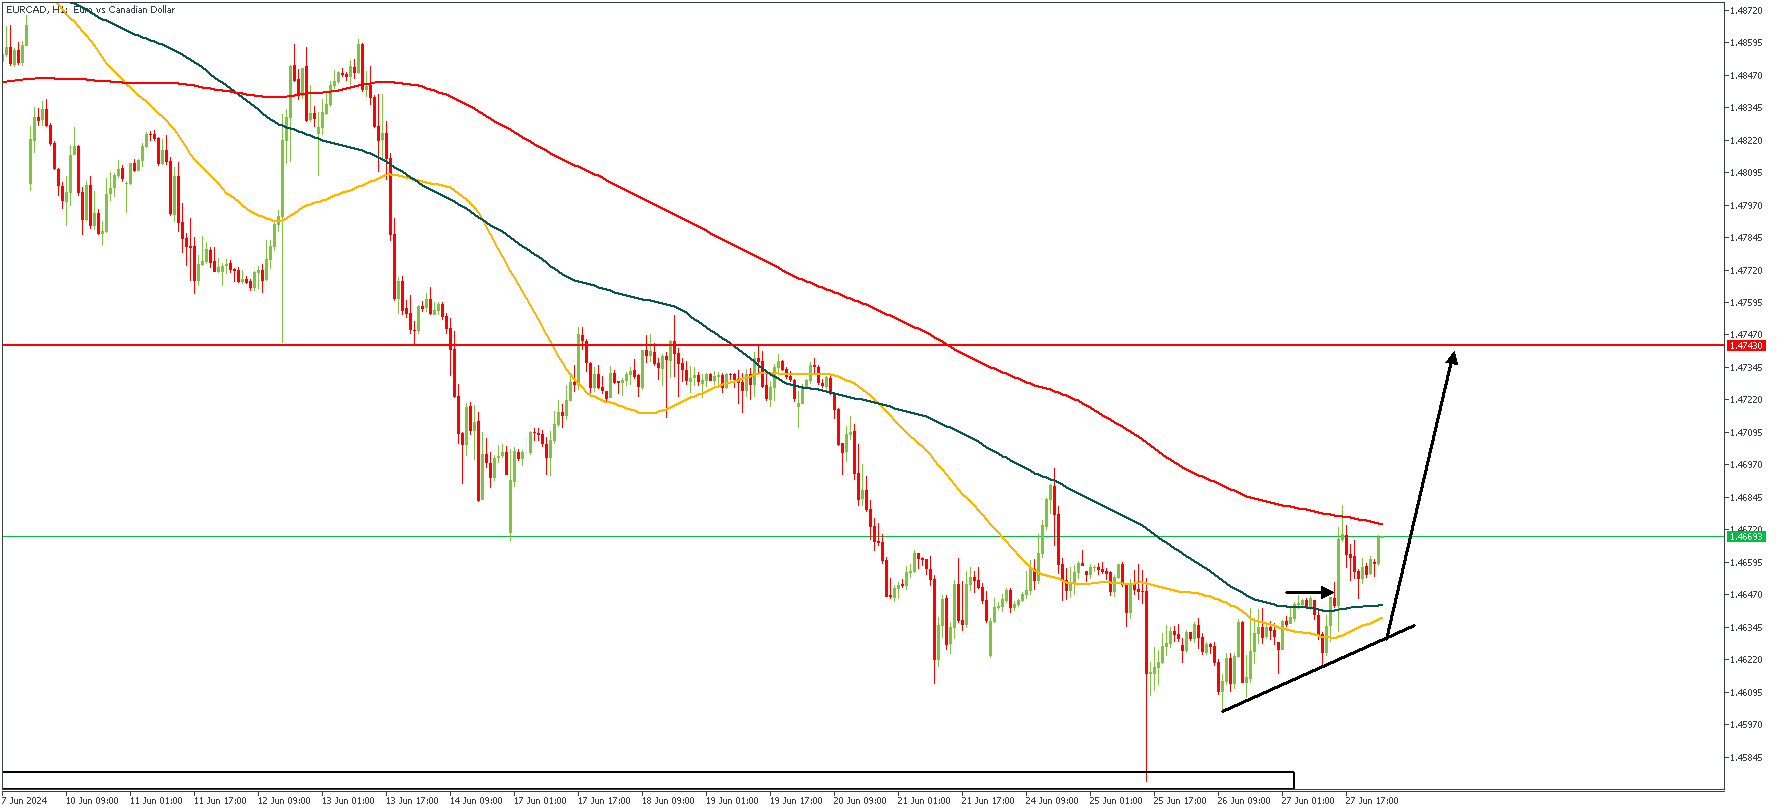
I know you’re tempted to interpret the 1-hour EURCAD chart above as a bearish trend, however, let’s break it down critically before you do. Here, we see the moving averages in a bearish array, but you see the wick-ed reaction from the Daily timeframe demand zone at the bottom of the chart tells a different story. And as a result of that rejection from the demand zone, we’ve seen a bullish break of structure and a trendline support created. Should the trendline support hold when tested, the bullish sentiment would be explicitly confirmed.
Analyst’s Expectations:
- Direction: Bullish
- Target: 1.47430
- Invalidation: 1.46082
AUDCAD – H2 Timeframe
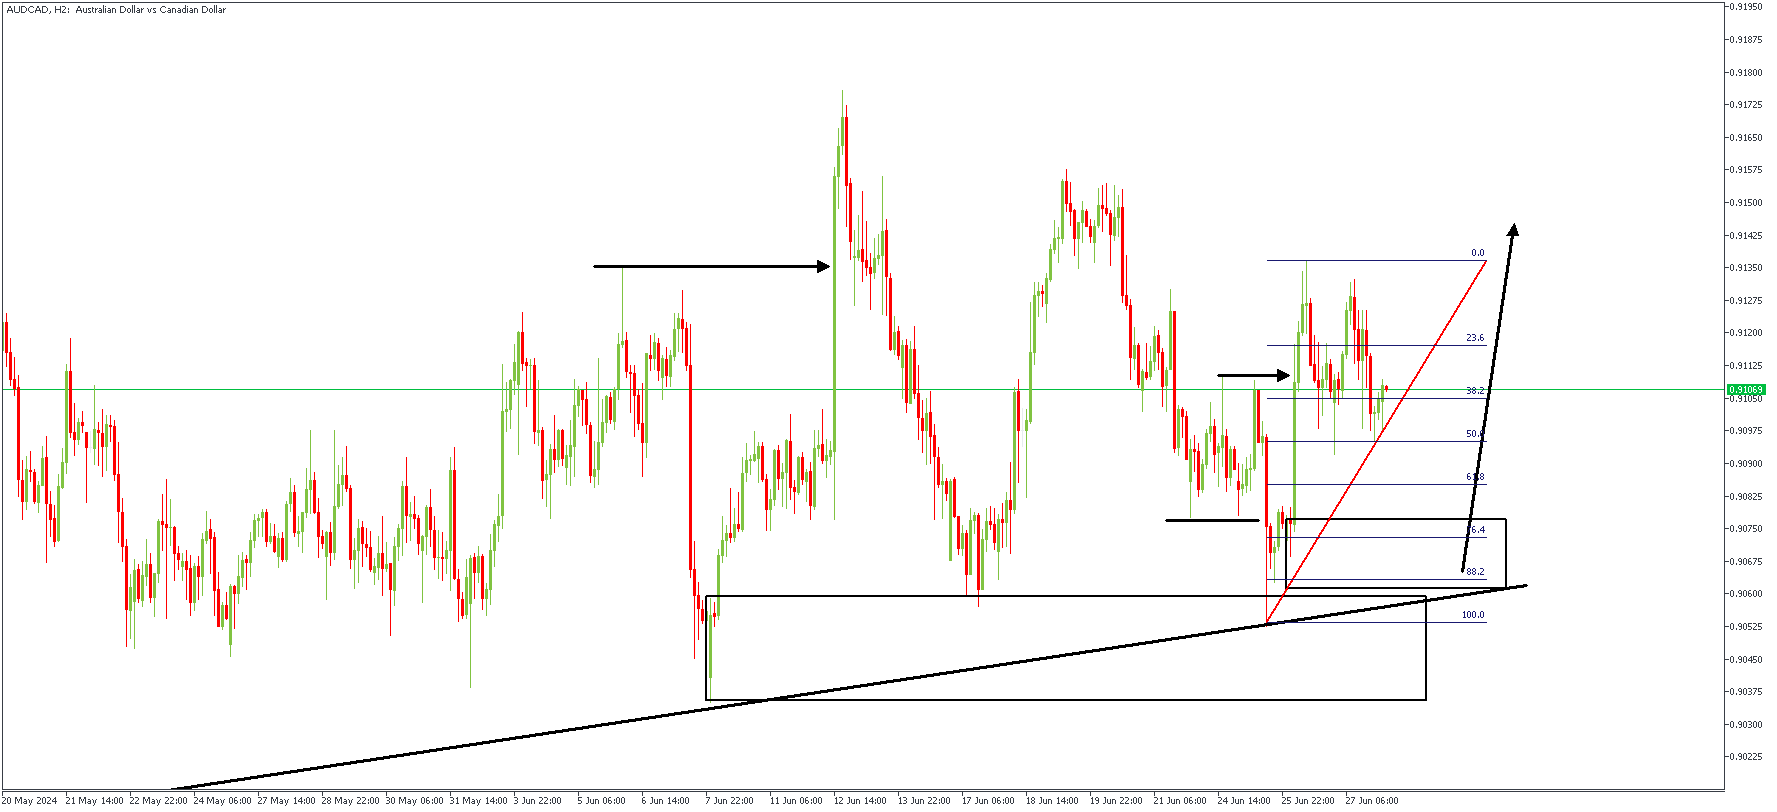
The first horizontal arrow from the left of the attached AUDCAD 2-hour chart marks the bullish break of structure. The impulse originated from the highlighted demand zone, which has been retested twice already. The most recent rejection formed a SBR (Sweep-Break-Retest) pattern, which means that we’re simply now waiting for price to retest the demand zone at the 76% region of the Fibonacci retracement tool in order to find confirmation for our bullish sentiment.
Analyst’s Expectations:
- Direction: Bullish
- Target: 0.91415
- Invalidation: 0.90493
GBPJPY Unlocks New 16-Year High
- GBPJPY posts several green days
- RSI and stochastics are overstretched
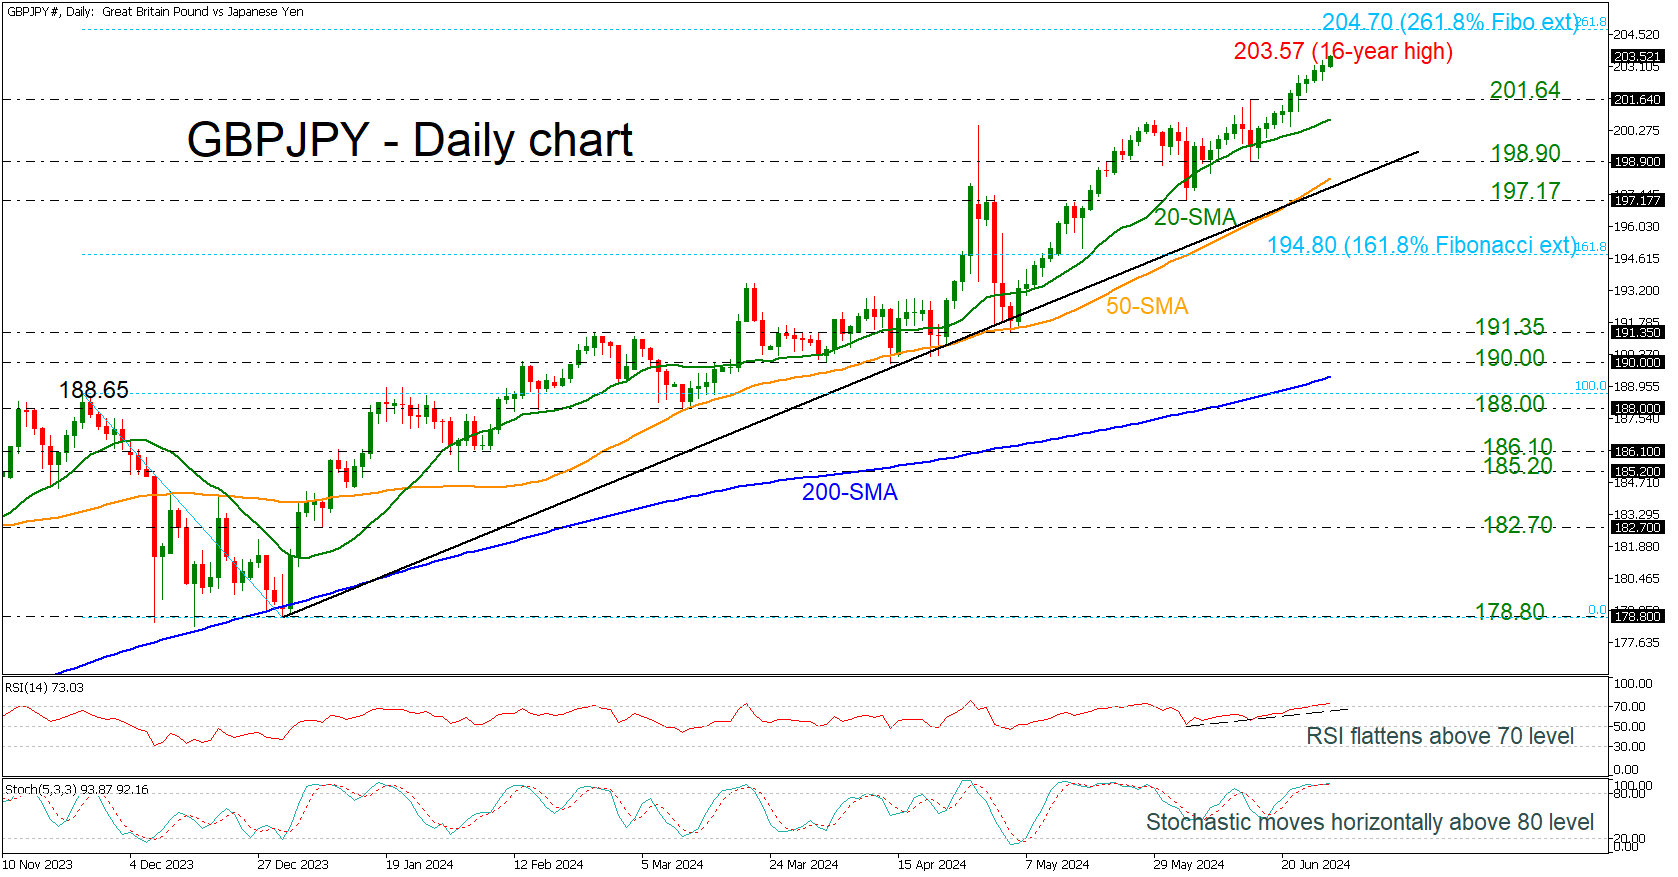
GBPJPY is recording the tenth consecutive green day, posting a fresh 16-year high of 203.57. The market is looking positive, but the technical oscillators are suggesting overstretched momentum. The RSI is flattening near the 70 level, while the stochastic is moving horizontally above the 80 level.
More increases would drive the pair towards the 261.8% Fibonacci extension level of the downward wave from 188.65 to 178.80 at 204.70. Even higher, the next round numbers such as 205.00 and 206.00 may halt bullish actions.
However, a downside correction may initially find support at the 201.64 level, which is the previous peak. Below this, the 20-day simple moving average at 200.80 and the 198.90 barrier, which lies near the long-term uptrend line, may be the next returning point.
Summarizing, GBPJPY is extending its bullish structure, but the technical oscillators indicate negative retracement.
Market Analysis: GBP/USD Turns Red While USD/CAD Rallies
GBP/USD declined below the 1.2670 support zone. USD/CAD is rising and might aim for more gains above the 1.3735 resistance.
Important Takeaways for GBP/USD and USD/CAD Analysis Today
- The British Pound started a fresh decline from the 1.2700 resistance zone.
- There is a key bearish trend line forming with resistance at 1.2640 on the hourly chart of GBP/USD at FXOpen.
- USD/CAD is showing positive signs above the 1.3675 support zone.
- There is a major bullish trend line forming with support at 1.3705 on the hourly chart at FXOpen.
GBP/USD Technical Analysis
On the hourly chart of GBP/USD at FXOpen, the pair started a fresh decline from the 1.2700 zone. The British Pound traded below the 1.2670 support to move into further a bearish zone against the US Dollar.
The pair even traded below 1.2640 and the 50-hour simple moving average. Finally, the bulls appeared near the 1.2625 level. A low was formed at 1.2621 and the pair is now consolidating losses below the 23.6% Fib retracement level of the downward move from the 1.2670 swing high to the 1.2621 low.
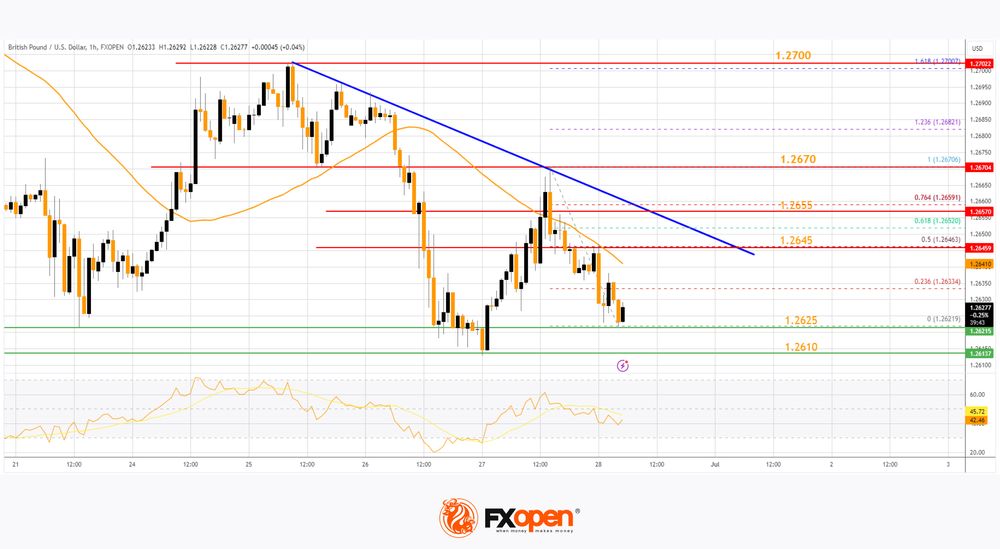
Immediate resistance on the upside is near a key bearish trend line at 1.2645. The trend line is close to the 50% Fib retracement level of the downward move from the 1.2670 swing high to the 1.2621 low.
The first major resistance is near the 1.2655 zone. The main hurdle sits at 1.2670. A close above the 1.2670 resistance might spark a steady upward move. The next major resistance is near the 1.2700 zone. Any more gains could lead the pair toward the 1.2740 resistance in the near term.
Initial support on the GBP/USD chart sits at 1.2625. The next major support sits at 1.2600, below which there is a risk of another sharp decline. In the stated case, the pair could drop toward 1.2550.
USD/CAD Technical Analysis
On the hourly chart of USD/CAD at FXOpen, the pair formed a strong support base above the 1.3640 level. The US Dollar started a fresh increase above the 1.3675 resistance against the Canadian Dollar.
The bulls pushed the pair above the 1.3685 and 1.3700 levels. The pair cleared the 50-hour simple moving average and climbed above 1.3720. A high was formed at 1.3734 and the pair is now consolidating gains.
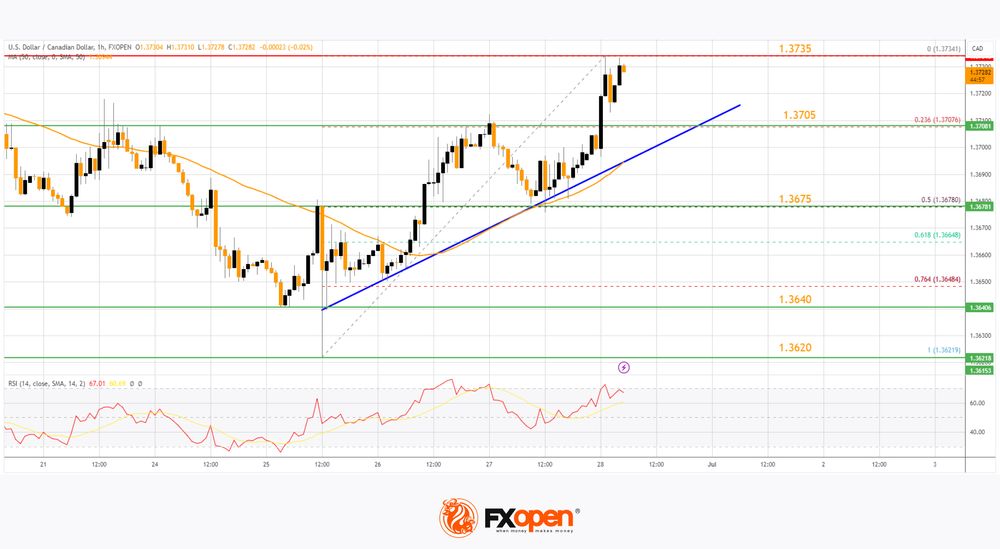
Initial support is near a major bullish trend line at 1.3705. The trend line is close to the 23.6% Fib retracement level of the upward move from the 1.3621 swing low to the 1.3734 high.
The next major support is near 1.3675 or the 50% Fib retracement level of the upward move from the 1.3621 swing low to the 1.3734 high on the same USD/CAD chart. The main support sits near the 1.3640 zone.
A downside break below the 1.3640 level could push the pair further lower. The next major support is near the 1.3620 support zone, below which the pair might visit 1.3550.
If there is another increase, the pair might face resistance near the 1.3735 level. A clear upside break above 1.3735 could start another steady increase. The next major resistance is the 1.3750 level.
A close above the 1.3750 level might send the pair toward the 1.3800 level. Any more gains could open the doors for a test of the 1.3850 level.
Trade over 50 forex markets 24 hours a day with FXOpen. Take advantage of low commissions, deep liquidity, and spreads from 0.0 pips. Open your FXOpen account now or learn more about trading forex with FXOpen.
This article represents the opinion of the Companies operating under the FXOpen brand only. It is not to be construed as an offer, solicitation, or recommendation with respect to products and services provided by the Companies operating under the FXOpen brand, nor is it to be considered financial advice.
EUR/USD Daily Outlook
Daily Pivots: (S1) 1.0678; (P) 1.0703; (R1) 1.0728; More....
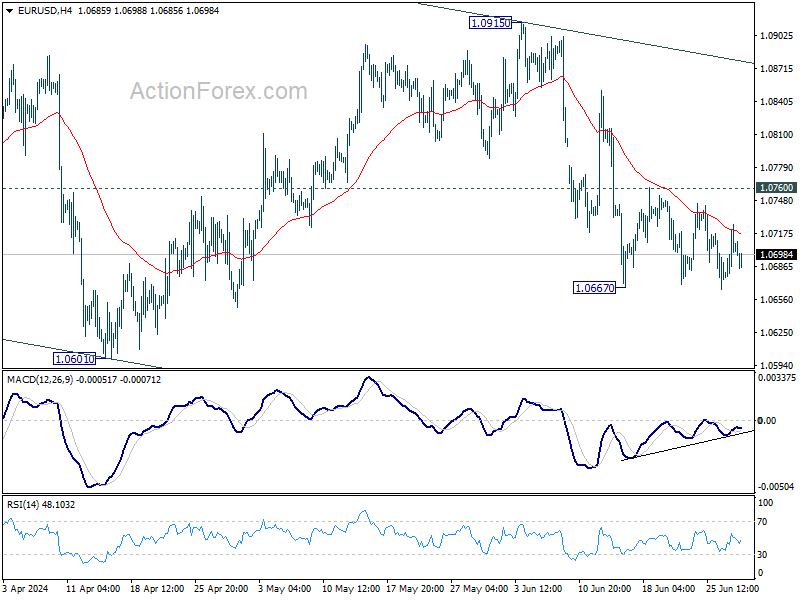
Range trading continues in EUR/USD and intraday bias remains neutral. Outlook stays bearish with 1.0760 resistance intact. Decline from 1.0915 is seen as another leg in the larger corrective pattern. Firm break of 1.0667 will target 1.0601 and below. However, decisive break of 1.0760 will turn intraday bias back to the upside for stronger rebound.
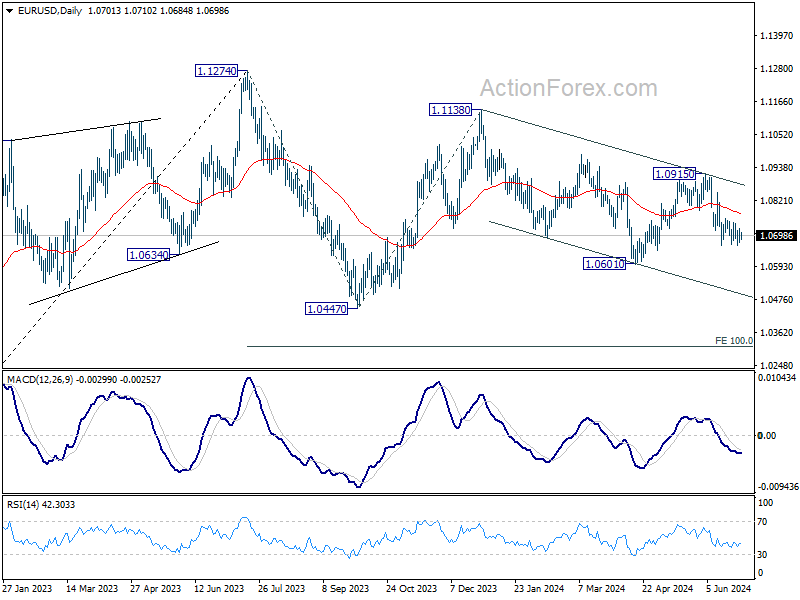
In the bigger picture, price actions from 1.1274 are viewed as a corrective pattern that's still in progress. Break of 1.0601 will target 1.0447 support and possibly further to 100% projection of 1.1274 to 1.0447 from 1.1138 at 1.0311. For now, this will remain the favored case as long as 1.0915 resistance holds, in case of rebound.
GBP/USD Daily Outlook
Daily Pivots: (S1) 1.2612; (P) 1.2641; (R1) 1.2670; More...
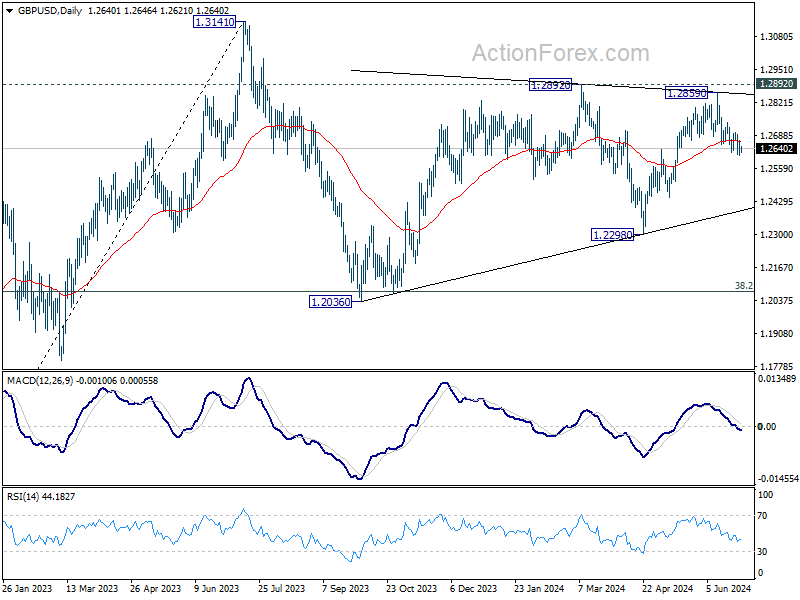
No change in GBP/USD's outlook and further decline is expected with 1.2702 resistance intact. Sustained trading below 1.2633 resistance turned support will argue that whole rise from 1.2298 has completed, and target 1.2445 and below. On the upside, however, firm break of 1.2702 resistance will argue that pull back from 1.2859 has completed, and bring retest of this high instead.
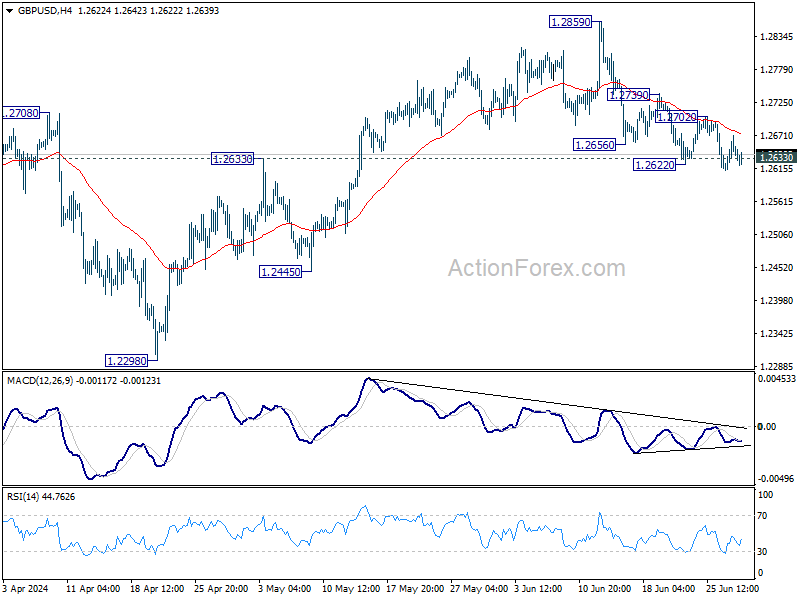
In the bigger picture, price actions from 1.3141 medium term top are seen as a corrective pattern that is still in progress. Break of 1.2445 support will confirm that another falling leg has started and target 1.2036 cluster support again (38.2% retracement of 1.0351 (2022 low) to 1.3141 at 1.2075. Nevertheless, break of 1.2892 resistance will argue that larger up trend from 1.0351is ready to resume through 1.3141.